Copyright
©The Author(s) 2025.
World J Cardiol. Jun 26, 2025; 17(6): 104832
Published online Jun 26, 2025. doi: 10.4330/wjc.v17.i6.104832
Published online Jun 26, 2025. doi: 10.4330/wjc.v17.i6.104832
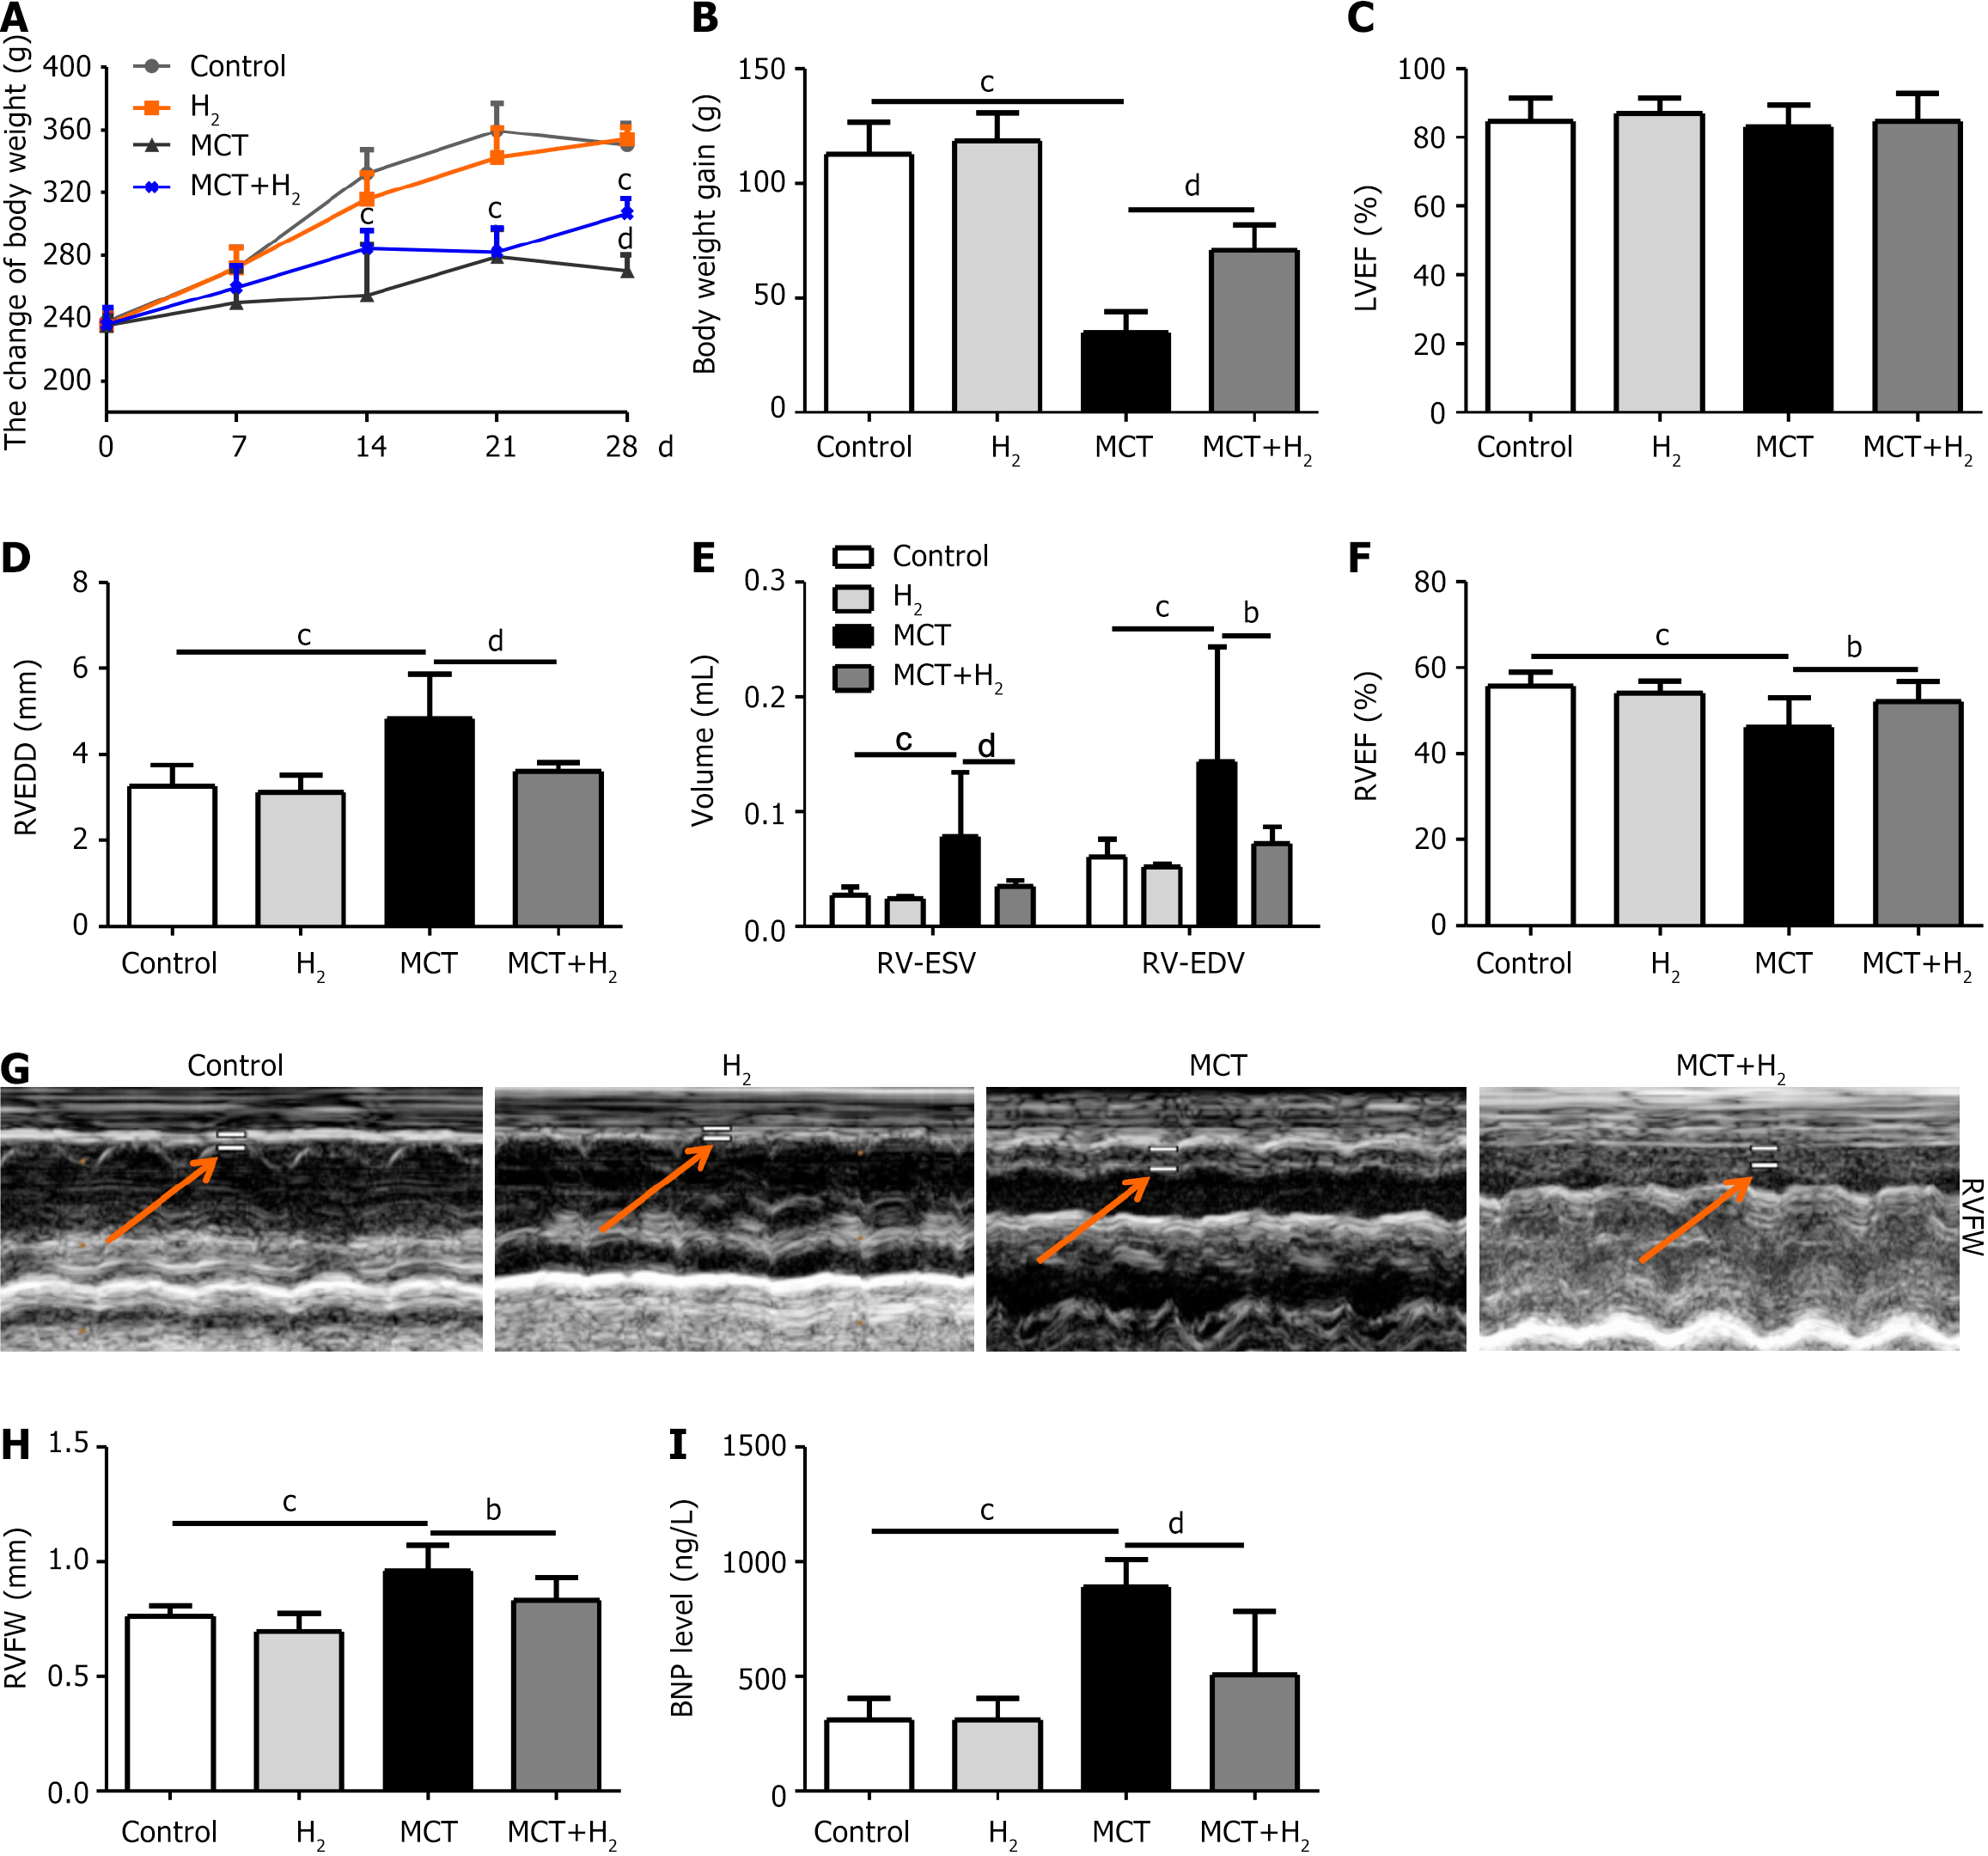
Figure 1 H2 inhalation improved body weight and cardiac function in monocrotaline-treated rats.
A: Body weight (BW) changes in each group; n = 10; B: BW gain of each group 28 days after monocrotaline (MCT) injection; n = 10; C: Right ventricular ejection fraction (RVEF) of all groups; n = 10; D: Right ventricular (RV) end-diastolic dimension of all groups; n = 10; E: RV end-systolic volume and RV end-diastolic volume of all groups; n = 10; F: RVEF of all groups; n = 10; G: Representative echocardiographic images showing the RV free-wall (RVFW) thickness (at orange arrow, between white lines); n = 10; H: RVFW of each group; n = 10; I: Serum brain natriuretic peptide levels, as assessed by ELISA; n = 10. Data are expressed as the mean ± SD. cP < 0.01 MCT group vs control group; bP < 0.05 and dP < 0.01: MCT+H2 group vs MCT group. MCT: Monocrotaline; LVEF: Left ventricular ejection fraction; RVEDD: RV end-diastolic dimension; RV-ESV: RV end-systolic volume; RV-EDV: RV end-diastolic volume; RVEF: RV ejection fraction; RVFW: RV free-wall; H2: Hydrogen.
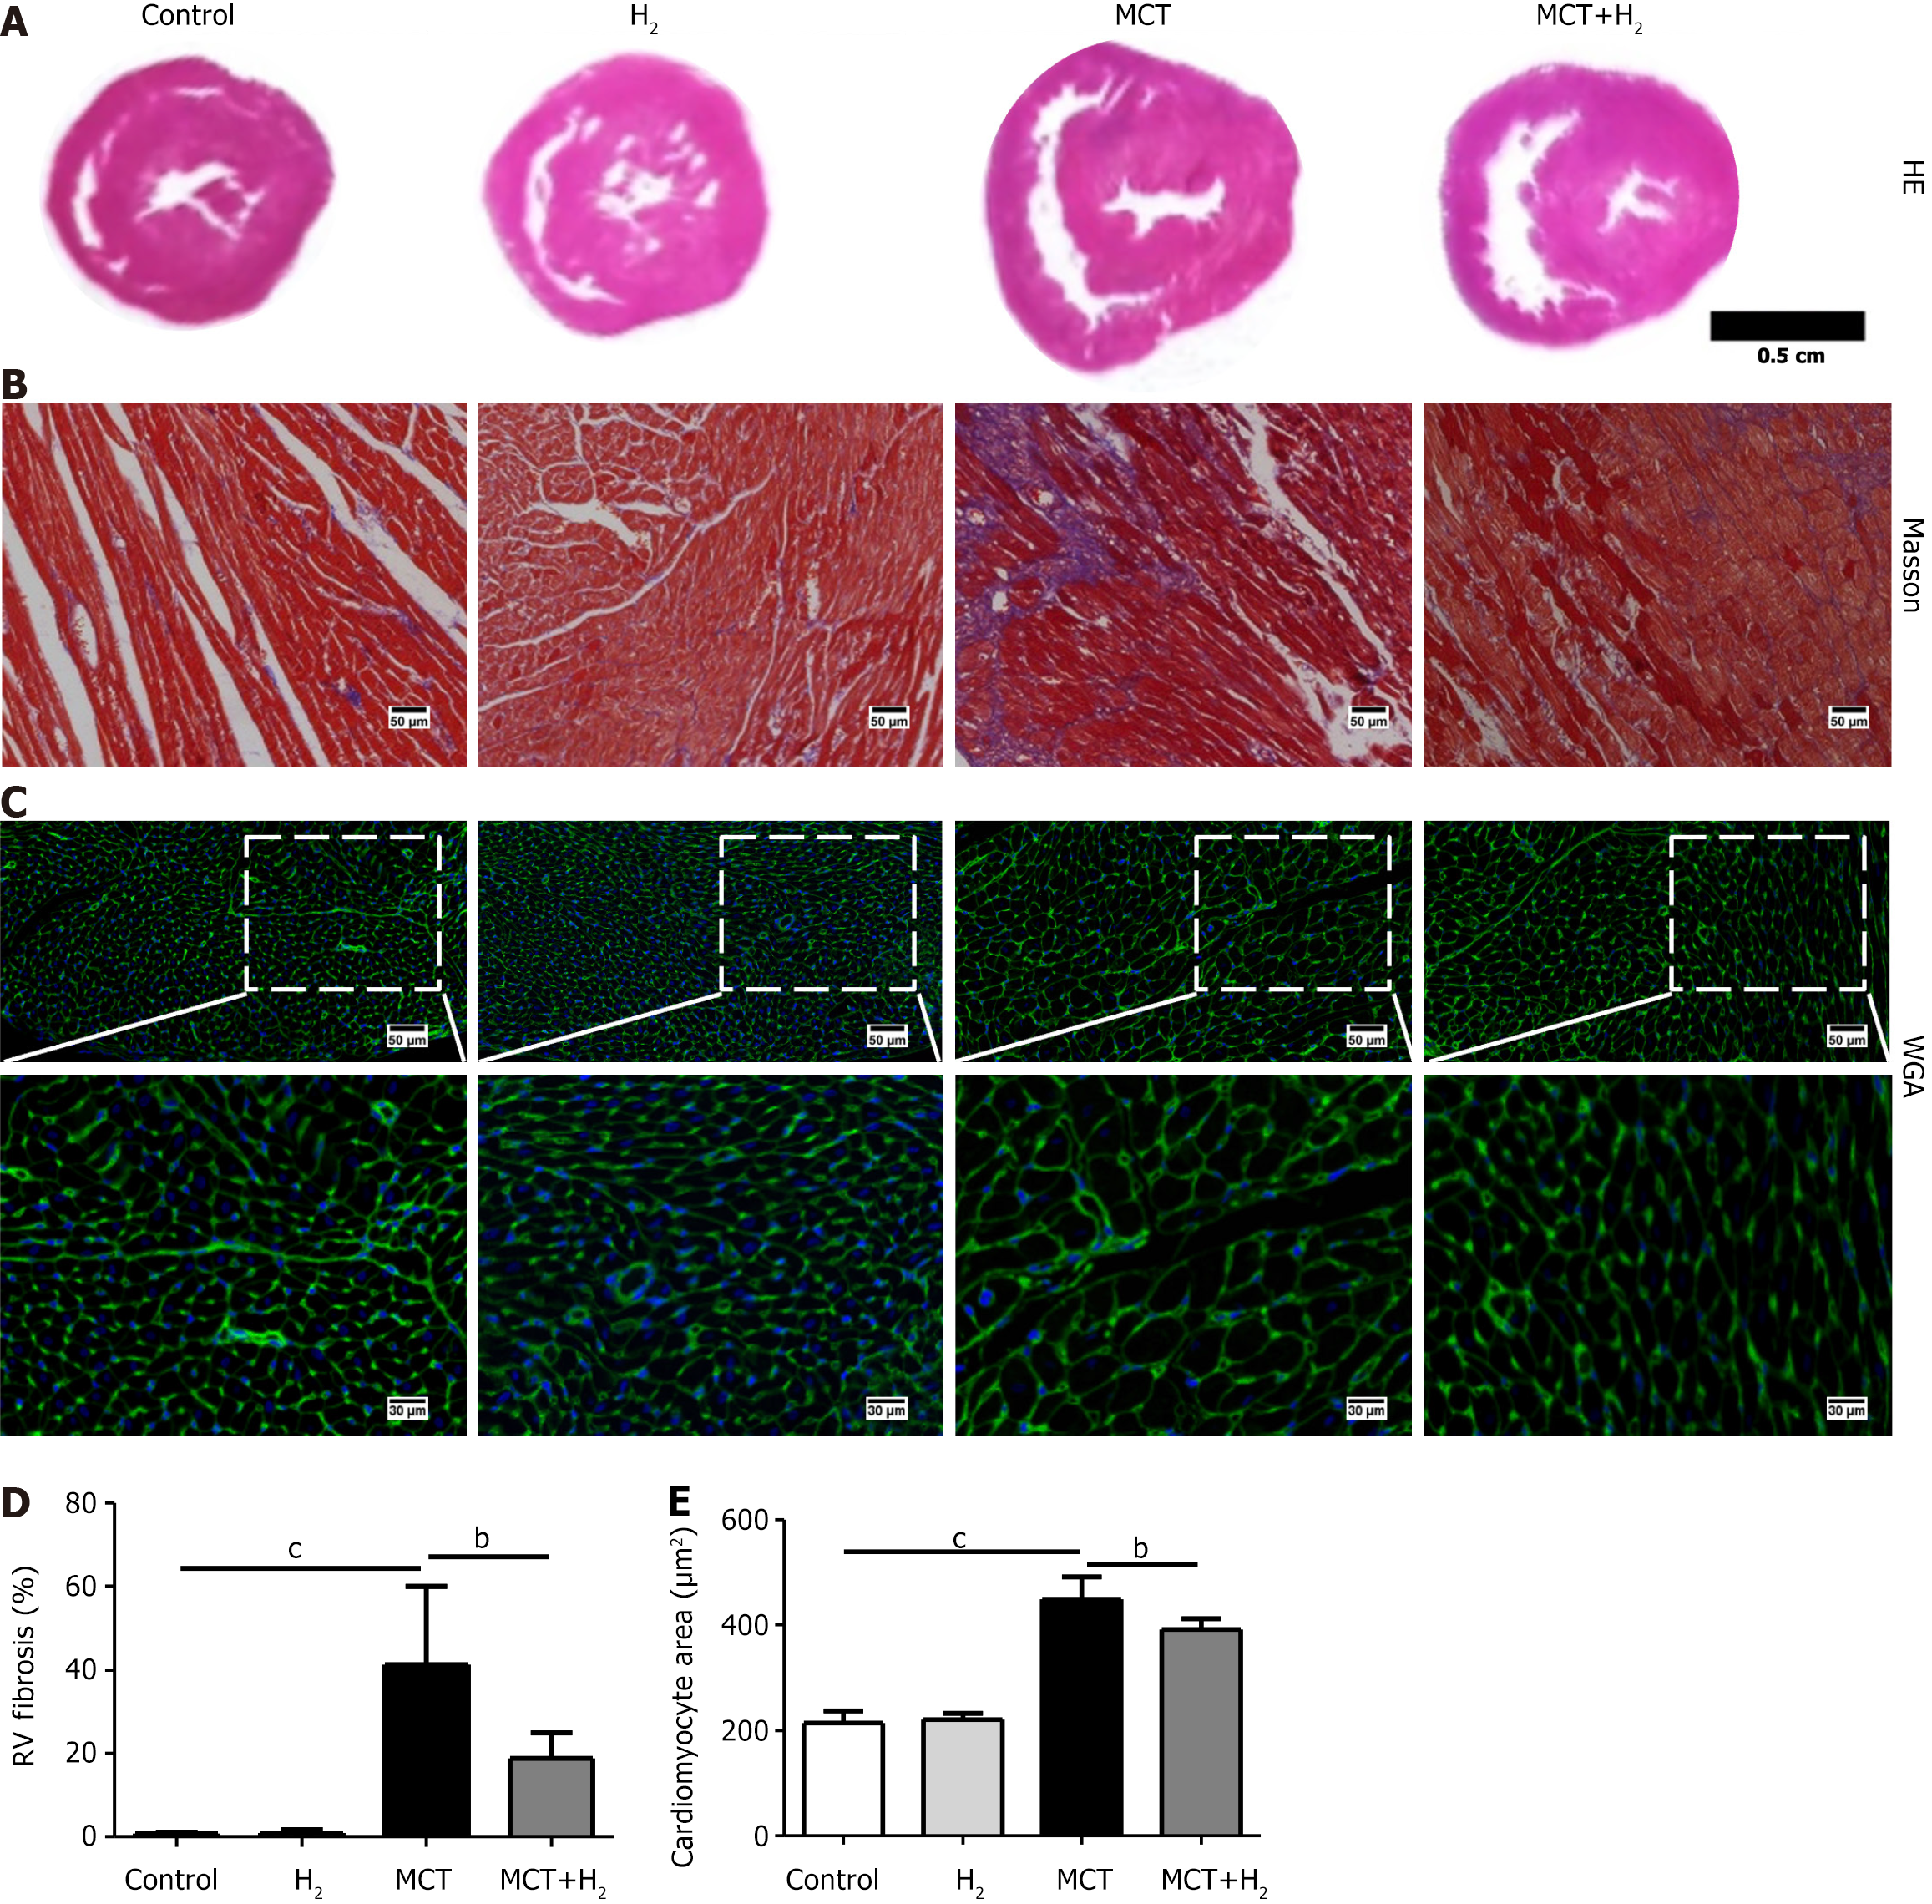
Figure 2 Hydrogen inhalation alleviated cardiomyocyte area and fibrosis in monocrotaline-treated rats.
A: Representative images of hematoxylin-eosin staining of heart tissue; n = 4; B: Representative images of Masson staining of heart tissue; n = 4; C: Representative images of wheat germ agglutinin staining of right ventricular tissue. Magnification is 20 ×. Scale bar = 50 µm; D: Analysis of the Masson staining of heart tissue; n = 4; E: Analysis of the cardiomyocyte area; n = 4. Data are expressed as the mean ± SD. bP < 0.05 MCT+H2 group vs MCT group; cP < 0.01: MCT group vs control group. MCT: Monocrotaline; H2: Hydrogen; WGA: Wheat germ agglutinin.
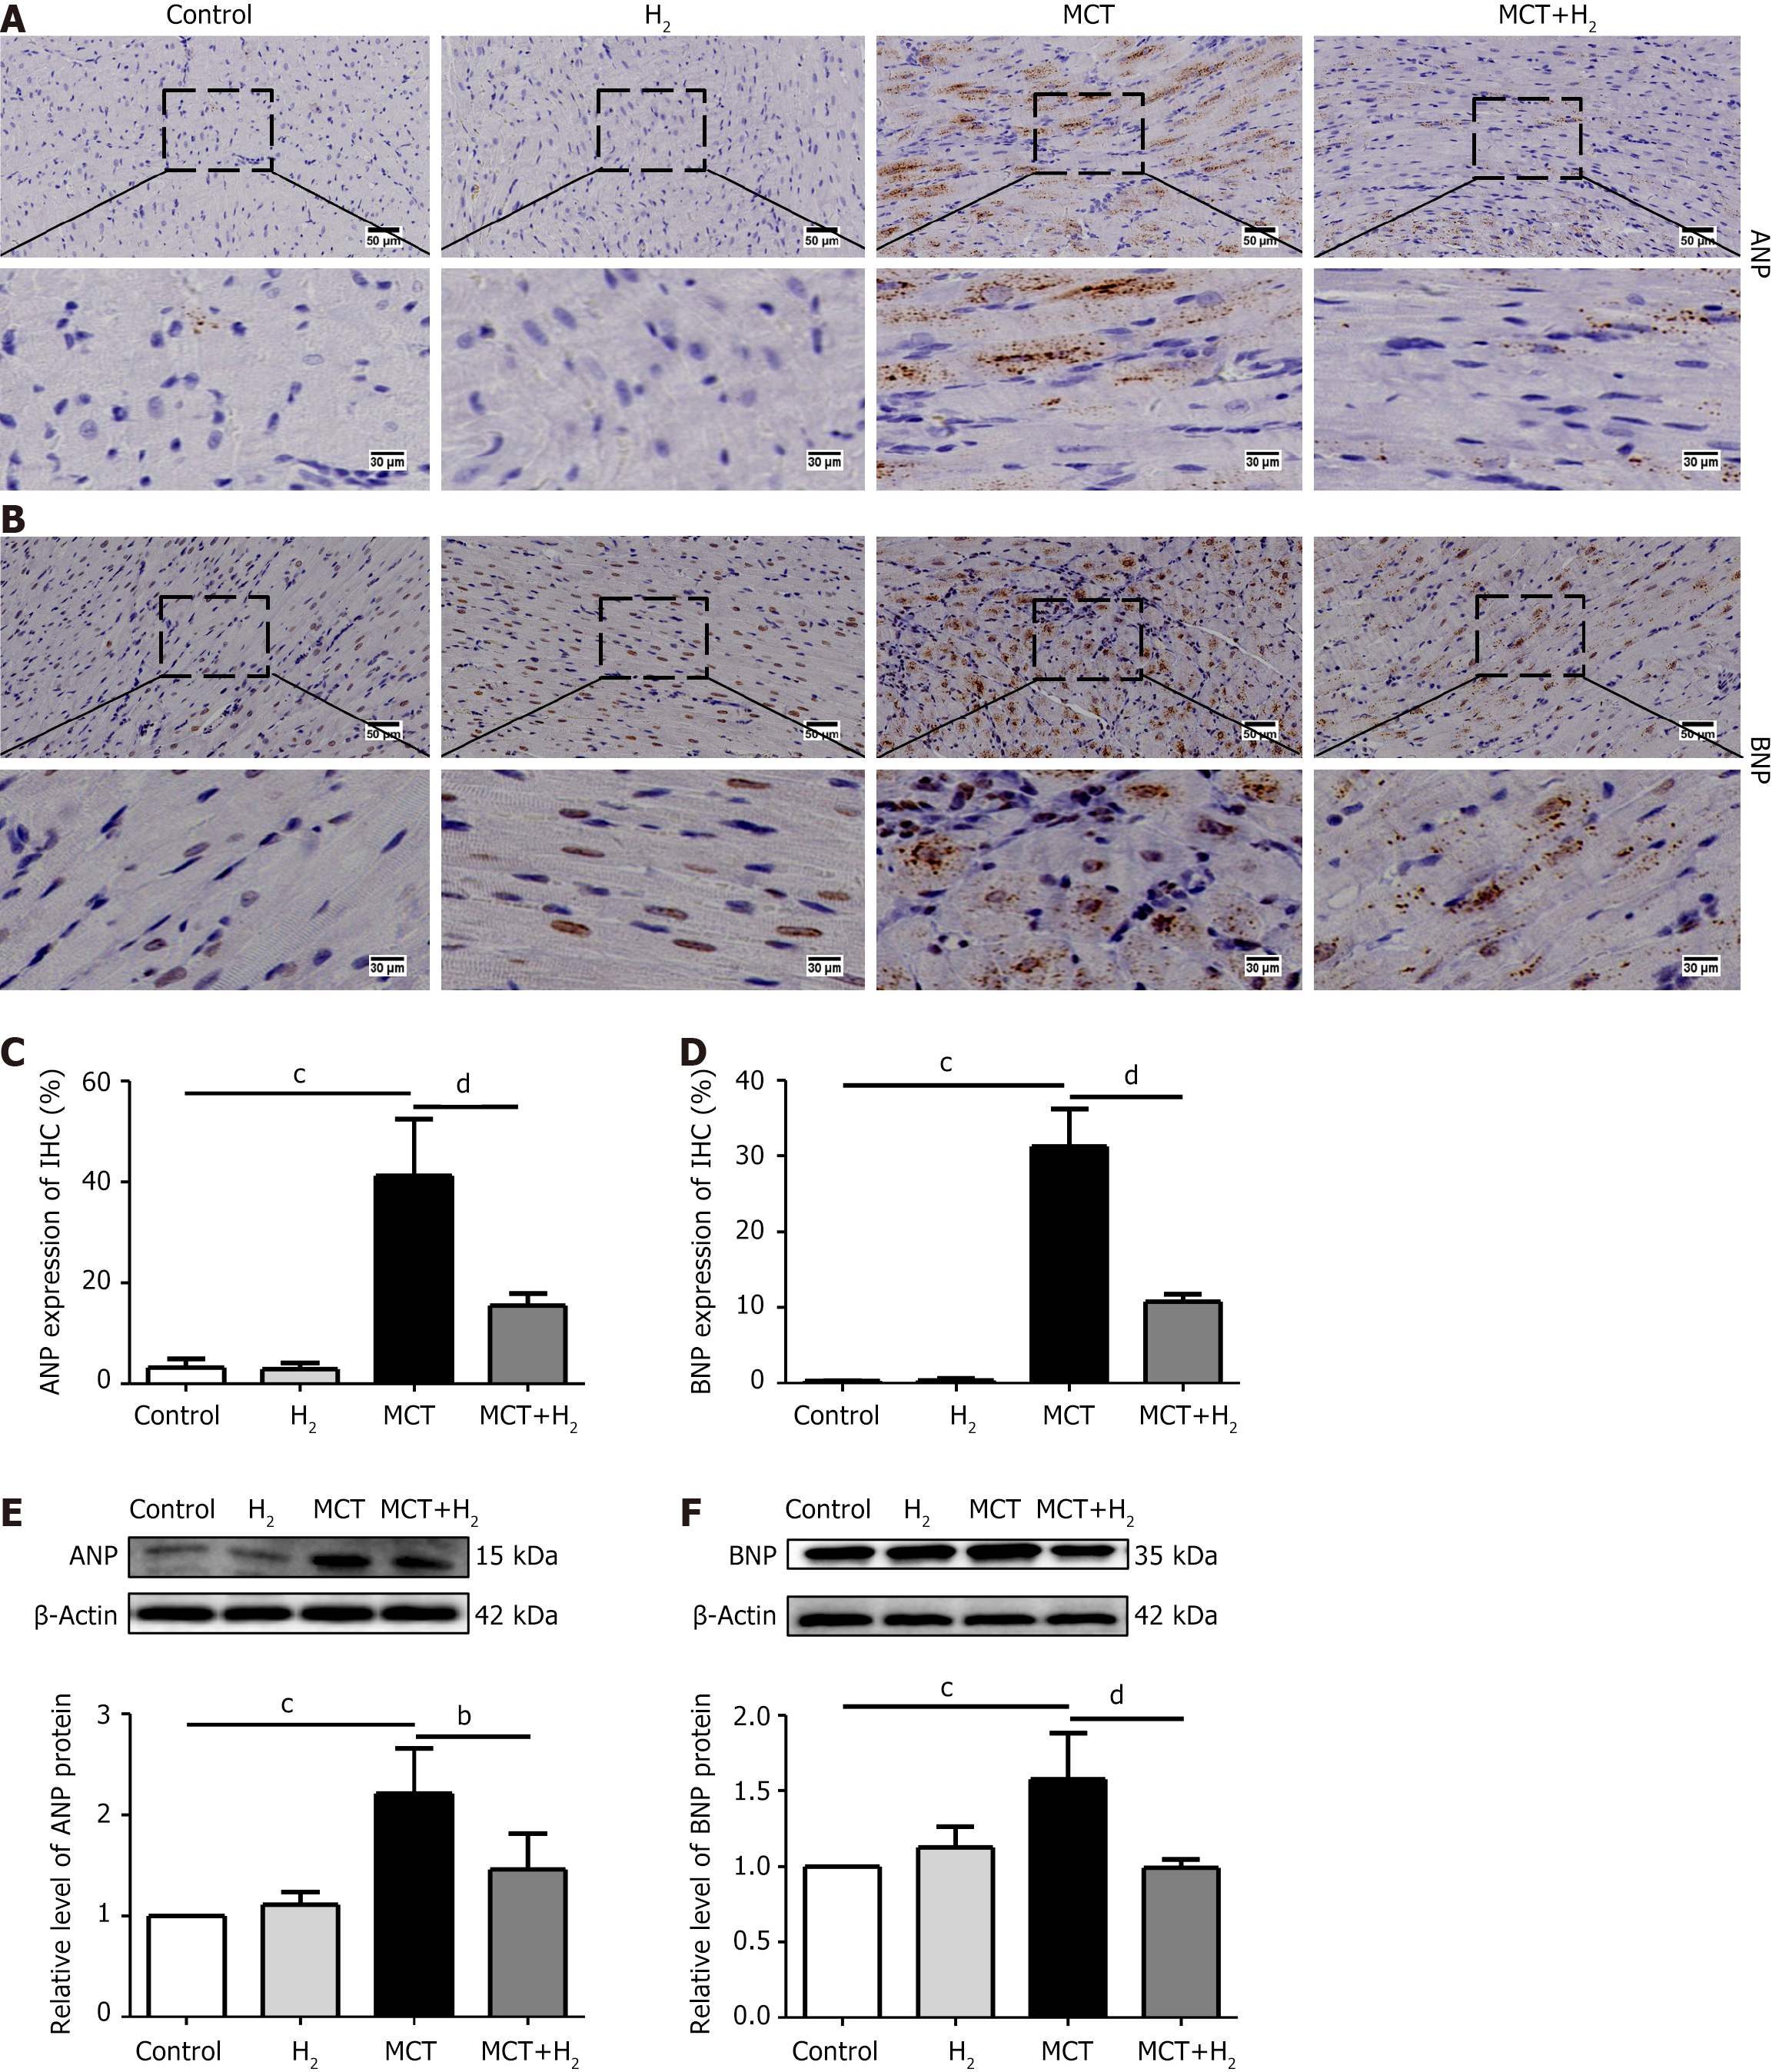
Figure 3 Hydrogen inhalation further reduced the expression of hypertrophy-related indicators in monocrotaline-treated rats.
A: Representative images of immunohistochemistry (IHC) staining of Antinatriuretic peptide A (ANP). ANP proteins were stained brown. Magnification is 20 ×. Scale bar = 50 µm; B: Representative images of IHC staining of brain natriuretic peptide (BNP). BNP proteins were stained brown. Magnification is 20 ×. Scale bar = 50 µm; C: Quantitative analysis of IHC staining of ANP; n = 4; D: Quantitative analysis of IHC staining of BNP; n = 4; E and F: Representative western blotting bands of ANP and BNP proteins and their relative levels; n = 3. Data are expressed as the mean ± SD. cP < 0.01: MCT group vs control group; bP < 0.05 and dP < 0.01: MCT+H2 group vs MCT group. ANP: Antinatriuretic peptide A; BNP: Brain natriuretic peptide; MCT: Monocrotaline; H2: Hydrogen.
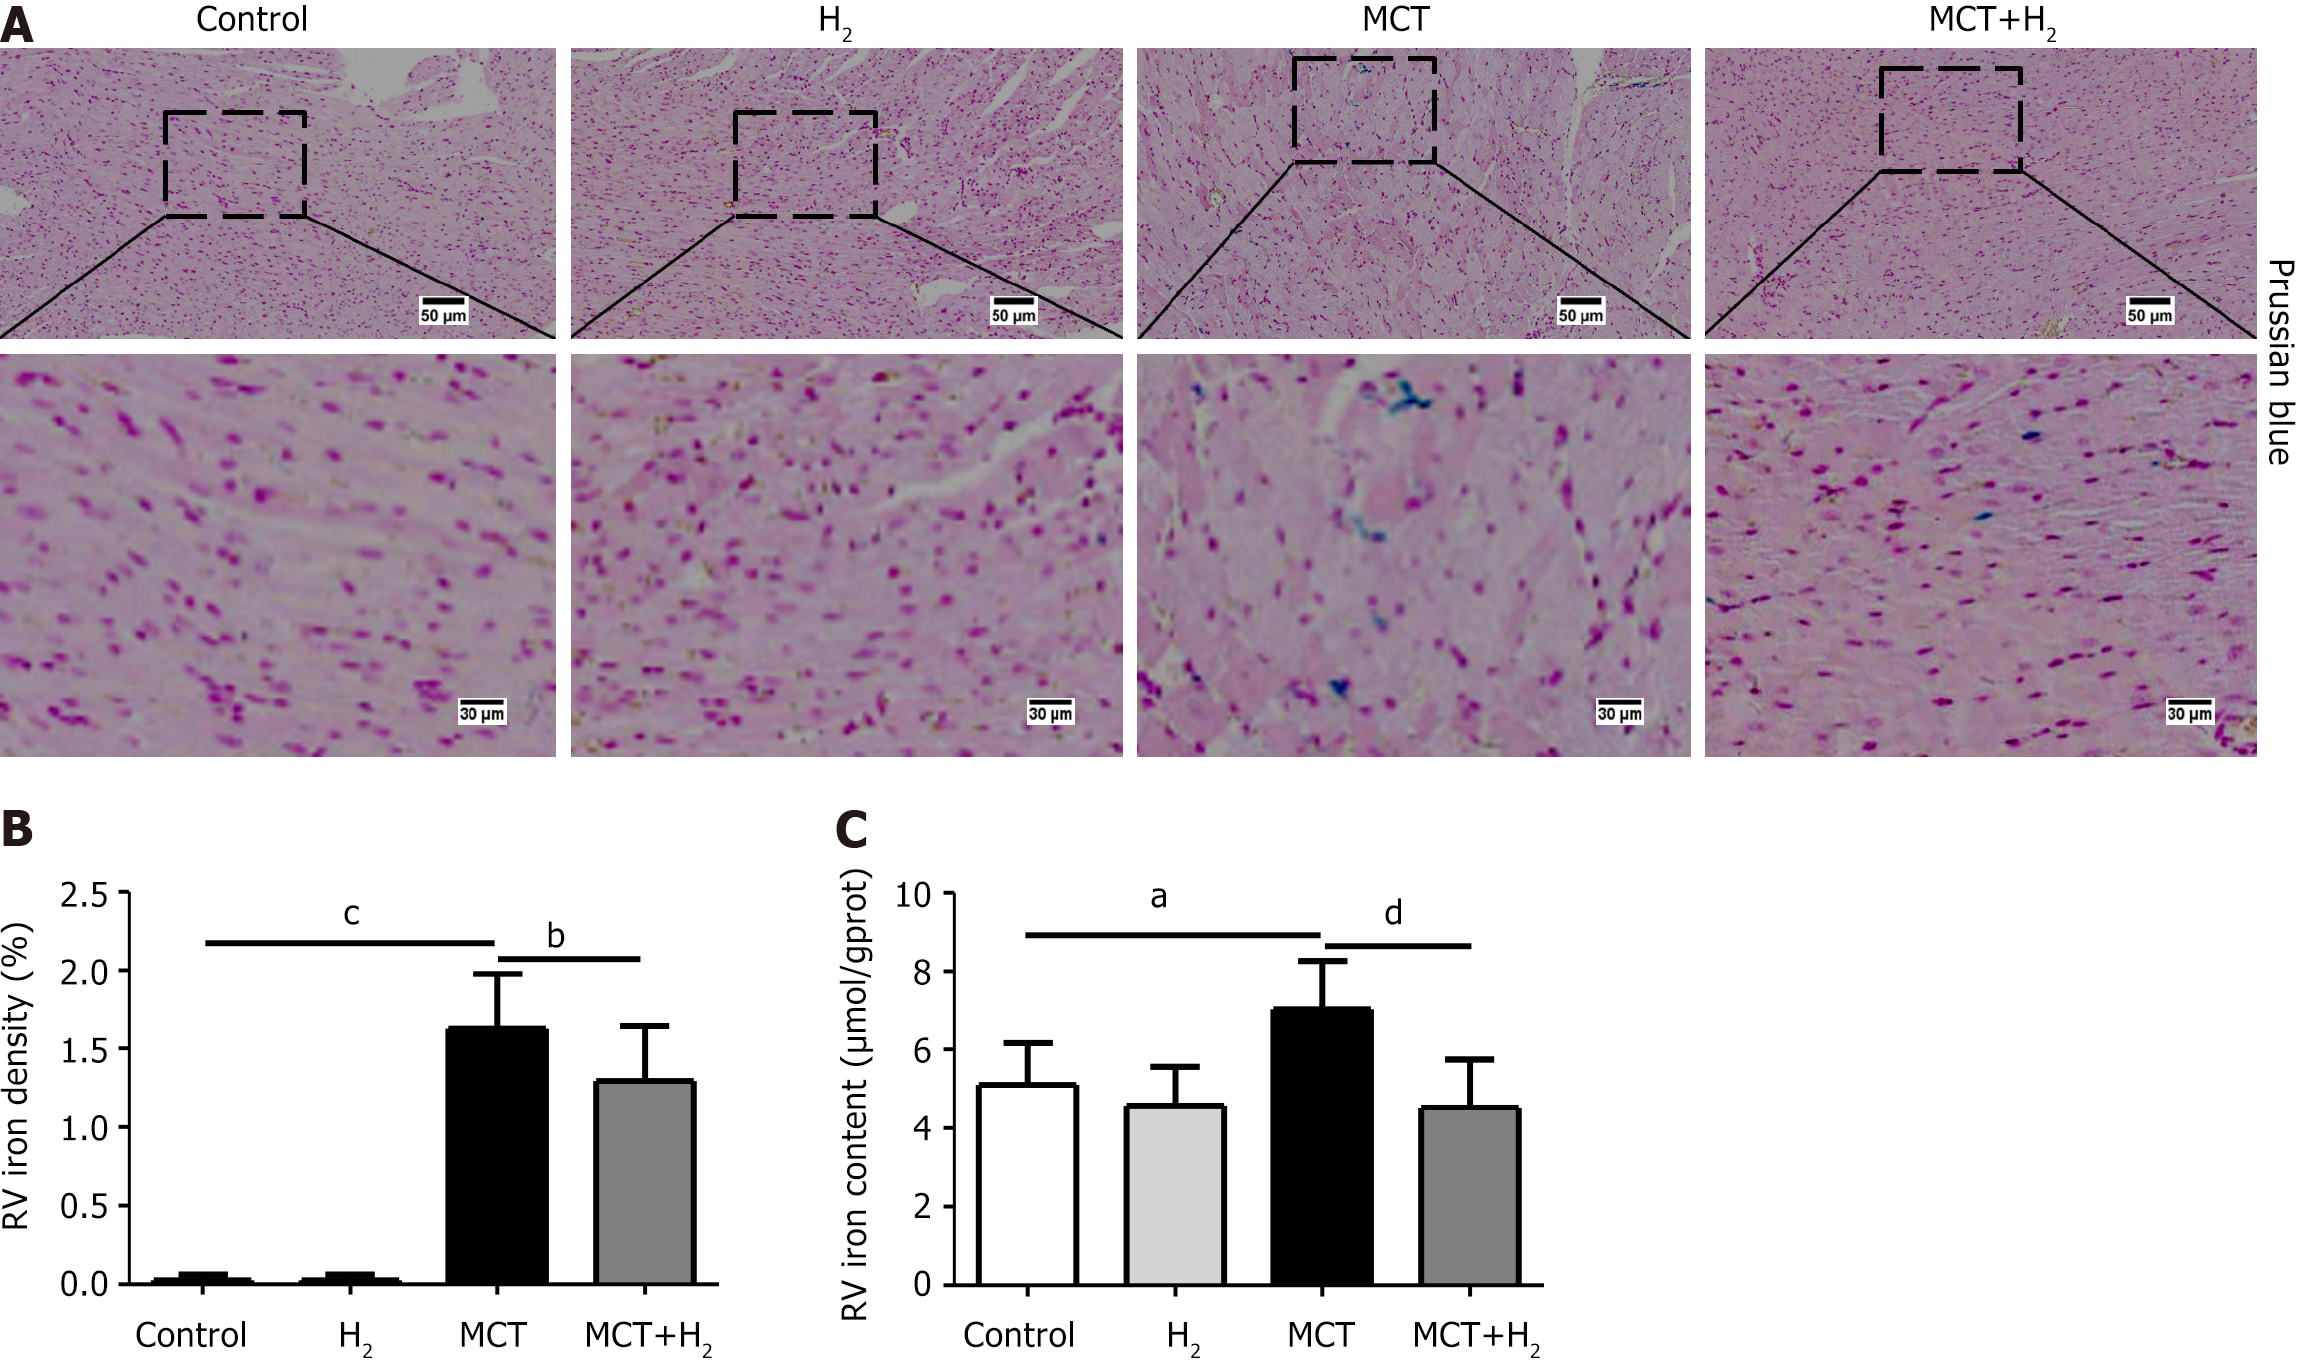
Figure 4 Hydrogen inhalation alleviated iron afumulation in monocrotaline-treated rats.
A: Representative images of Prussian blue staining. Magnification is 20 ×. Scale bar = 50 µm; B: Quantification of Prussian blue iron staining; n = 4; C: Right ventricular Fe content; n = 6. Data are expressed as the mean ± SD. aP < 0.05 and cP < 0.01: MCT group vs control group; bP < 0.05 and dP < 0.01: MCT+ H2 group vs MCT group. MCT: Monocrotaline; H2: Hydrogen.
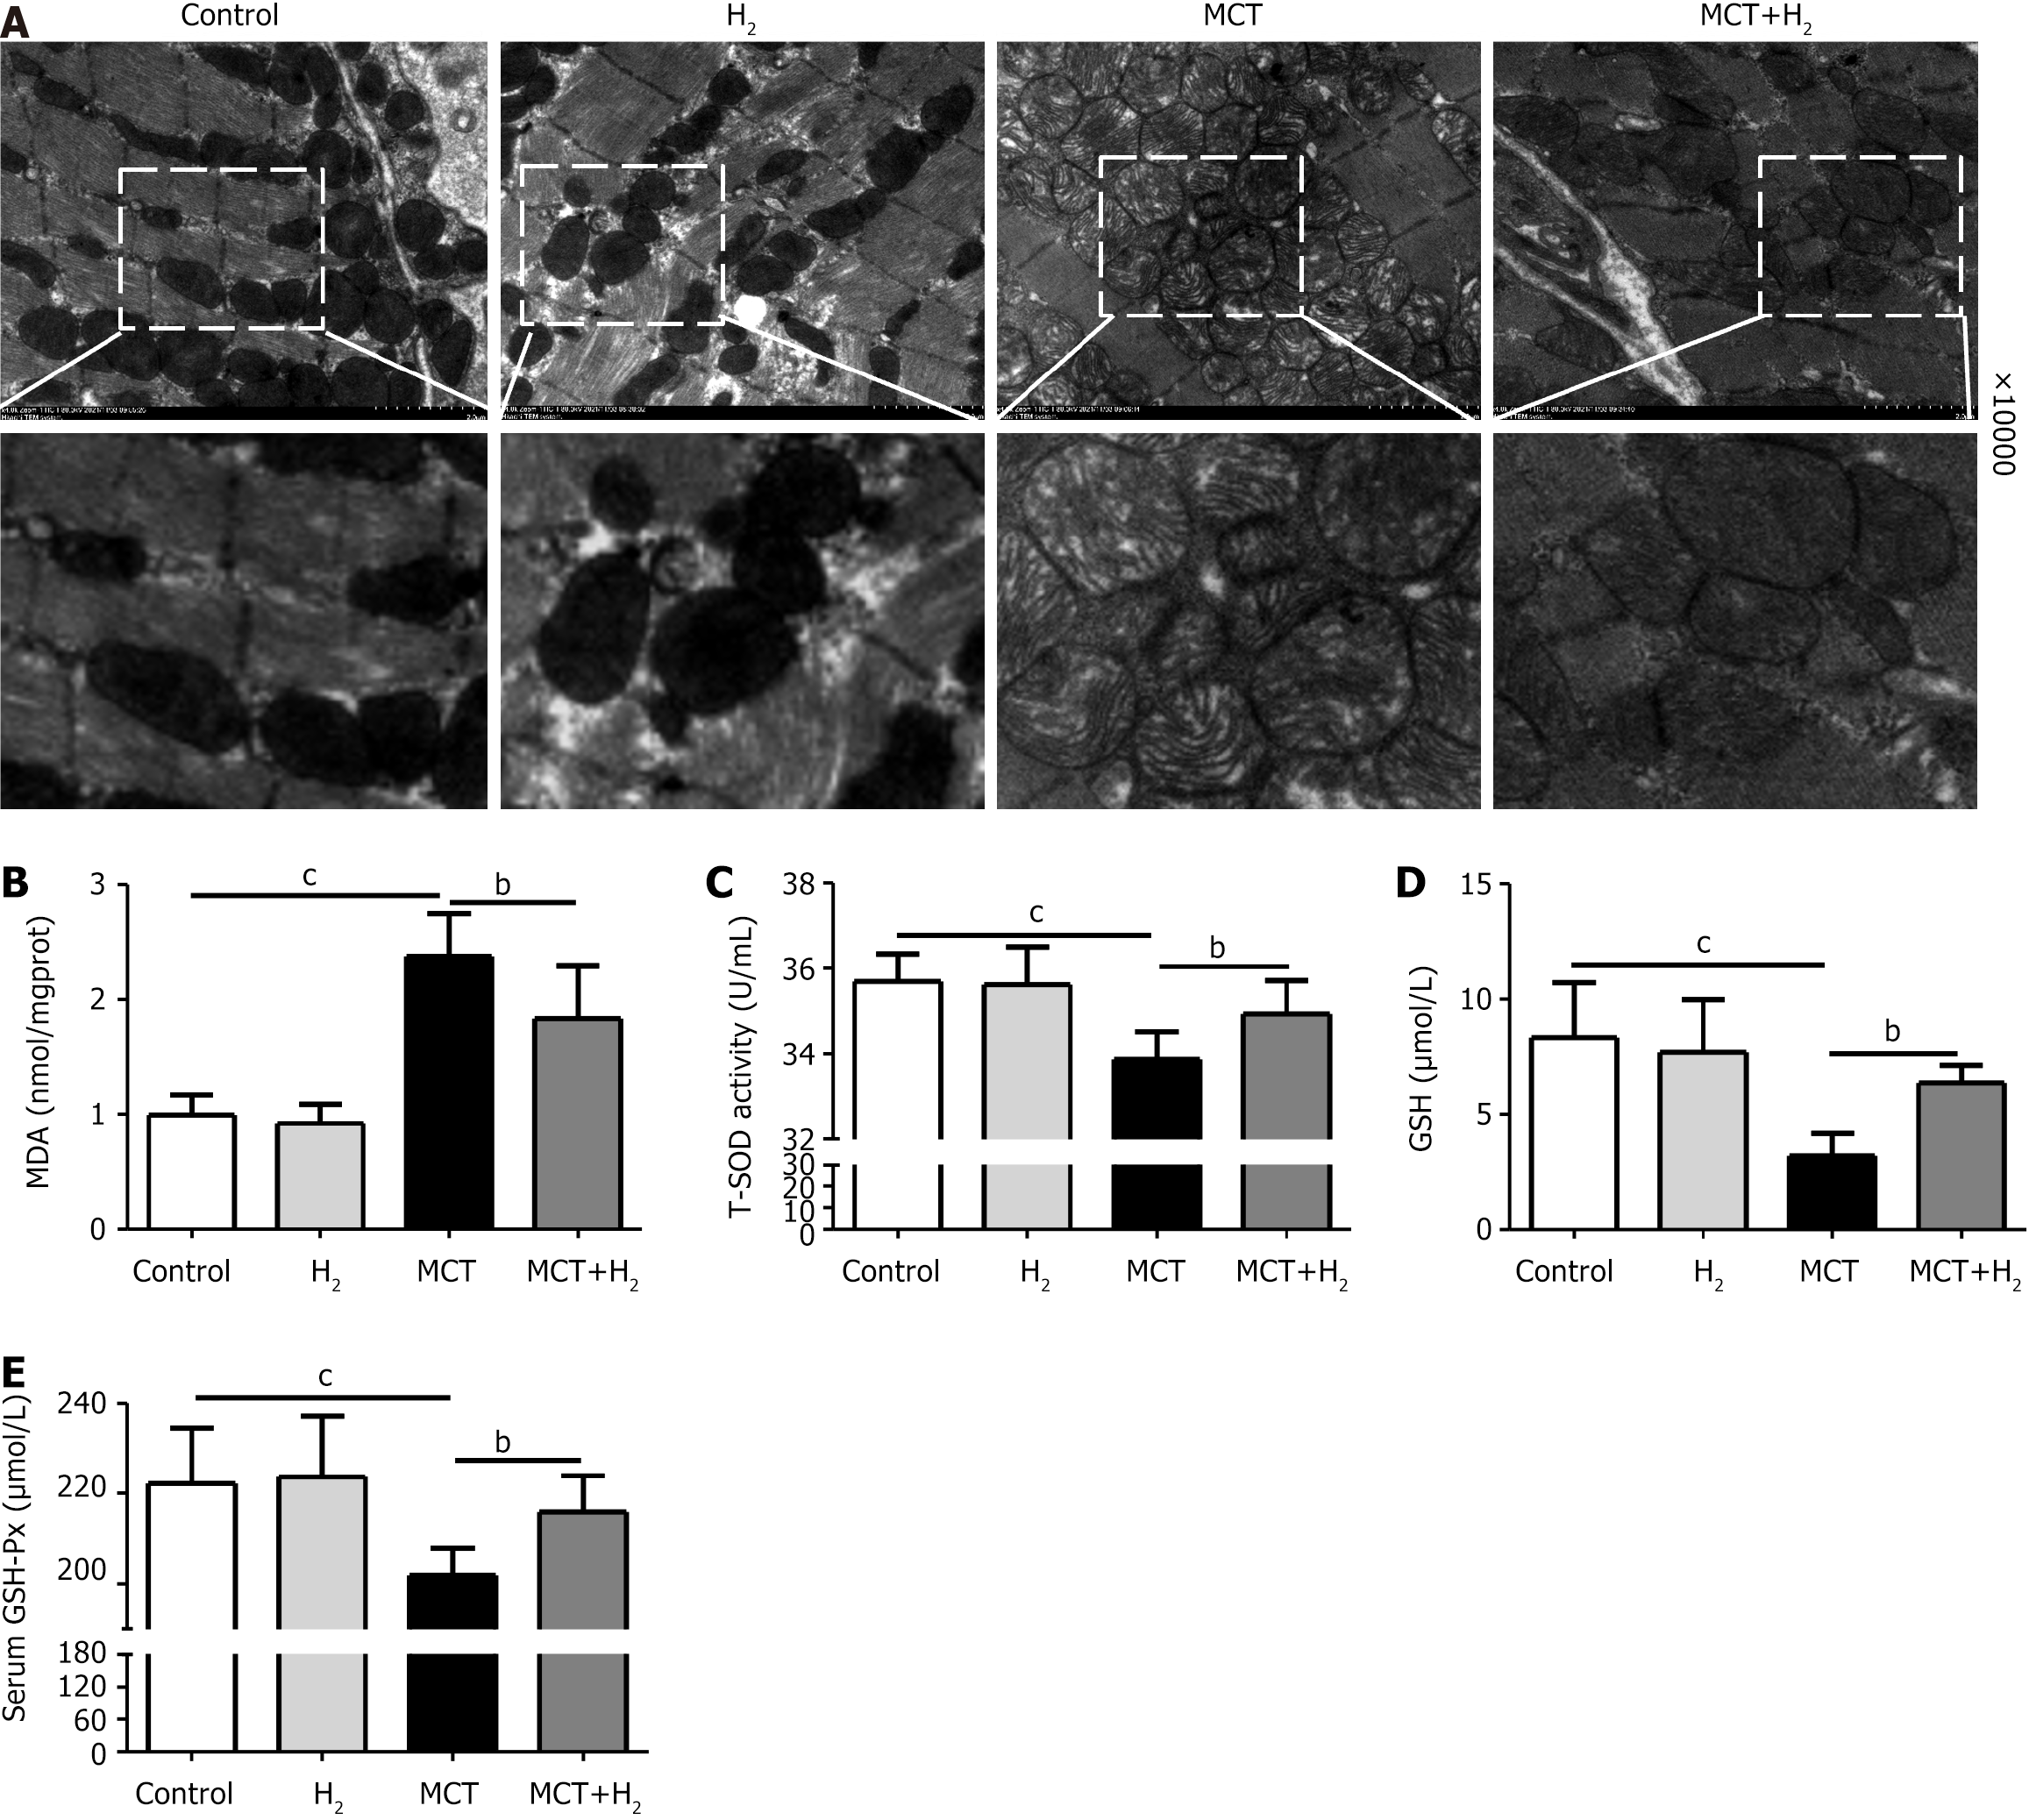
Figure 5 Hydrogen inhalation suppressed oxidative stress in monocrotaline-treated rats.
A: Representative TEM images of mitochondrial morphology. The magnification is 10000 ×. Scale bar = 2 µm; B: Malonaldehyde content in right ventricular tissue; n = 6; C: Total superoxide dismutase activity in the serum; n = 10; D: Serum glutathione levels; n = 6; E: GSH-Px activity in the serum; n = 10. Data are expressed as the mean ± SD. bP < 0.05: MCT+H2 group vs MCT group; cP < 0.01: MCT group vs control group. MCT: Monocrotaline; H2: Hydrogen; MDA: Malonaldehyde; T-SOD: Total superoxide dismutase; GSH: Glutathione.
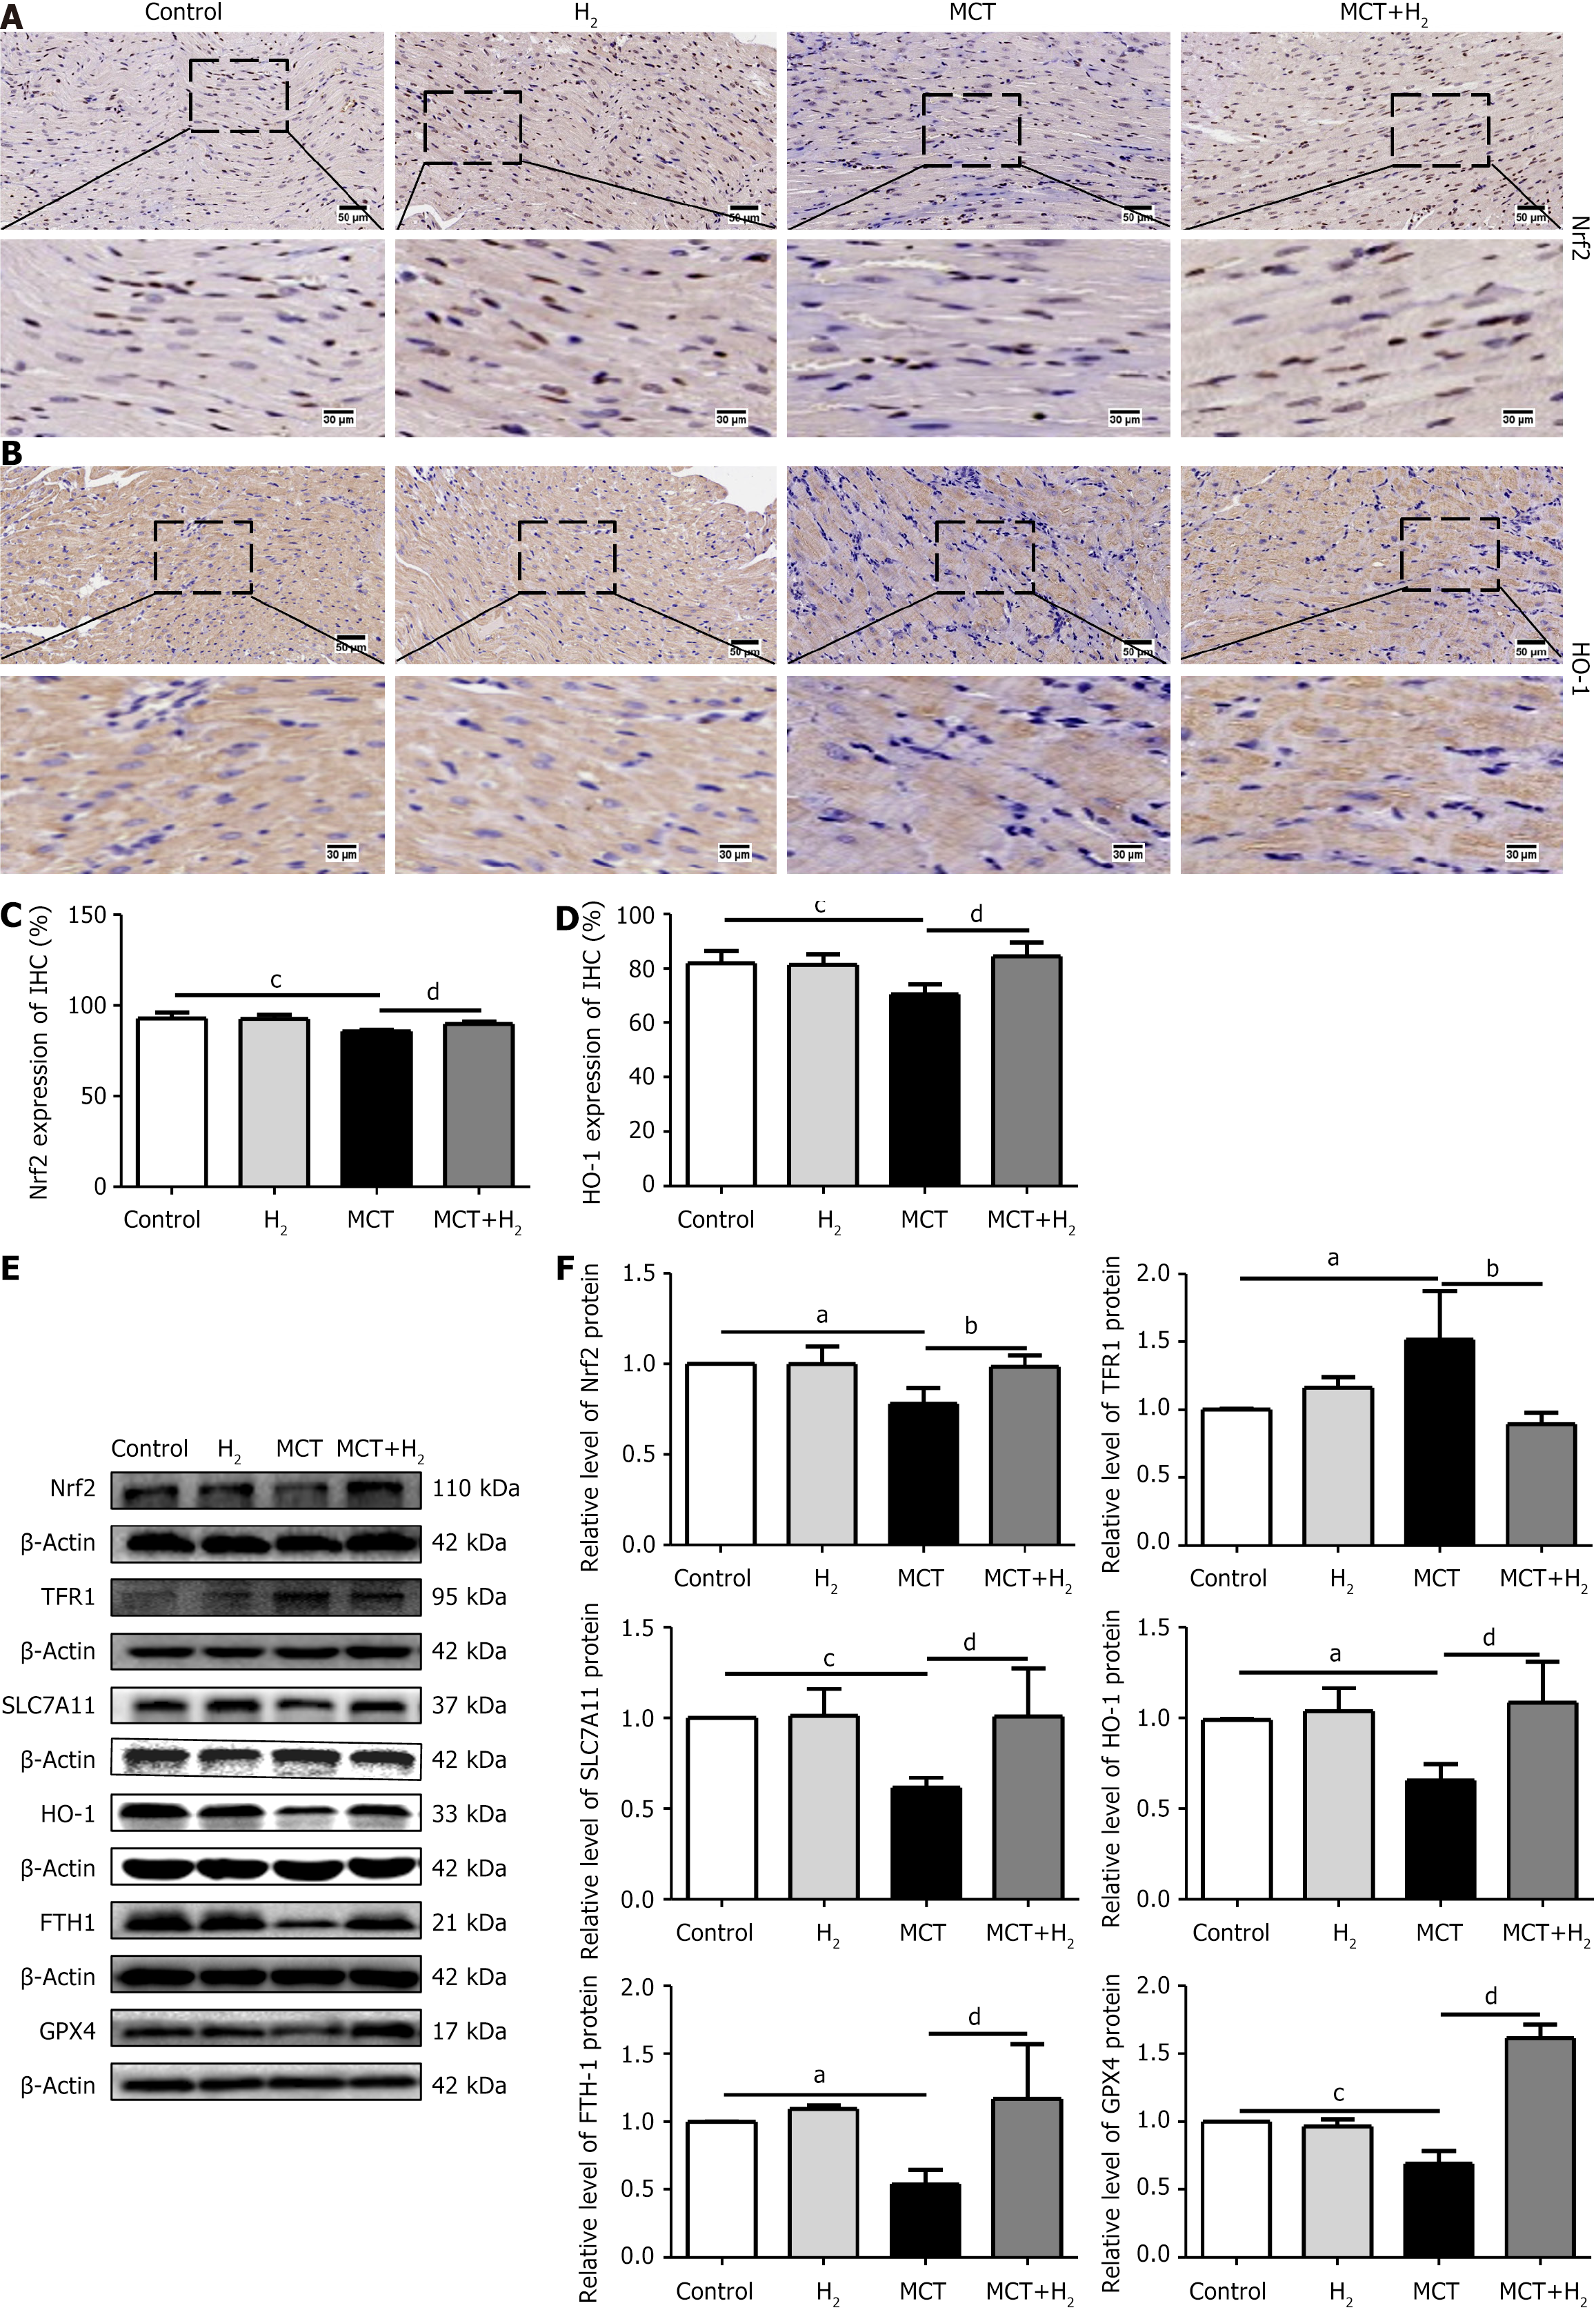
Figure 6 Hydrogen inhalation alleviated ferroptosis by restoring the Nrf2/HO-1 pathway in monocrotaline-treated rats.
A: Representative images of immunohistochemistry (IHC) staining of Nrf2. Nrf2-positive cell nuclei are stained brown. Magnification is 20 ×. Scale bar = 50 µm; B: Representative images of IHC staining of HO-1. HO-1-positive area is stained brown. Magnification is 20 ×. Scale bar = 50 µm; C: Quantitative analysis of IHC staining of Nrf2; n = 4; D: Quantitative analysis of IHC staining of HO-1; n = 4; E: Representative western blotting of Nrf2, TFR1, SLC7A11, HO-1, FTH1 and GPX4 proteins; F: Relative levels of Nrf2, TFR1, SLC7A11, HO-1, FTH1, and GPX4 proteins. Data are expressed as the mean ± SD; n ≥ 3. aP < 0.05 and cP < 0.01: MCT group vs control group; bP < 0.05 and dP < 0.01: MCT+H2 group vs MCT group. MCT: Monocrotaline; H2: Hydrogen.
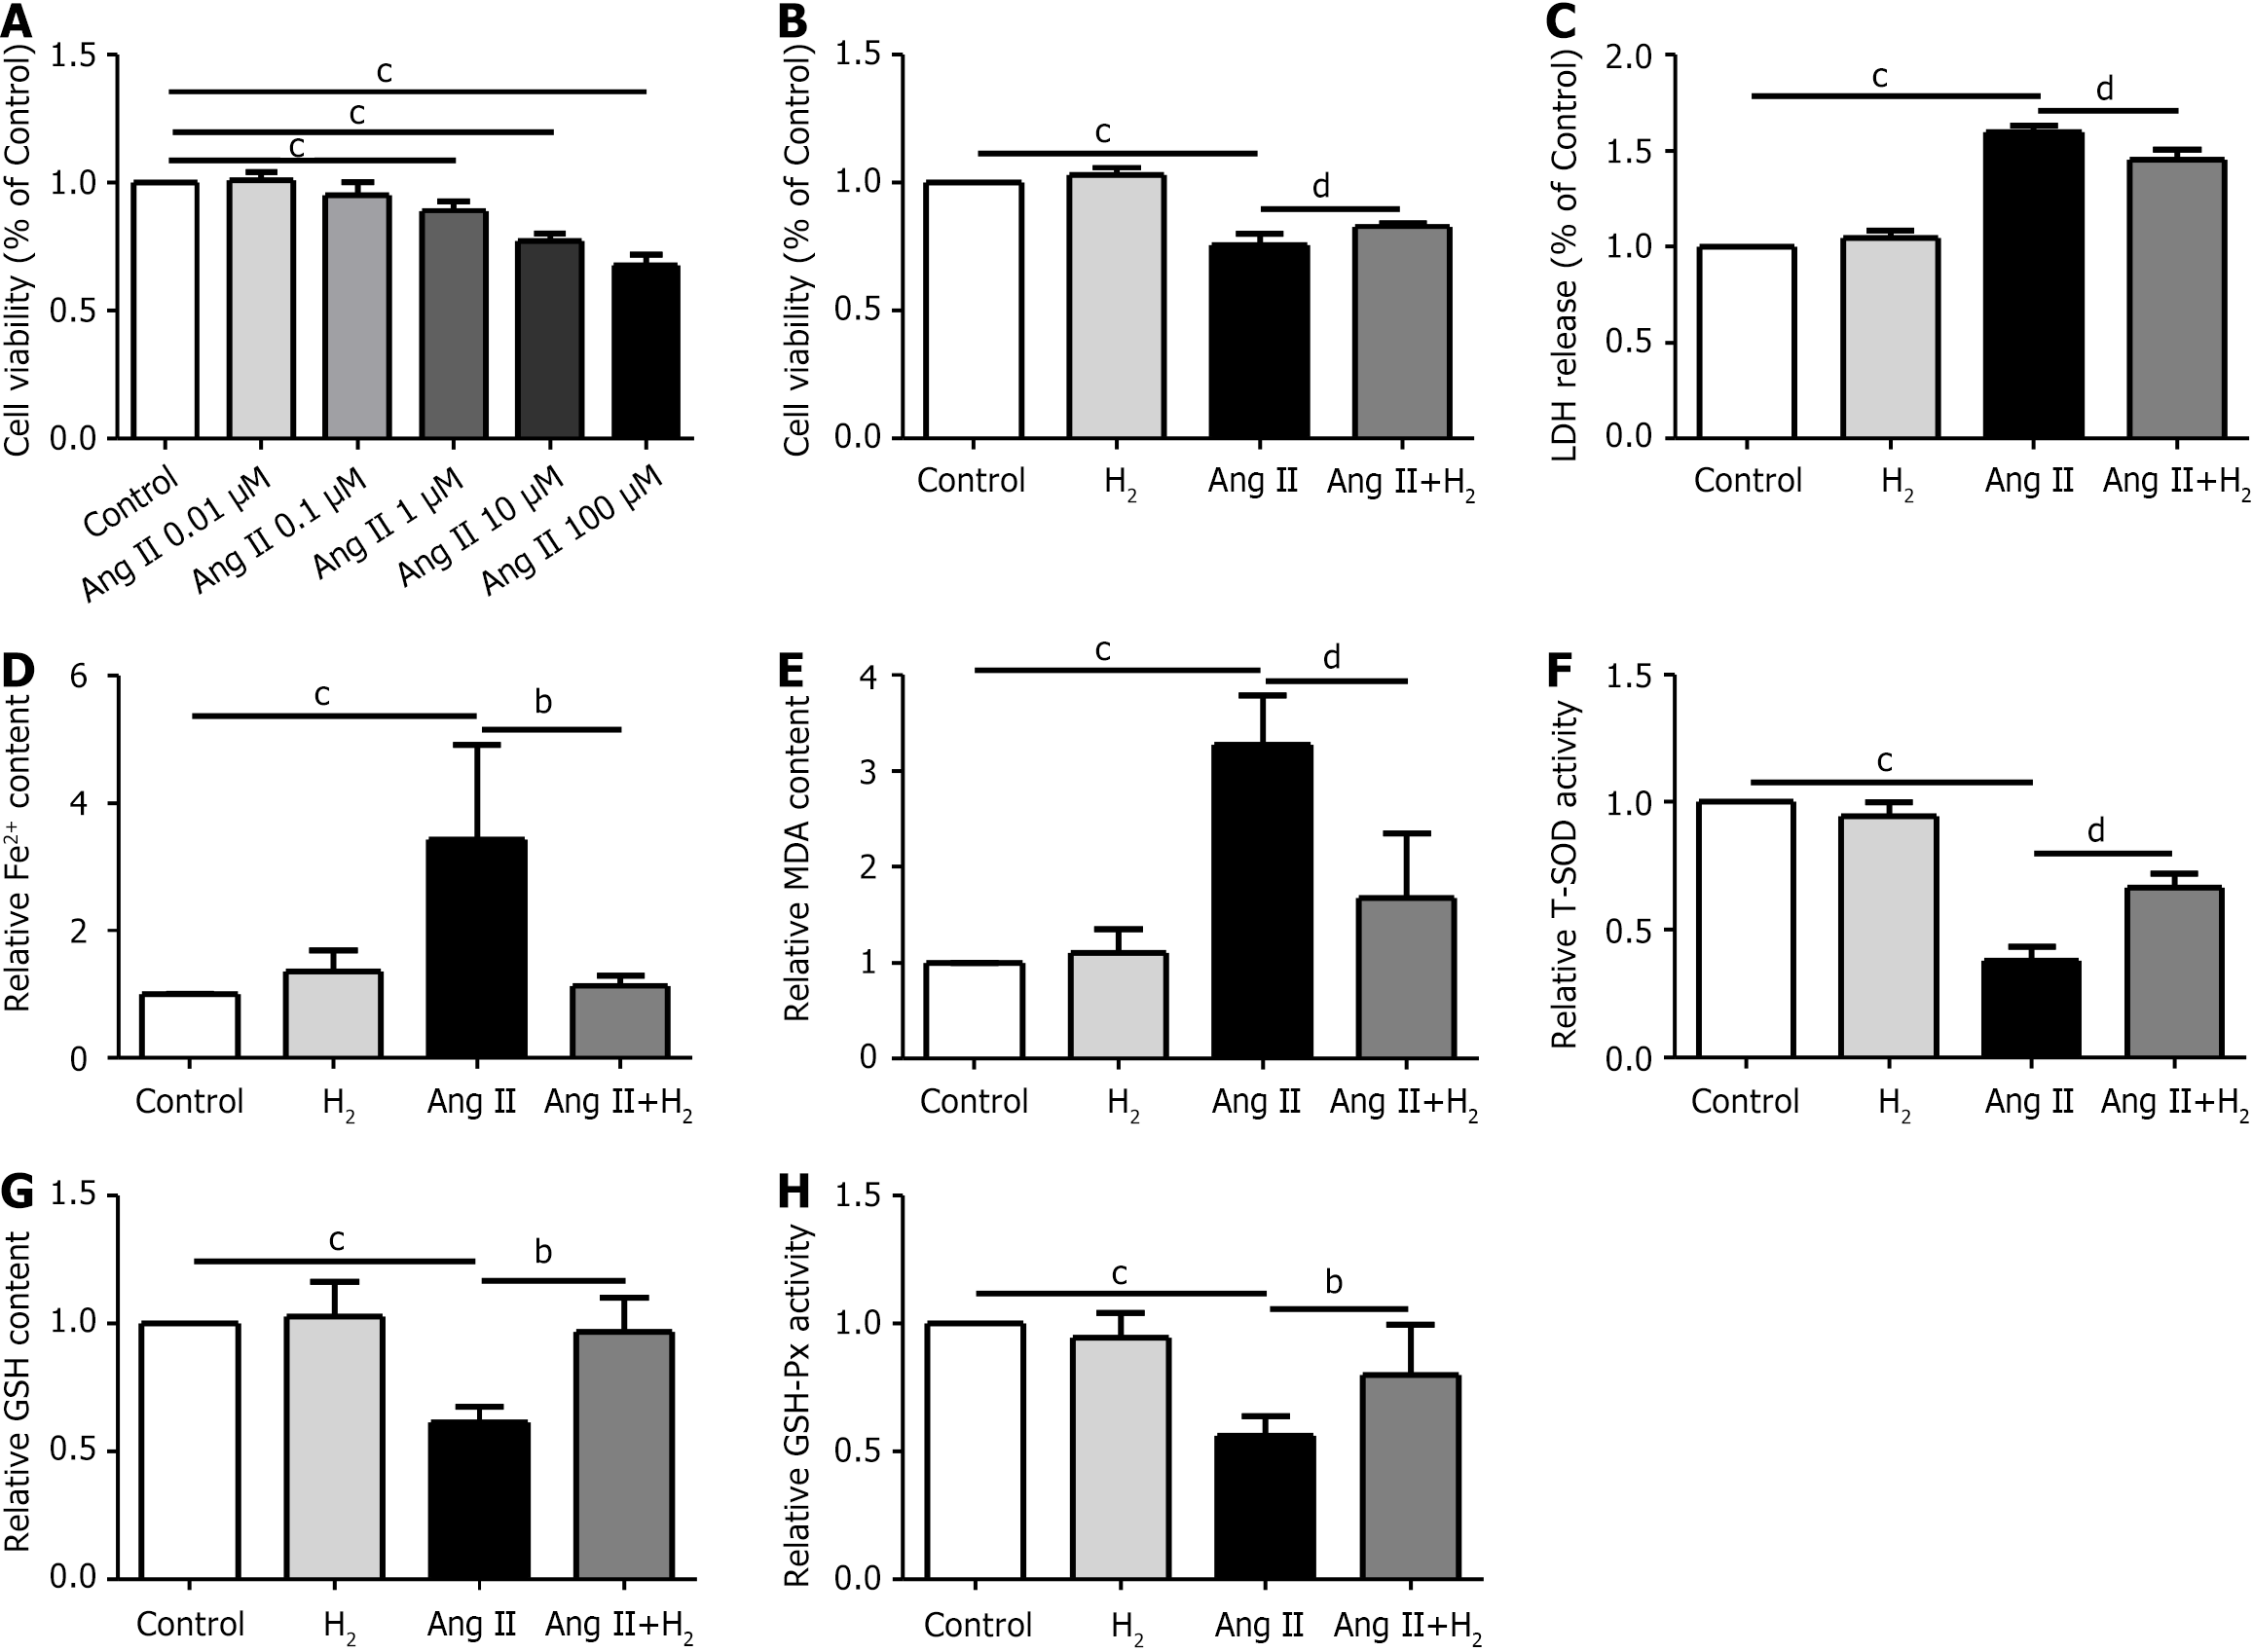
Figure 7 Hydrogen alleviates Fe2+ content and oxidative stress in an angiotensin II-treated H9C2 cells.
A: Cell viability with different An angiotensin II concentrations (0, 0.01, 0.1, 1, 10, and 100 μmol/L) relative to the control; B: Relative cell viability in each group; C: Relative lactate dehydrogenase release in each group; D: Relative Fe2+ content in each group, n = 4; E: Relative malonaldehyde content in each group; n = 4; F: Relative total superoxide dismutase activity in each group; n = 4; G: Relative glutathione content of each group; n = 4; H: Relative GSH-Px activity in each group; n = 4. Data are expressed as the mean ± SD. cP < 0.01: Ang II group vs control group; bP < 0.05 and dP < 0.01: Ang II+H2 group vs Ang II group. MCT: Monocrotaline; H2: Hydrogen; MDA: Malonaldehyde; LDH: lactate dehydrogenase; T-SOD: total superoxide dismutase; Ang II: An angiotensin II.
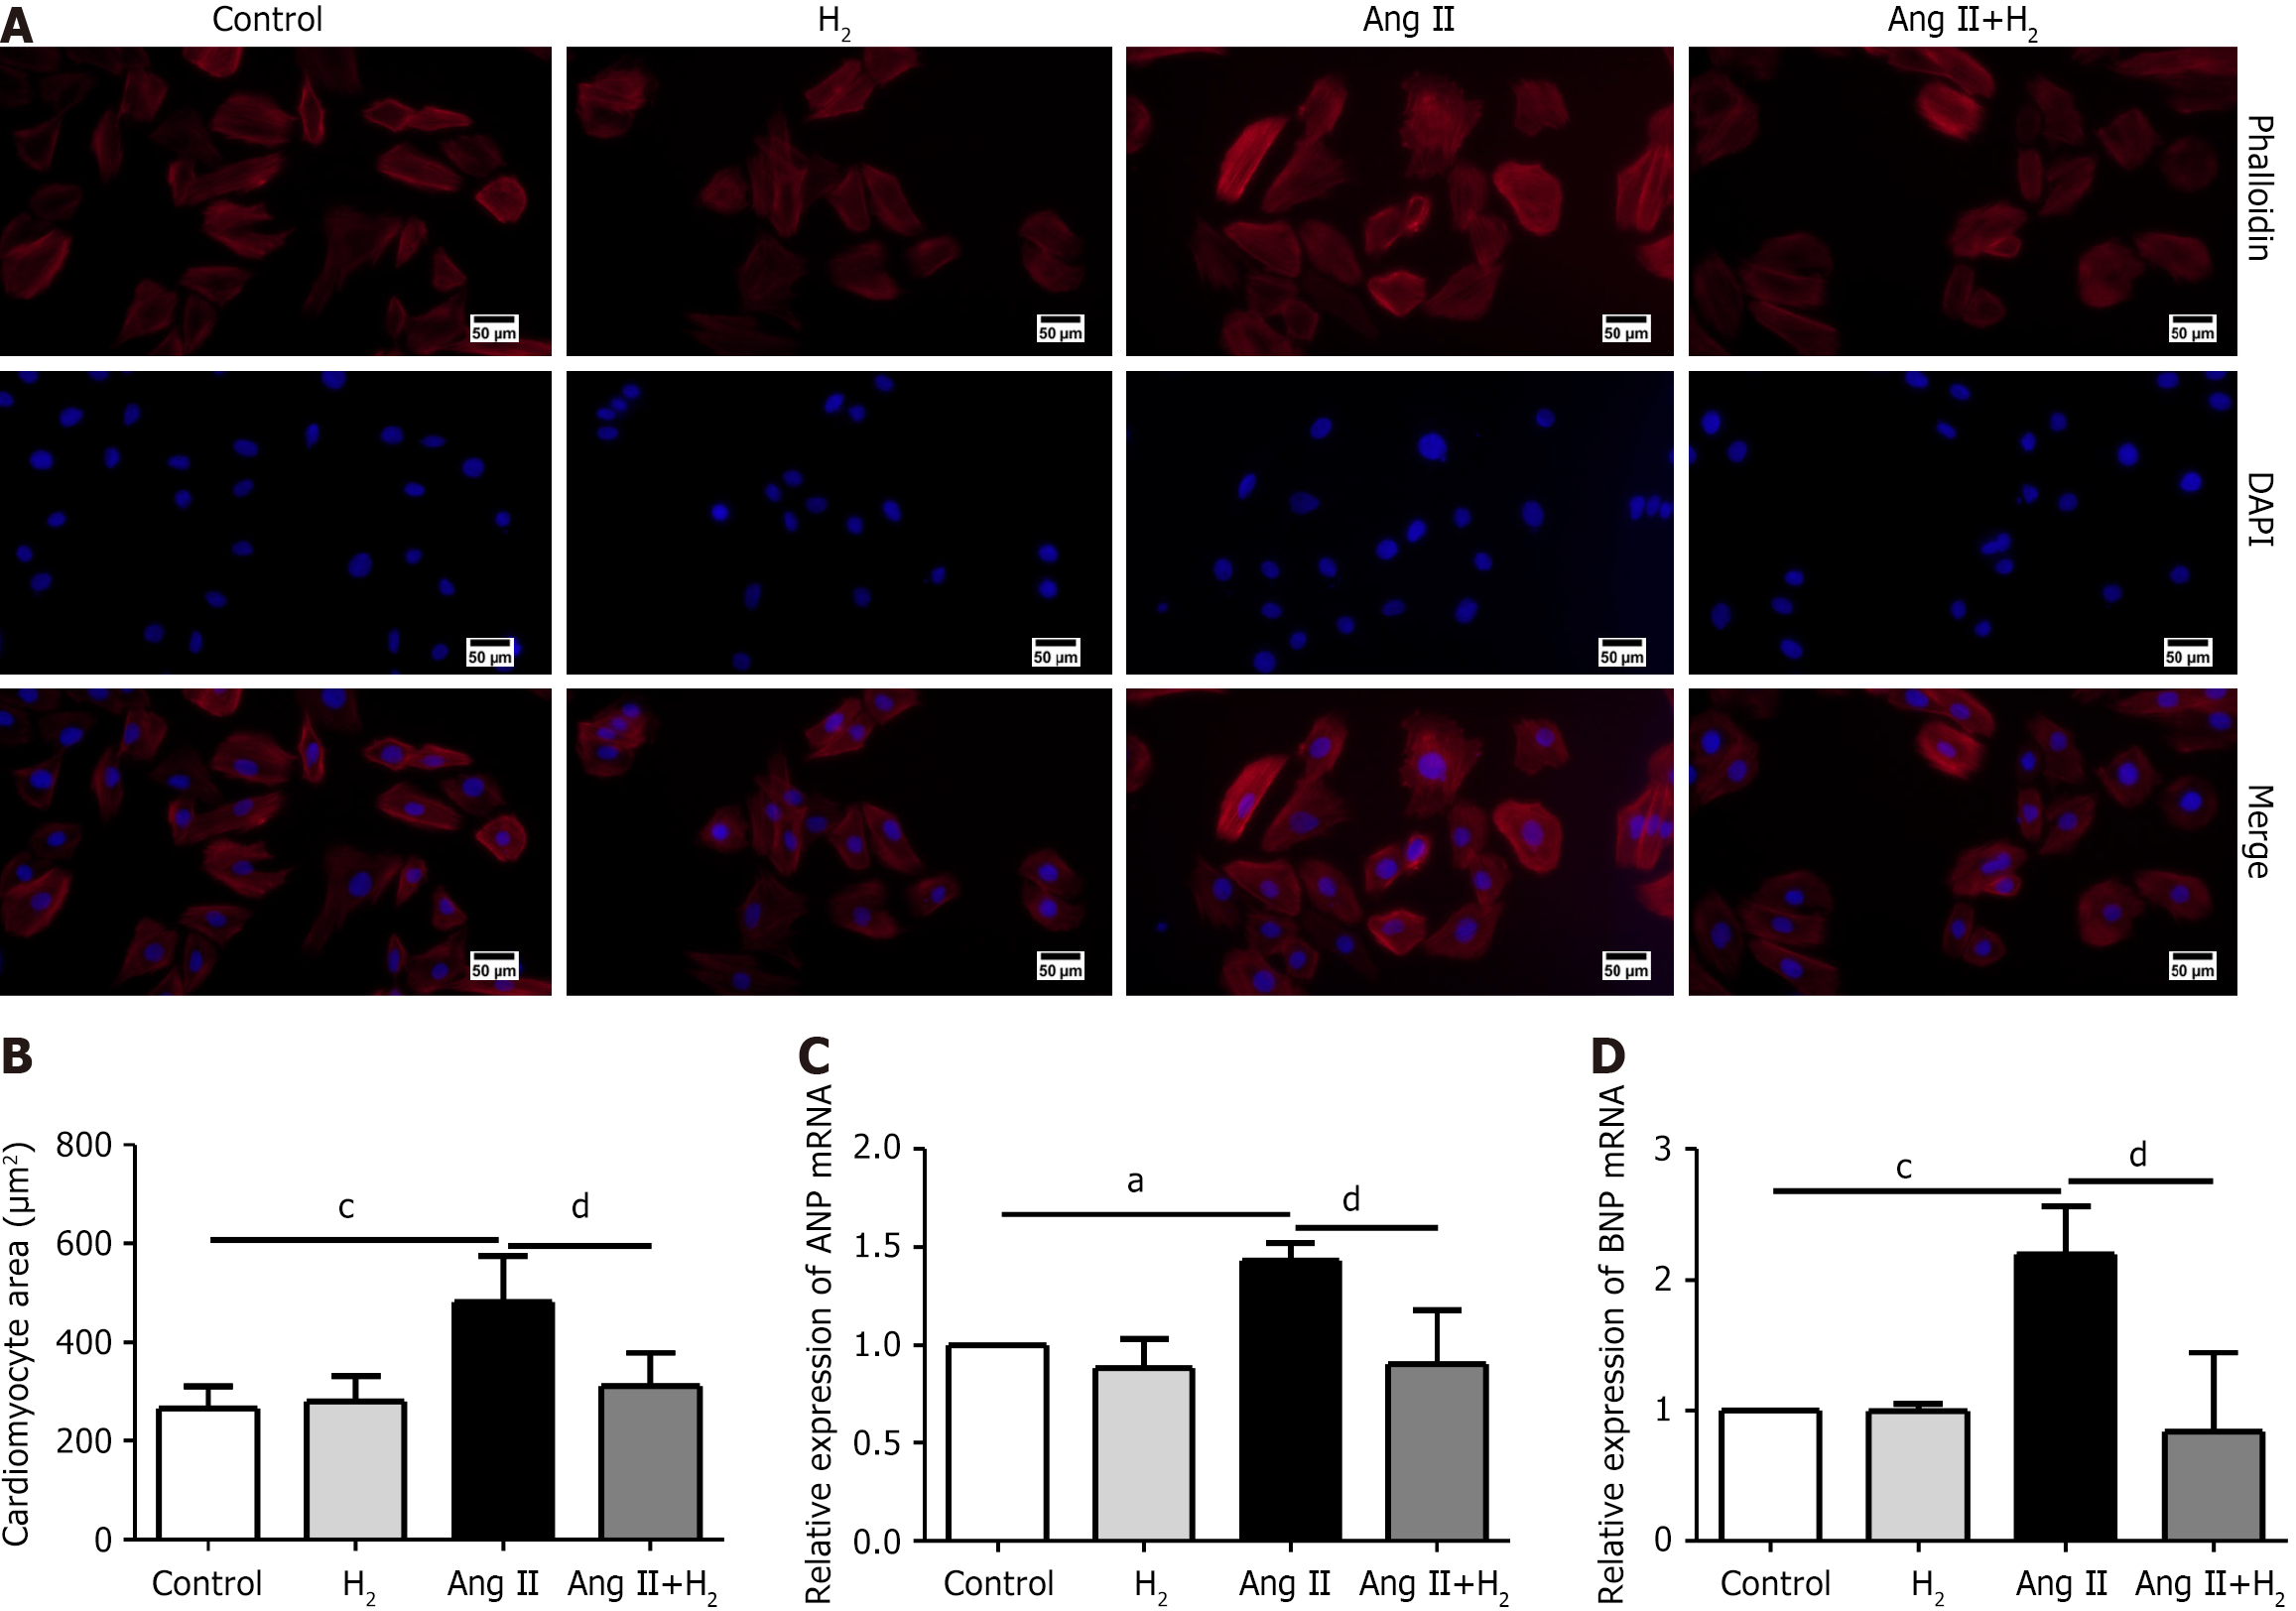
Figure 8 Hydrogen inhibited an angiotensin II-induced cardiomyocyte hypertrophy in H9C2 cells.
A: Representative images of phalloidin staining in H9C2 cells from different groups. Phalloidin and DAPI staining images were merged. Magnification is 20 ×. Scale bar = 50 µm; B: Surface area of H9C2 cells in different groups; n = 4; C: Relative expression levels of ANP mRNA in each group; n = 3; D: Relative BNP mRNA expression in each group; n = 3. Data are expressed as the mean ± SD. aP < 0.01 and cP < 0.01: Ang II group vs control group; dP < 0.01: Ang II+H2 group vs Ang II group. MCT: Monocrotaline; H2: Hydrogen; Ang II: An angiotensin II; ANP: Antinatriuretic peptide A; BNP: Brain natriuretic peptide.
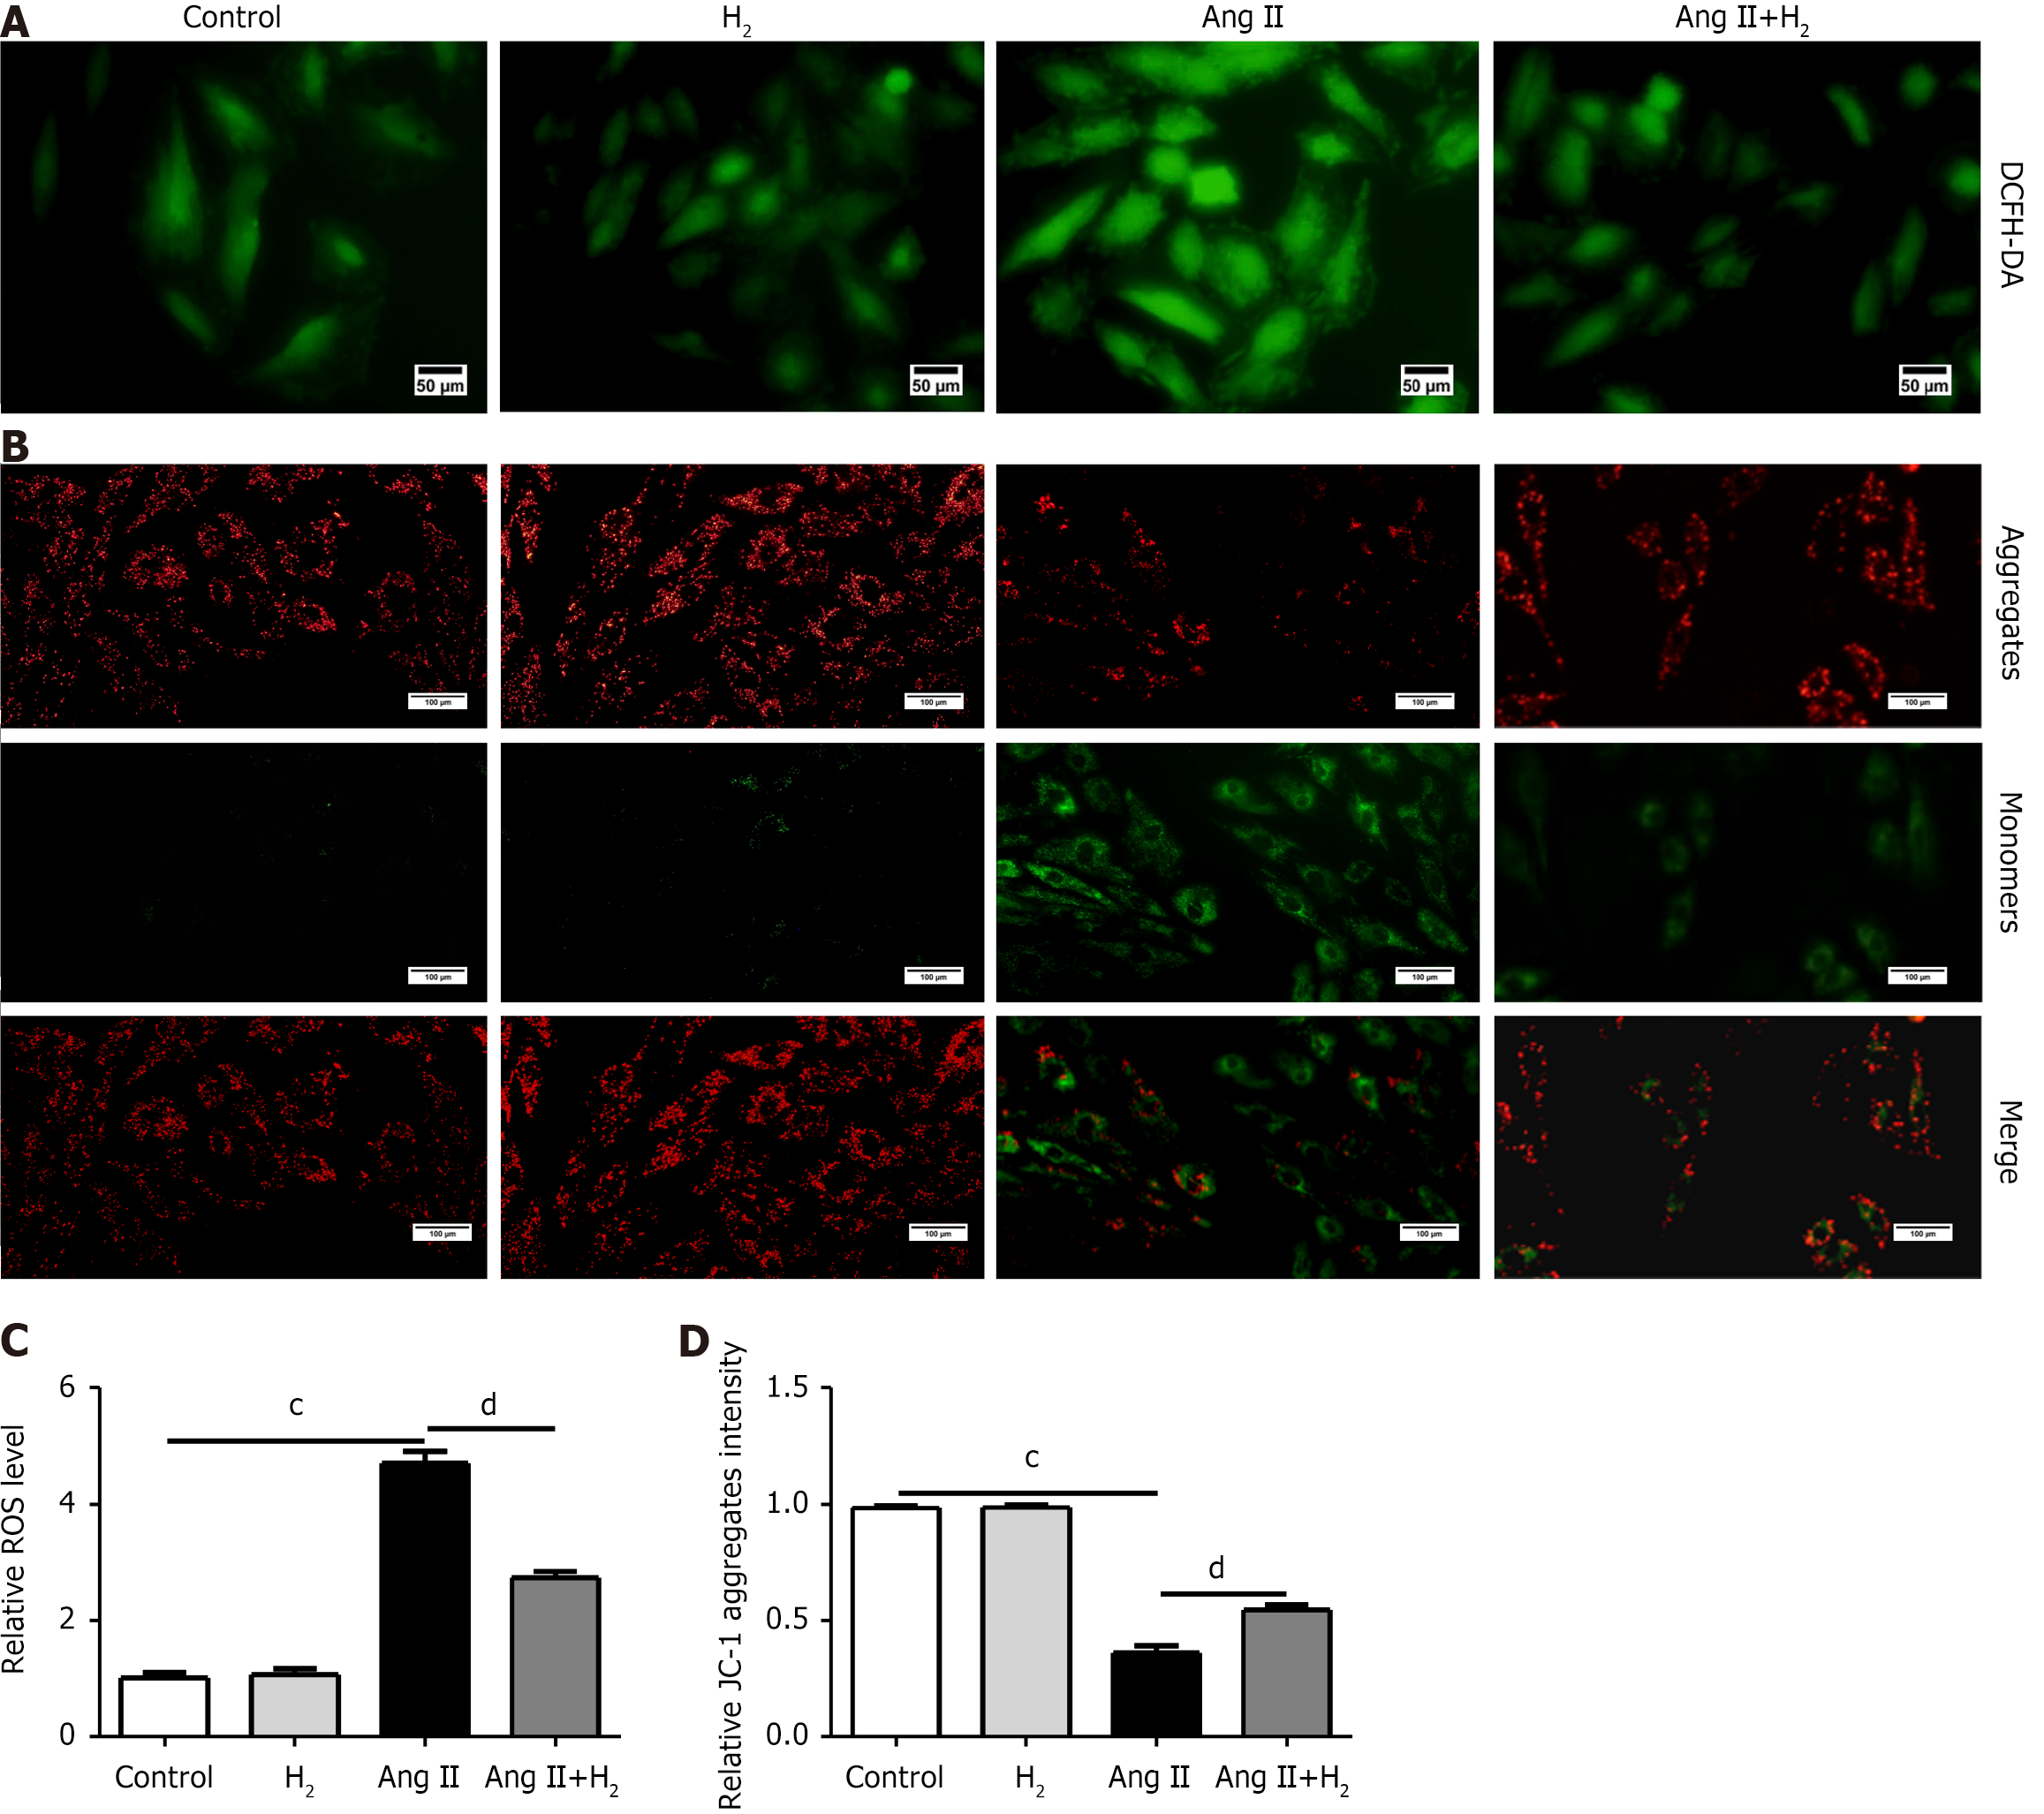
Figure 9 Hydrogen ameliorated oxidative stress and suppresses reactive oxygen species overproduction in H9C2 cells.
A: Representative images of the DCFH-DA staining. Magnification is 20 ×. Scale bar = 50 µm; B: Representative images of JC-1 staining. Magnification is 10 ×. Scale bar = 100 µm; C: Relative reactive oxygen species levels in each group; n = 4; D: Relative JC-1 aggregate intensity in each group; n = 4. Data are expressed as the mean ± SD. cP < 0.01: Ang II group vs control group; dP < 0.01: Ang II+H2 group vs Ang II group. MCT: Monocrotaline; H2: Hydrogen; Ang II: An angiotensin II; ROS: Reactive oxygen species.
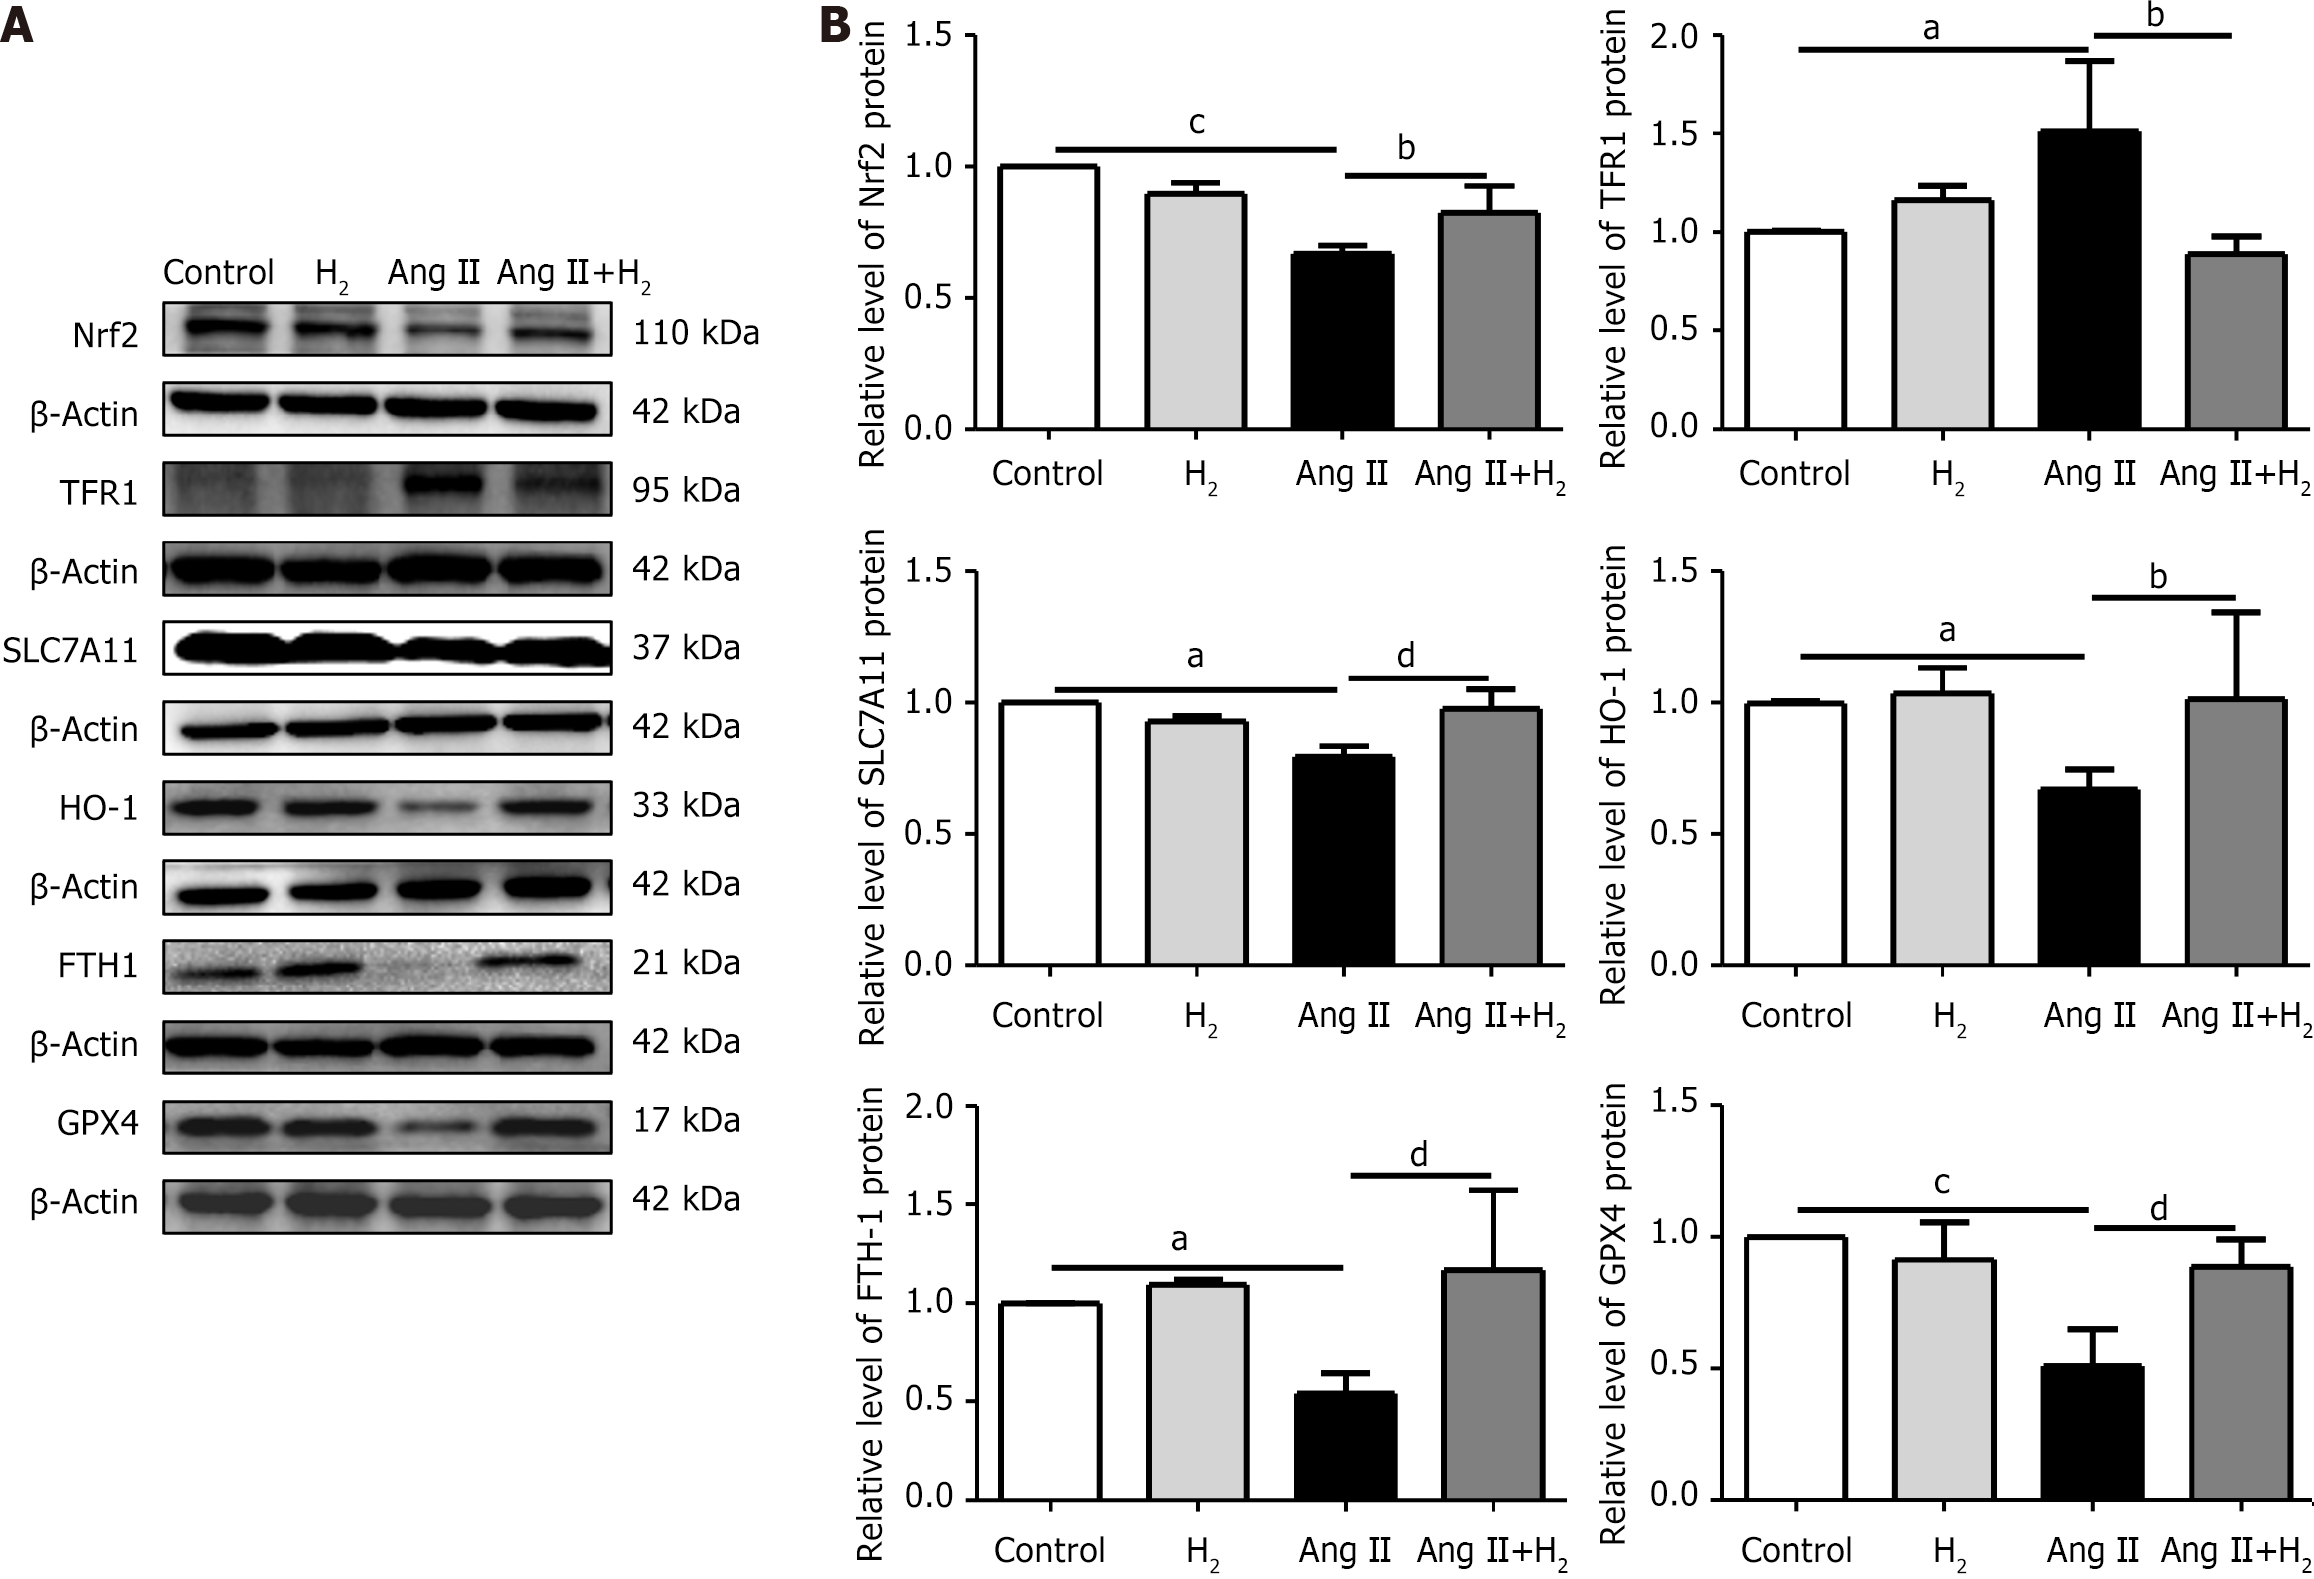
Figure 10 Hydrogen alleviates ferroptosis by inhibiting the Nrf2/HO-1 pathway in an angiotensin II-treated H9C2 cells.
A: Representative western blotting of Nrf2, TFR1, SLC7A11, HO-1, FTH1, and GPX4 proteins; B: Relative protein levels of Nrf2, TFR1, SLC7A11, HO-1, FTH1, and GPX4. Data are expressed as the mean ± SD; n ≥ 3. aP < 0.05 and cP < 0.01: Ang II group vs control group; bP < 0.05 and dP < 0.01: Ang II+H2 group vs Ang II group. MCT: Monocrotaline; H2: Hydrogen; Ang II: An angiotensin II.
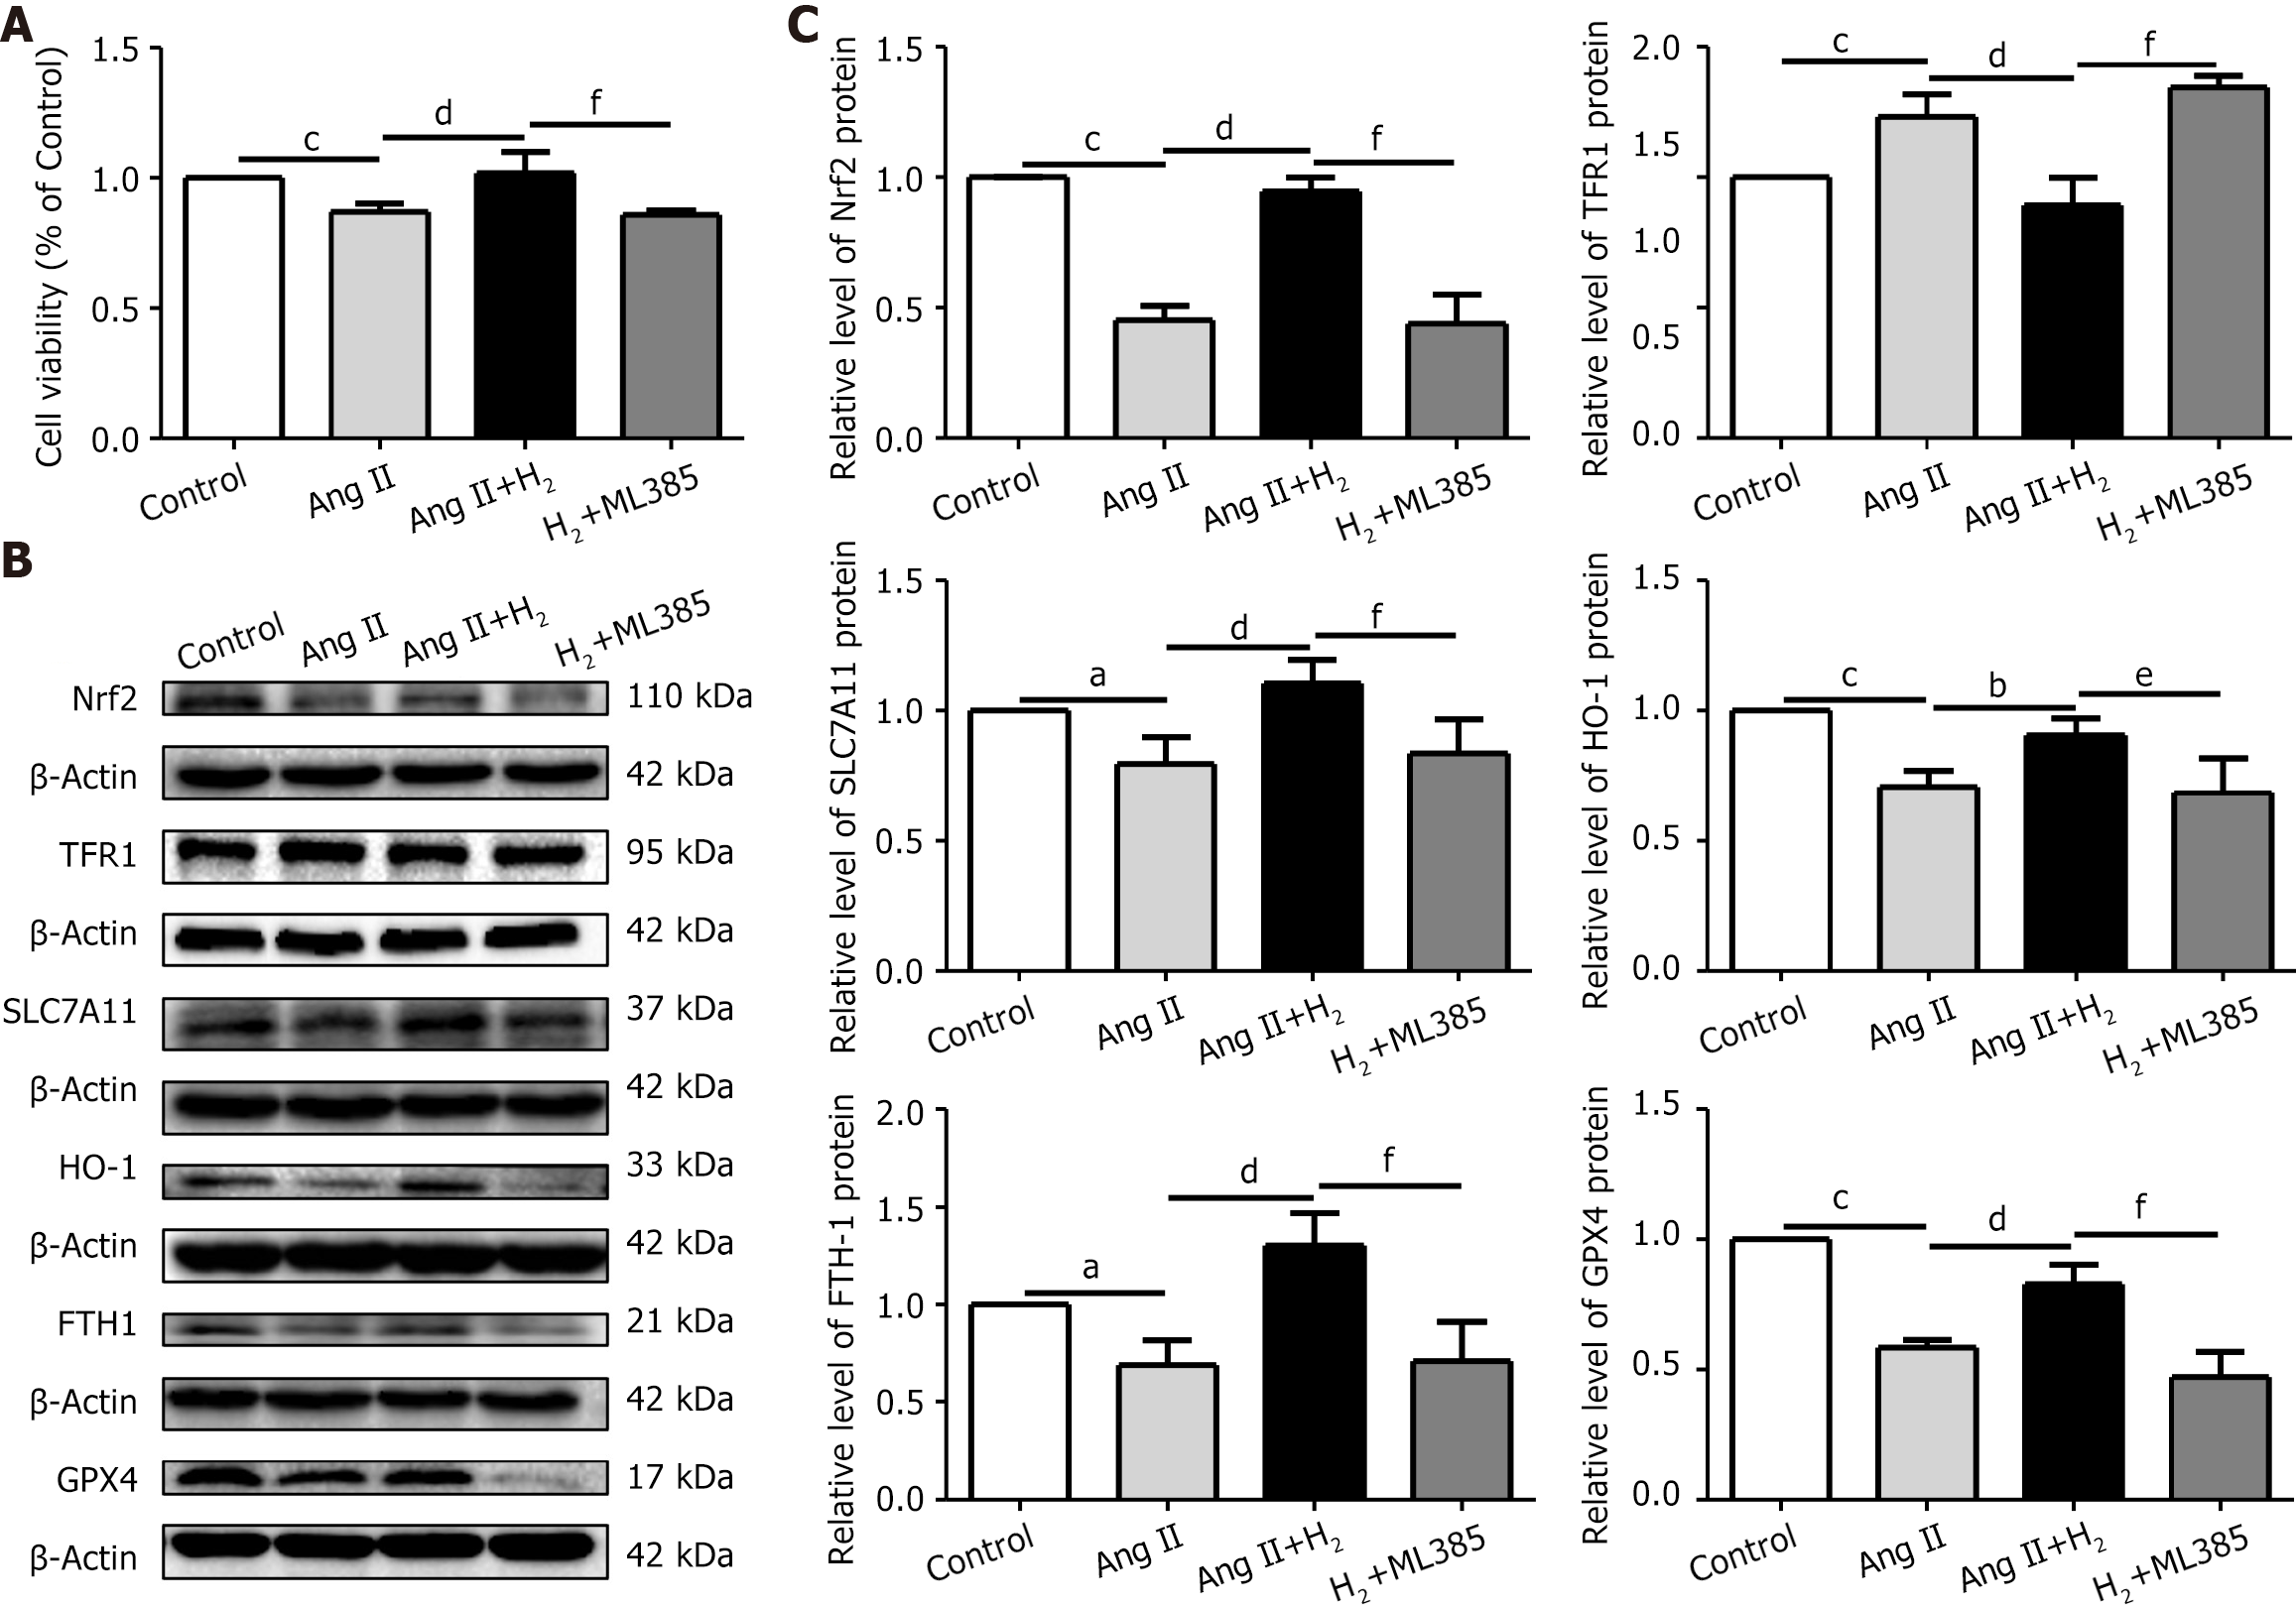
Figure 11 The Nrf2 inhibitor ML385 (1 μmol/L) inhibited restoration of the Nrf2/HO-1 signaling pathway in an angiotensin II-treated H9C2 cells after Hydrogen treatment.
A: Cell viability in each group; B: Representative western blotting of Nrf2, TFR1, SLC7A11, HO-1, FTH1, and GPX4 proteins; C: Relative levels of Nrf2, TFR1, SLC7A11, HO-1, FTH1, and GPX4 proteins. Data are expressed as the mean ± SD; n ≥ 3. aP < 0.05 and cP < 0.01: Ang II group vs control group; bP < 0.05 and dP < 0.01: Ang II+H2 group vs Ang II group; eP < 0.05 and fP < 0.01: Ang II+H2+ML385 group vs Ang II+H2 group. MCT: Monocrotaline; H2: Hydrogen; Ang II: An angiotensin II.
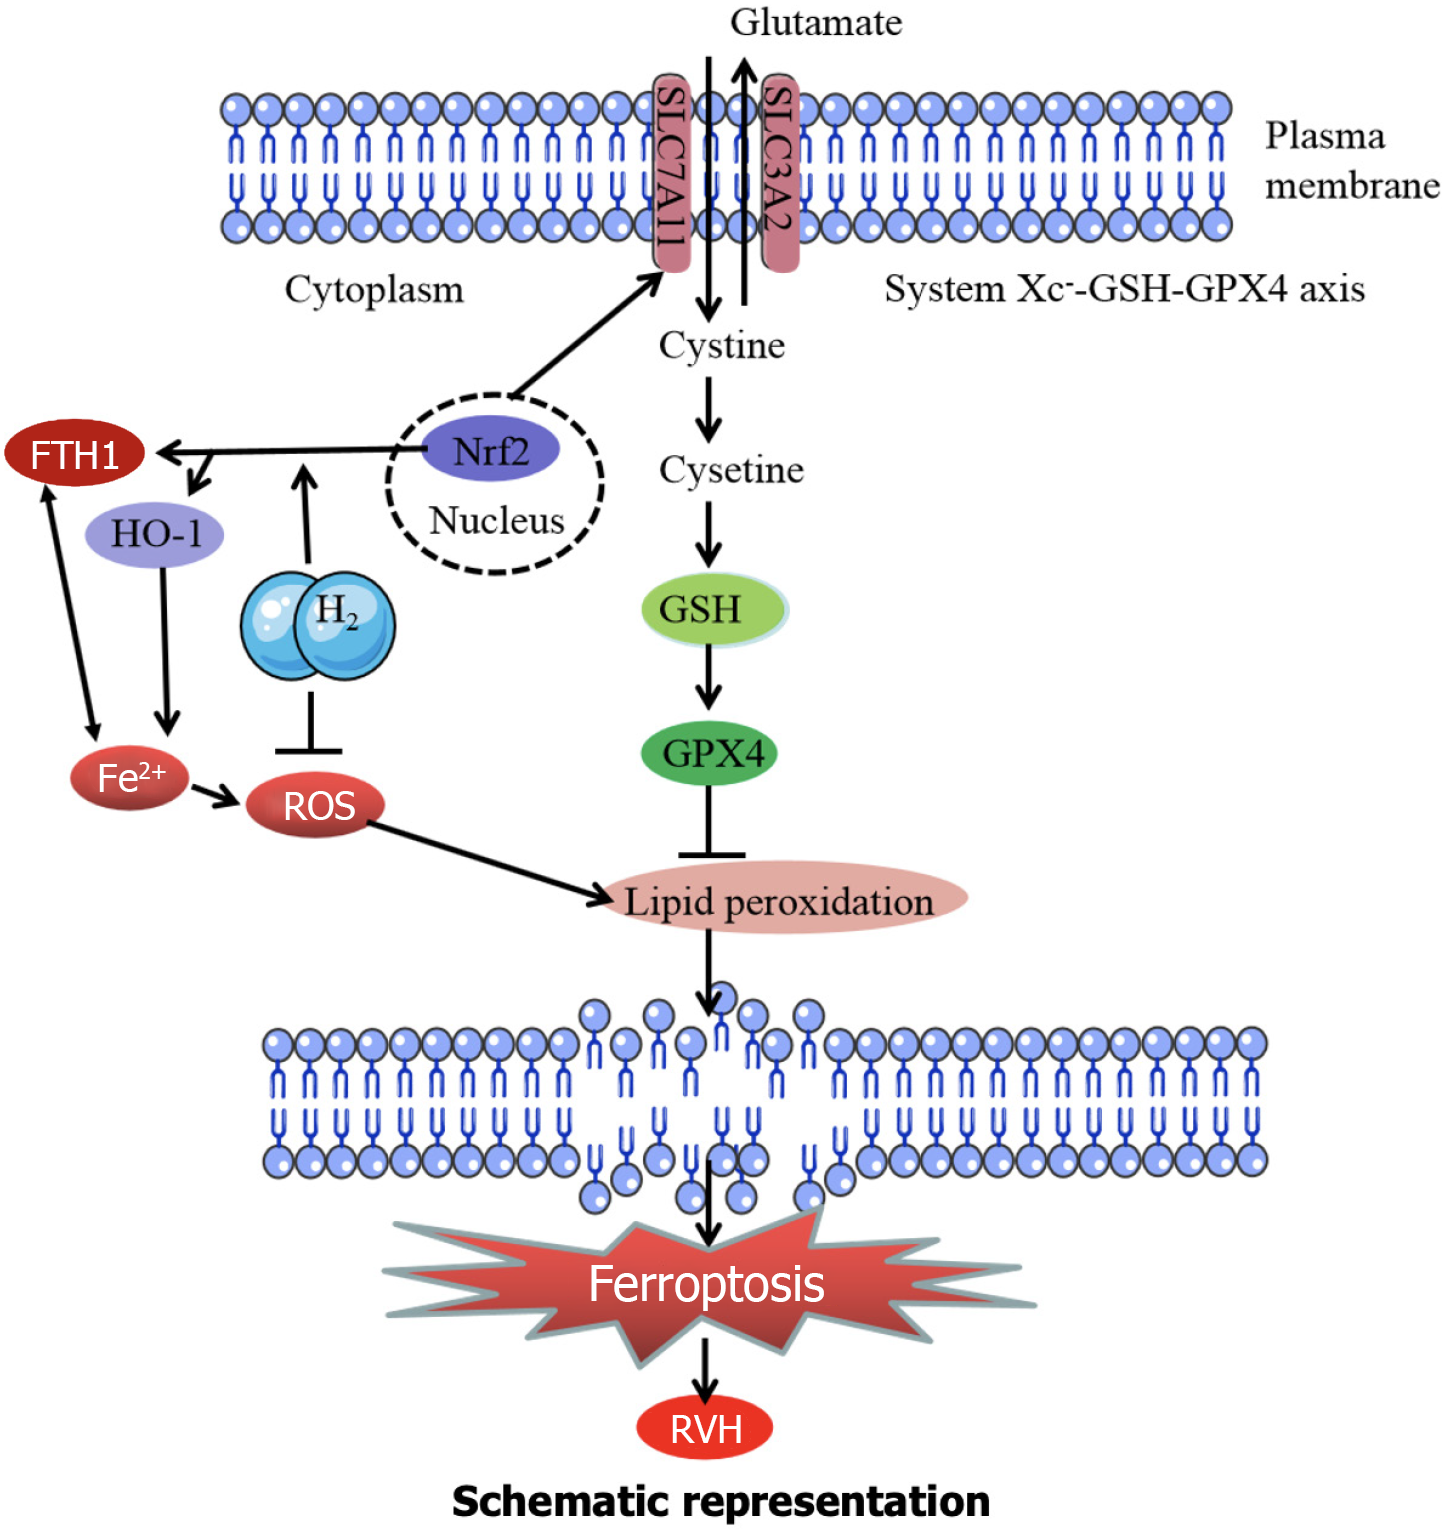
Figure 12 Graphical abstract of the mechanism by which hydrogen suppresses right ventricular hypertrophy in monocrotaline-treated rats.
- Citation: Bai JC, Yang HX, Zhan CC, Zhao LQ, Liu JR, Yang W. Hydrogen alleviates right ventricular hypertrophy by inhibiting ferroptosis via restoration of the Nrf2/HO-1 signaling pathway. World J Cardiol 2025; 17(6): 104832
- URL: https://www.wjgnet.com/1949-8462/full/v17/i6/104832.htm
- DOI: https://dx.doi.org/10.4330/wjc.v17.i6.104832


