Copyright
©The Author(s) 2025.
World J Cardiol. Jun 26, 2025; 17(6): 104832
Published online Jun 26, 2025. doi: 10.4330/wjc.v17.i6.104832
Published online Jun 26, 2025. doi: 10.4330/wjc.v17.i6.104832
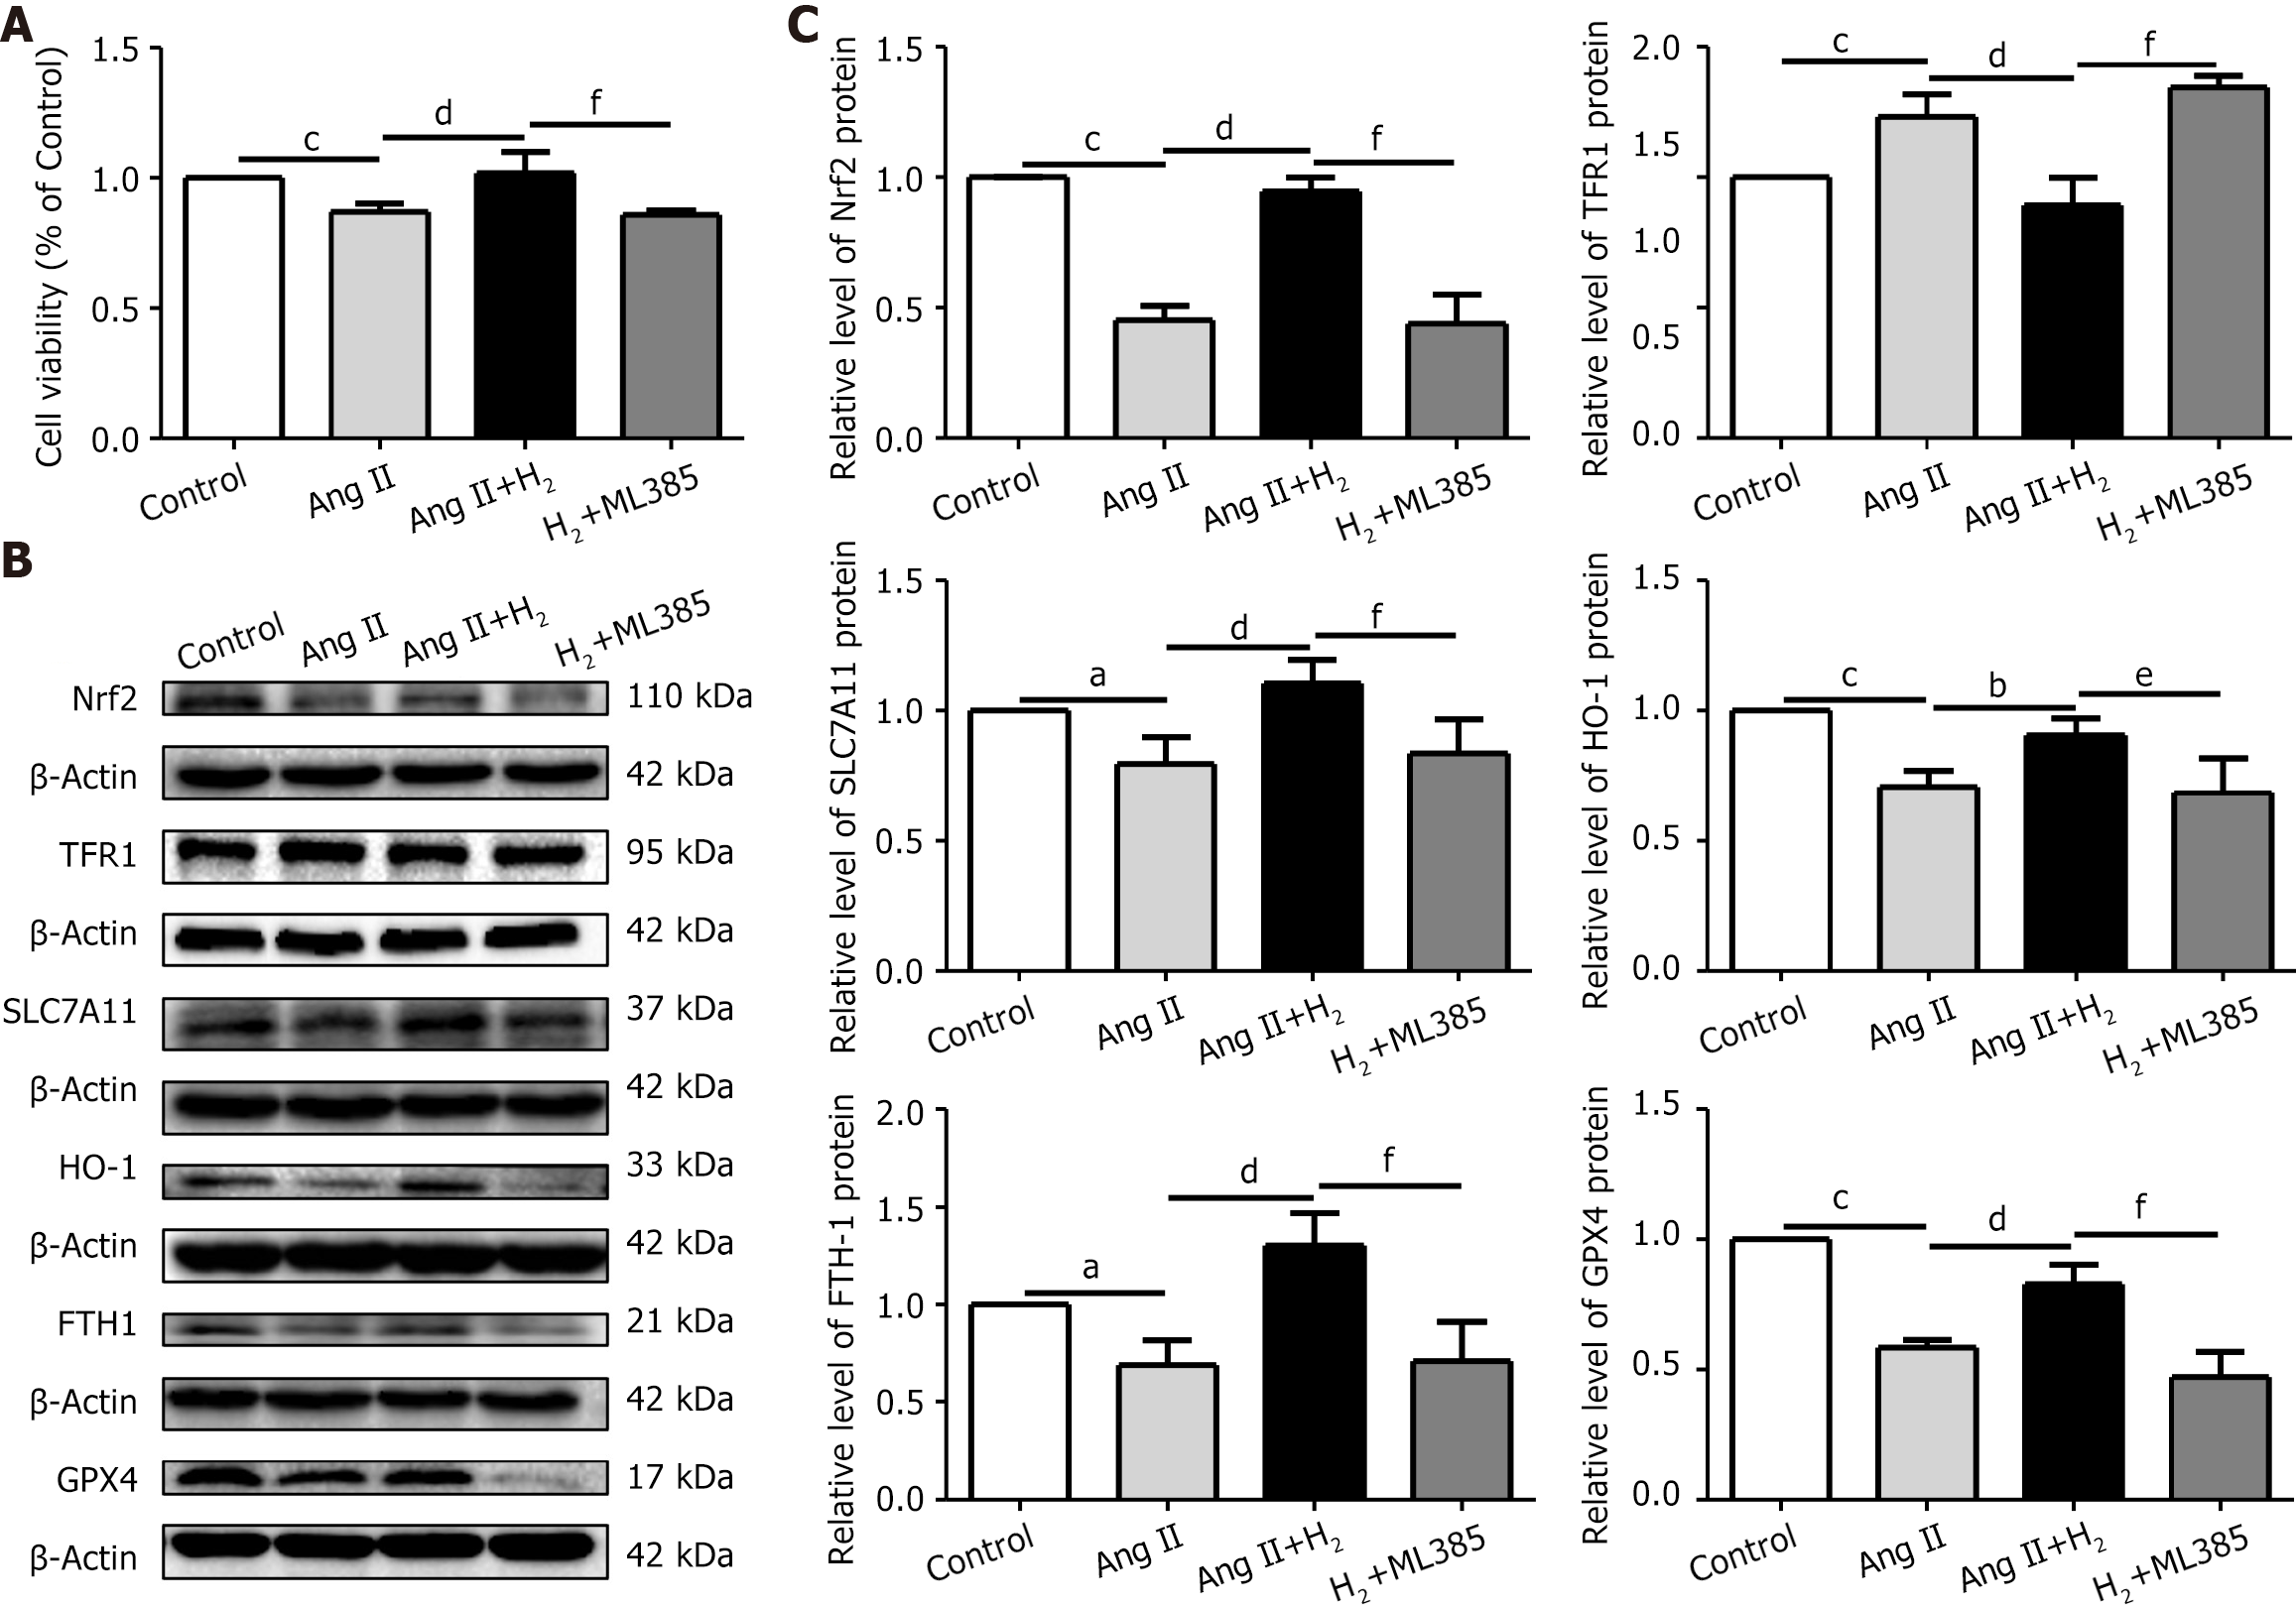
Figure 11 The Nrf2 inhibitor ML385 (1 μmol/L) inhibited restoration of the Nrf2/HO-1 signaling pathway in an angiotensin II-treated H9C2 cells after Hydrogen treatment.
A: Cell viability in each group; B: Representative western blotting of Nrf2, TFR1, SLC7A11, HO-1, FTH1, and GPX4 proteins; C: Relative levels of Nrf2, TFR1, SLC7A11, HO-1, FTH1, and GPX4 proteins. Data are expressed as the mean ± SD; n ≥ 3. aP < 0.05 and cP < 0.01: Ang II group vs control group; bP < 0.05 and dP < 0.01: Ang II+H2 group vs Ang II group; eP < 0.05 and fP < 0.01: Ang II+H2+ML385 group vs Ang II+H2 group. MCT: Monocrotaline; H2: Hydrogen; Ang II: An angiotensin II.
- Citation: Bai JC, Yang HX, Zhan CC, Zhao LQ, Liu JR, Yang W. Hydrogen alleviates right ventricular hypertrophy by inhibiting ferroptosis via restoration of the Nrf2/HO-1 signaling pathway. World J Cardiol 2025; 17(6): 104832
- URL: https://www.wjgnet.com/1949-8462/full/v17/i6/104832.htm
- DOI: https://dx.doi.org/10.4330/wjc.v17.i6.104832


