Copyright
©The Author(s) 2025.
World J Cardiol. Jun 26, 2025; 17(6): 104832
Published online Jun 26, 2025. doi: 10.4330/wjc.v17.i6.104832
Published online Jun 26, 2025. doi: 10.4330/wjc.v17.i6.104832
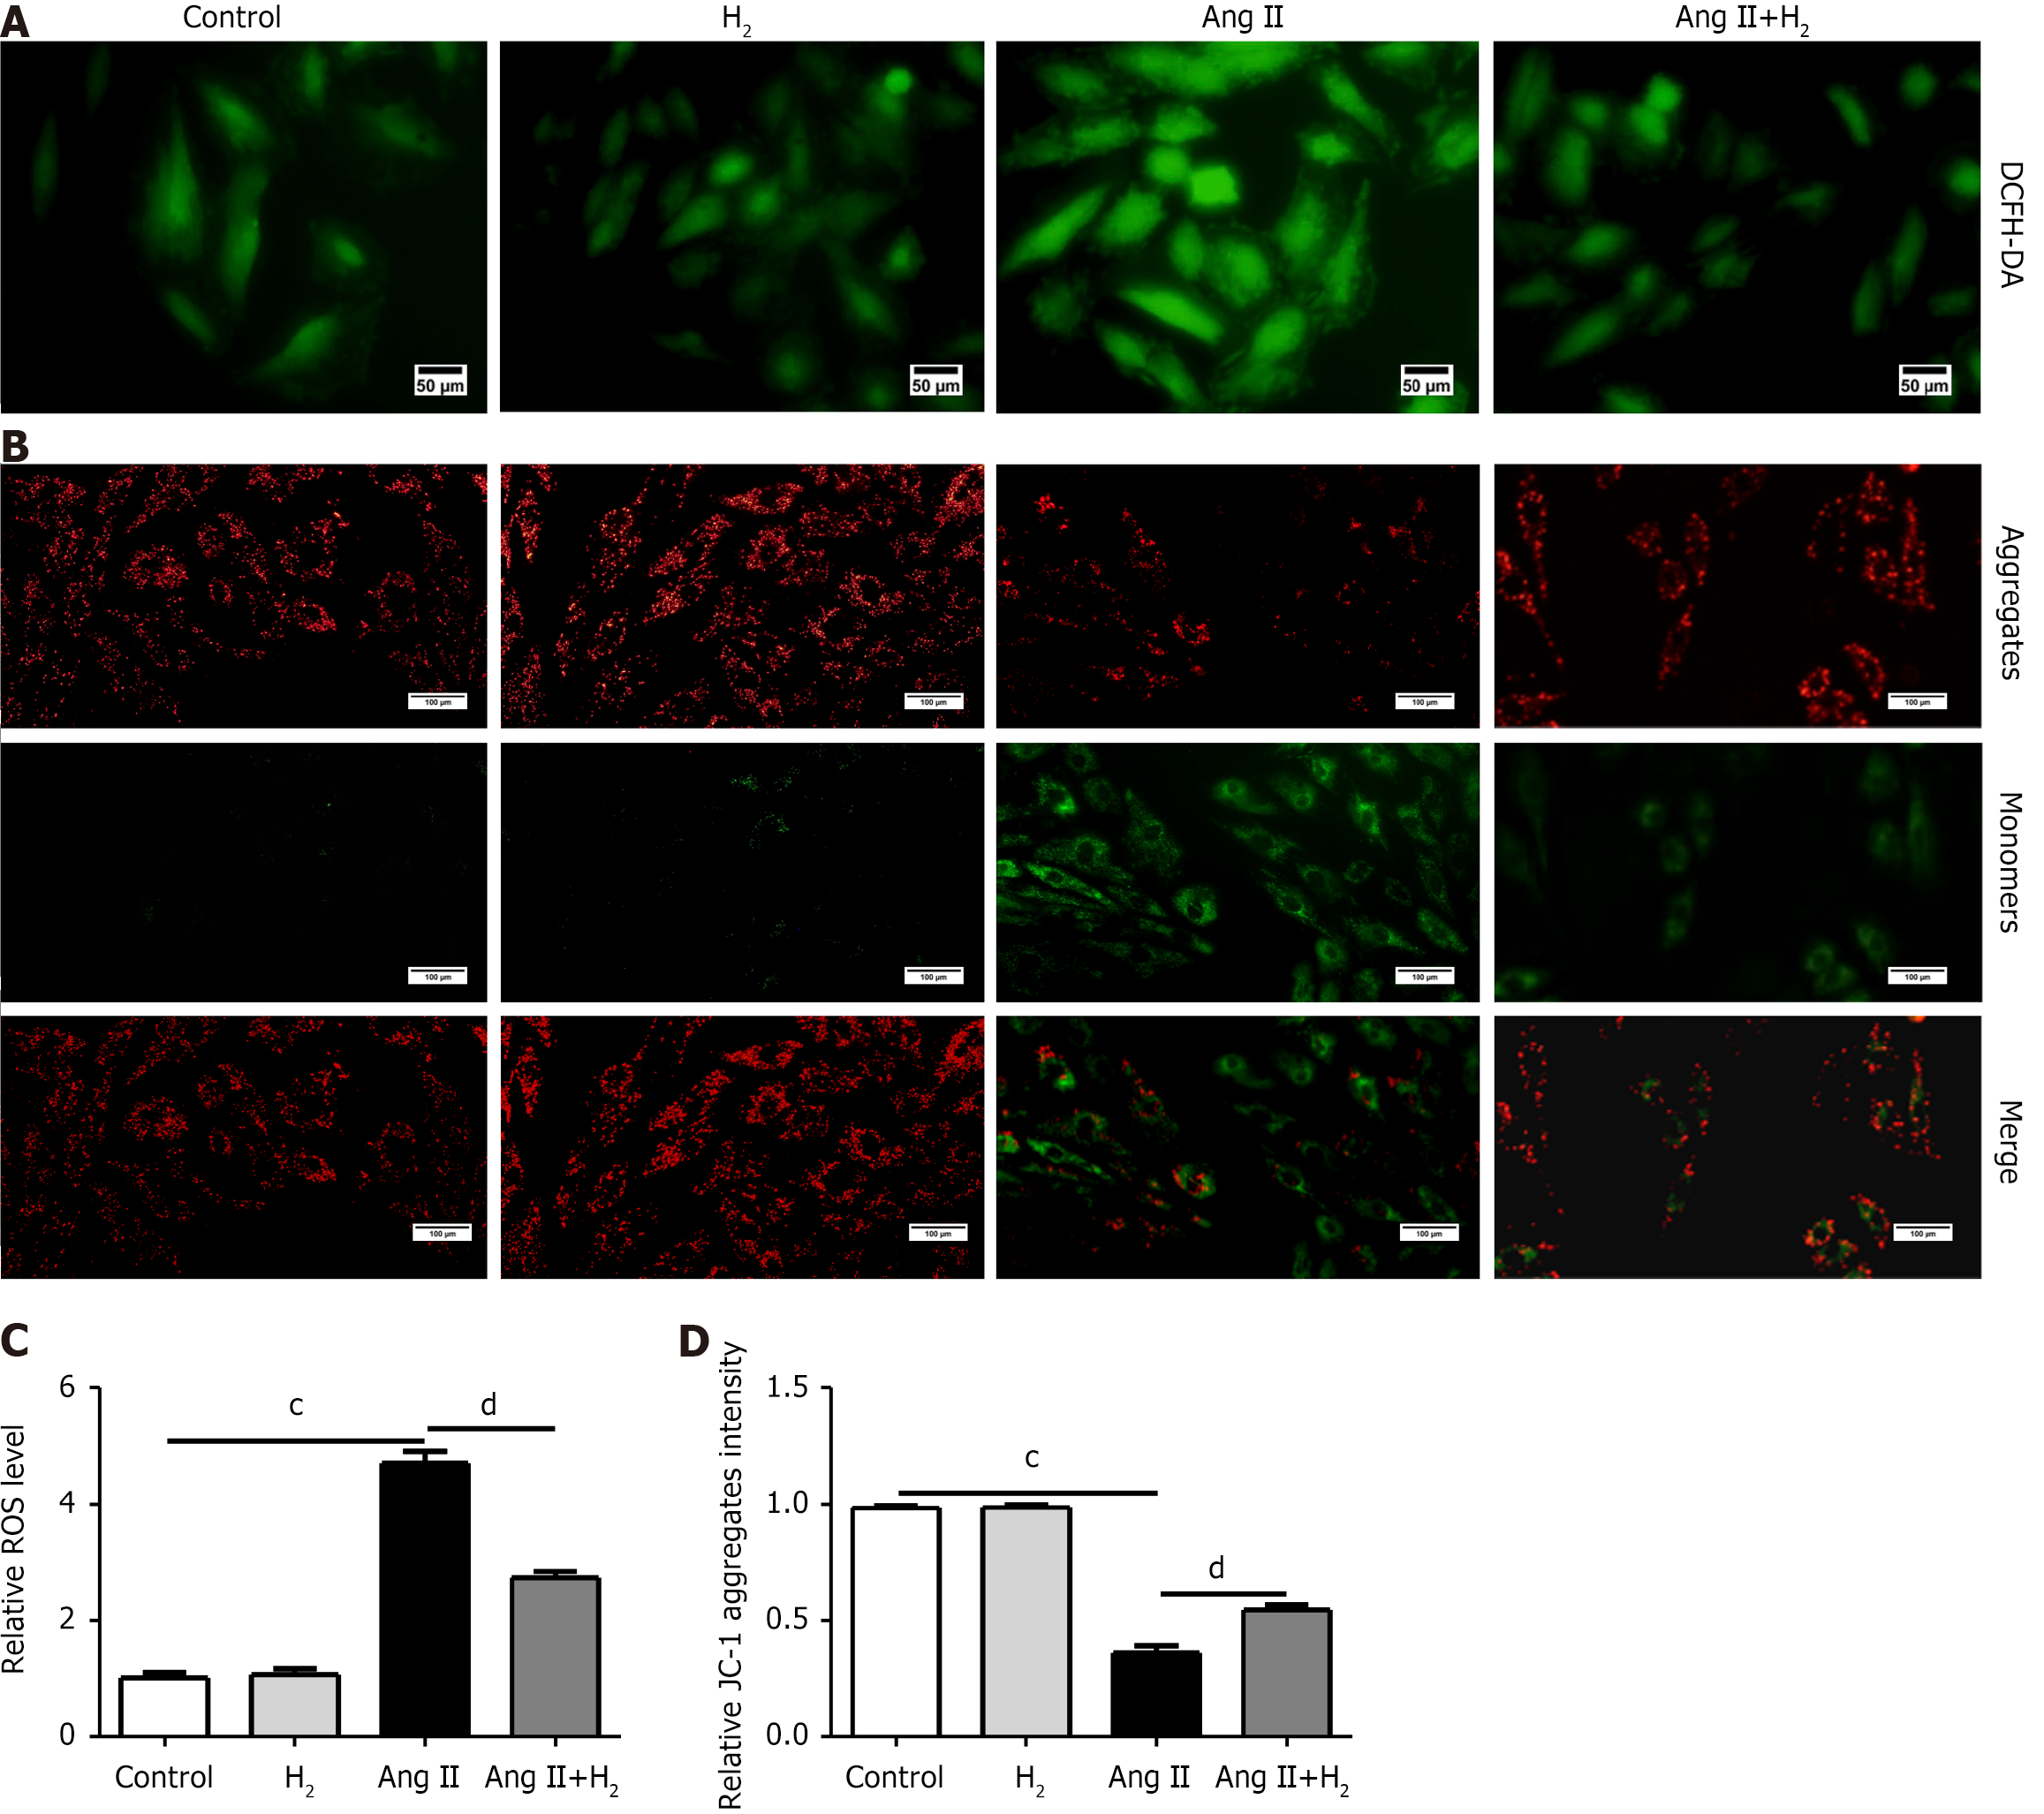
Figure 9 Hydrogen ameliorated oxidative stress and suppresses reactive oxygen species overproduction in H9C2 cells.
A: Representative images of the DCFH-DA staining. Magnification is 20 ×. Scale bar = 50 µm; B: Representative images of JC-1 staining. Magnification is 10 ×. Scale bar = 100 µm; C: Relative reactive oxygen species levels in each group; n = 4; D: Relative JC-1 aggregate intensity in each group; n = 4. Data are expressed as the mean ± SD. cP < 0.01: Ang II group vs control group; dP < 0.01: Ang II+H2 group vs Ang II group. MCT: Monocrotaline; H2: Hydrogen; Ang II: An angiotensin II; ROS: Reactive oxygen species.
- Citation: Bai JC, Yang HX, Zhan CC, Zhao LQ, Liu JR, Yang W. Hydrogen alleviates right ventricular hypertrophy by inhibiting ferroptosis via restoration of the Nrf2/HO-1 signaling pathway. World J Cardiol 2025; 17(6): 104832
- URL: https://www.wjgnet.com/1949-8462/full/v17/i6/104832.htm
- DOI: https://dx.doi.org/10.4330/wjc.v17.i6.104832


