Copyright
©The Author(s) 2025.
World J Cardiol. Jun 26, 2025; 17(6): 104832
Published online Jun 26, 2025. doi: 10.4330/wjc.v17.i6.104832
Published online Jun 26, 2025. doi: 10.4330/wjc.v17.i6.104832
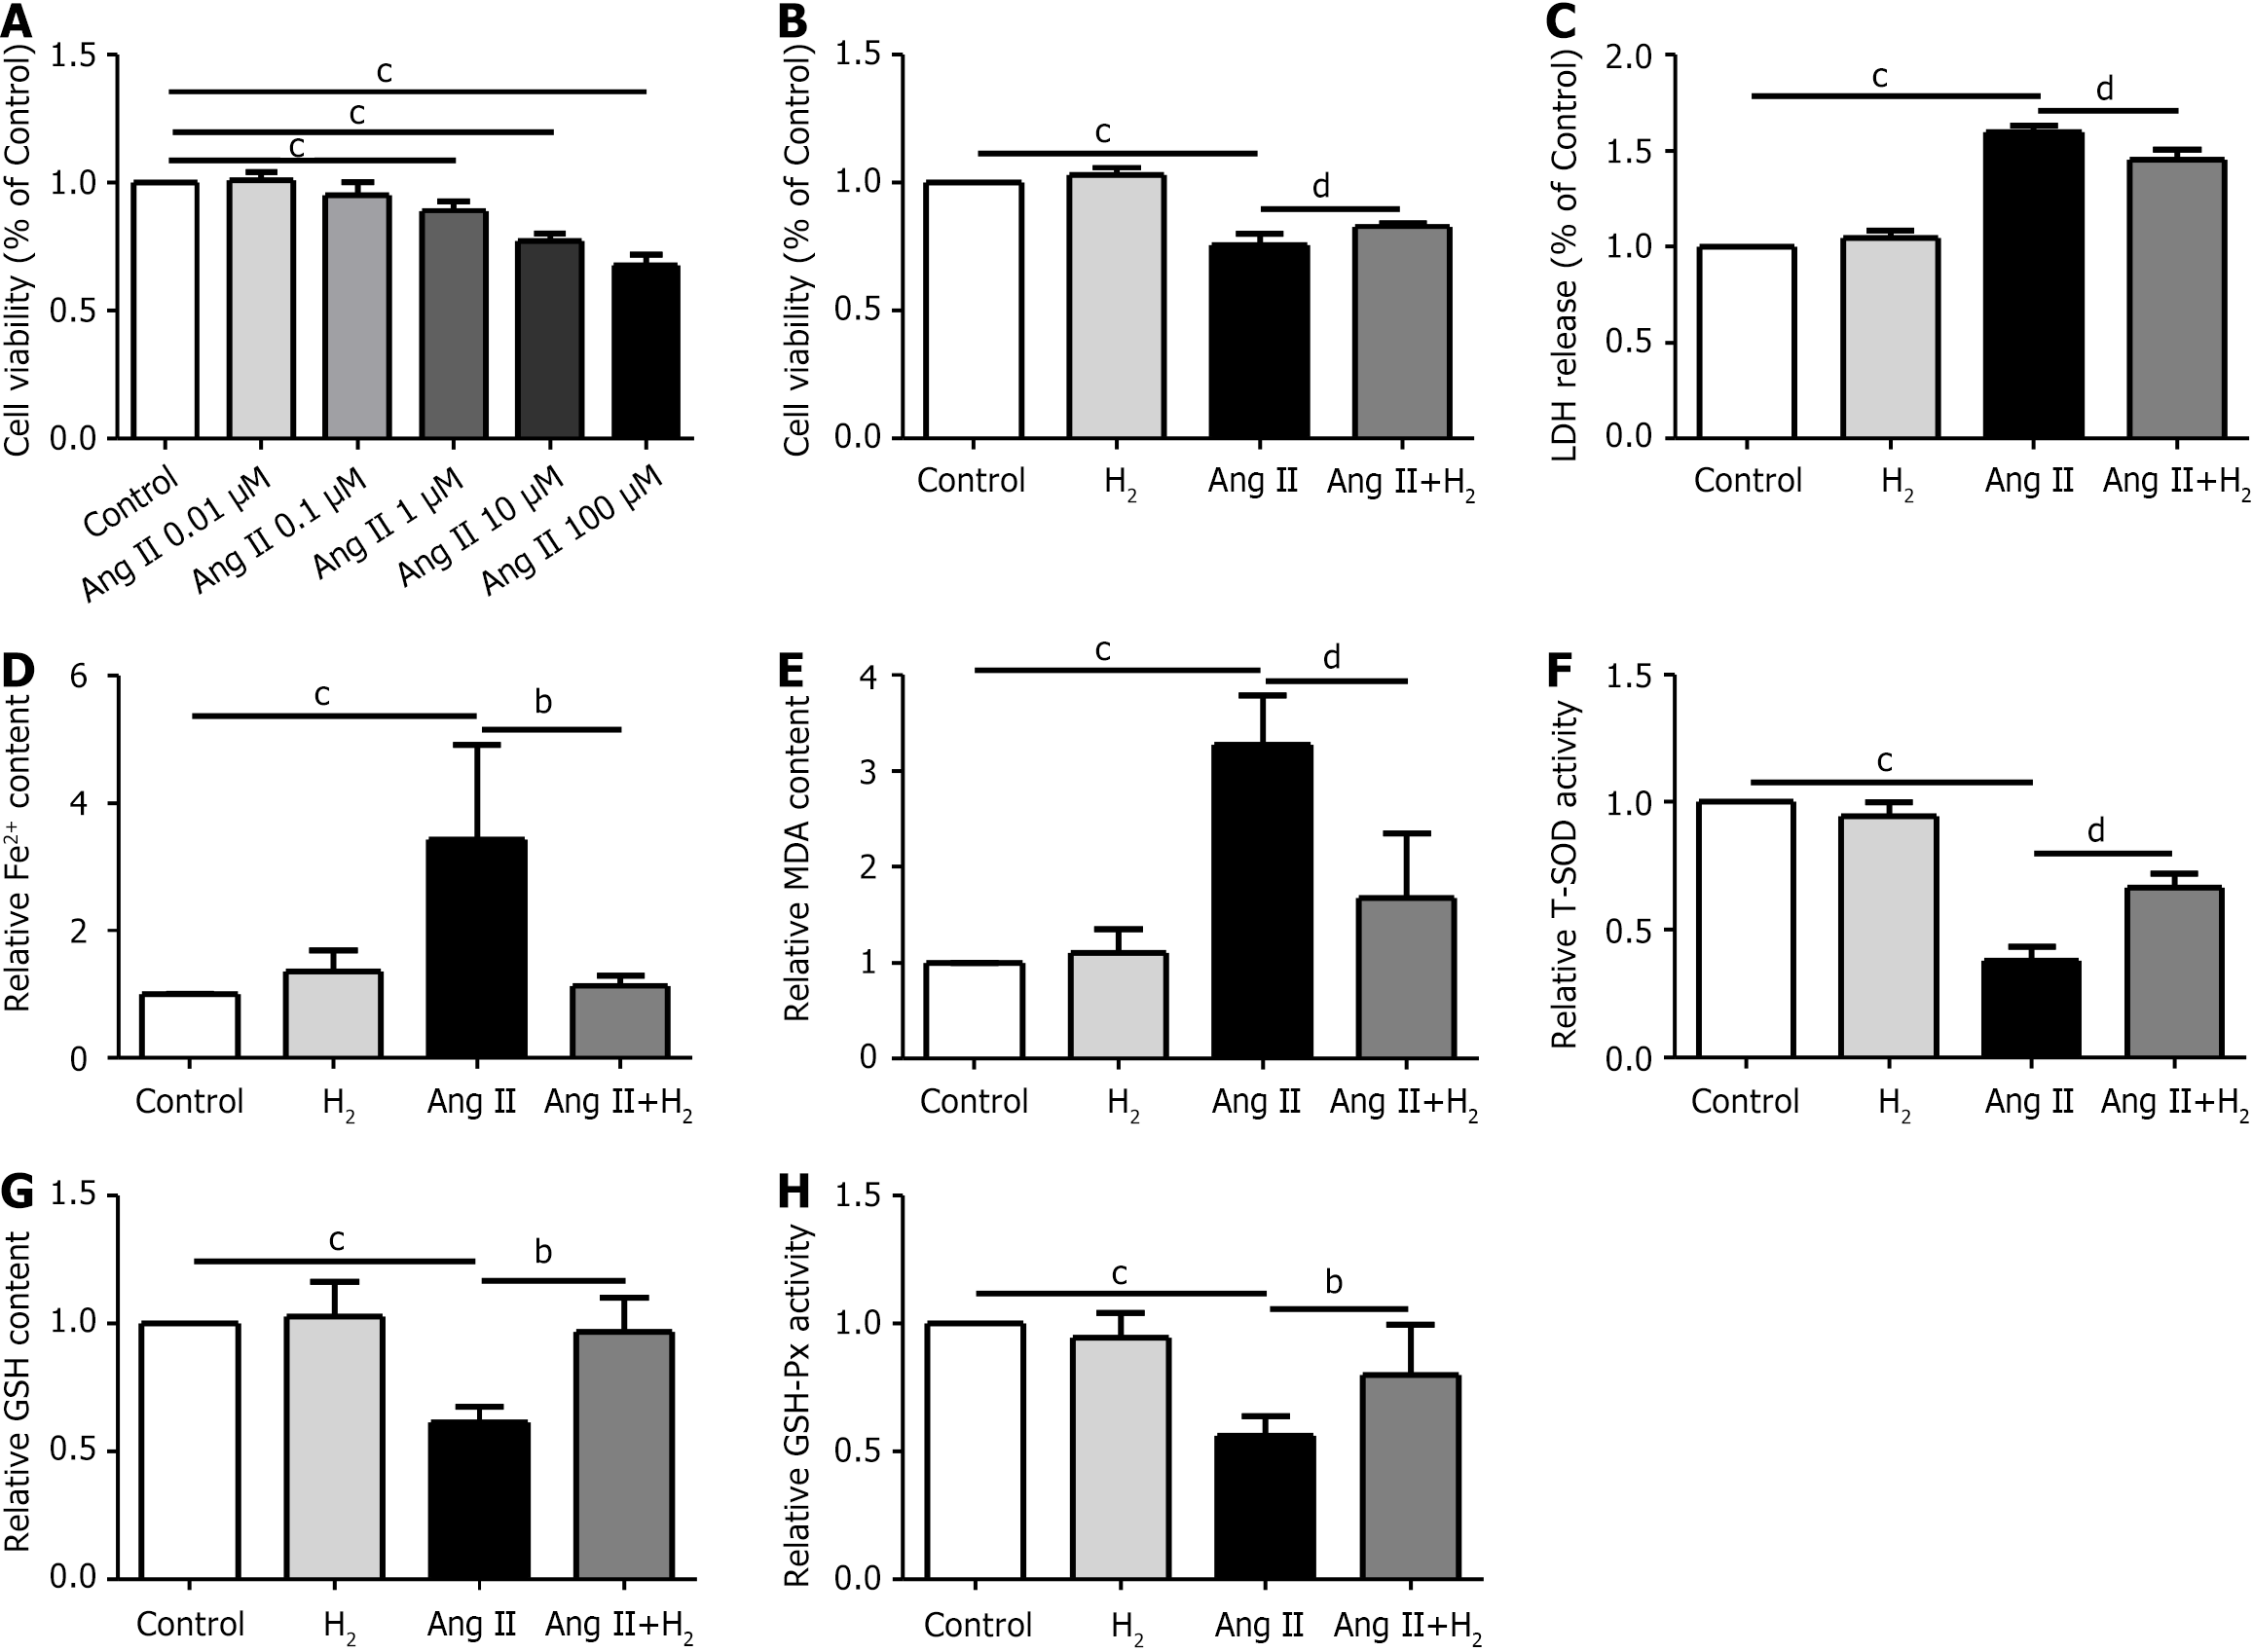
Figure 7 Hydrogen alleviates Fe2+ content and oxidative stress in an angiotensin II-treated H9C2 cells.
A: Cell viability with different An angiotensin II concentrations (0, 0.01, 0.1, 1, 10, and 100 μmol/L) relative to the control; B: Relative cell viability in each group; C: Relative lactate dehydrogenase release in each group; D: Relative Fe2+ content in each group, n = 4; E: Relative malonaldehyde content in each group; n = 4; F: Relative total superoxide dismutase activity in each group; n = 4; G: Relative glutathione content of each group; n = 4; H: Relative GSH-Px activity in each group; n = 4. Data are expressed as the mean ± SD. cP < 0.01: Ang II group vs control group; bP < 0.05 and dP < 0.01: Ang II+H2 group vs Ang II group. MCT: Monocrotaline; H2: Hydrogen; MDA: Malonaldehyde; LDH: lactate dehydrogenase; T-SOD: total superoxide dismutase; Ang II: An angiotensin II.
- Citation: Bai JC, Yang HX, Zhan CC, Zhao LQ, Liu JR, Yang W. Hydrogen alleviates right ventricular hypertrophy by inhibiting ferroptosis via restoration of the Nrf2/HO-1 signaling pathway. World J Cardiol 2025; 17(6): 104832
- URL: https://www.wjgnet.com/1949-8462/full/v17/i6/104832.htm
- DOI: https://dx.doi.org/10.4330/wjc.v17.i6.104832


