Copyright
©The Author(s) 2017.
World J Gastroenterol. Jun 14, 2017; 23(22): 4016-4038
Published online Jun 14, 2017. doi: 10.3748/wjg.v23.i22.4016
Published online Jun 14, 2017. doi: 10.3748/wjg.v23.i22.4016
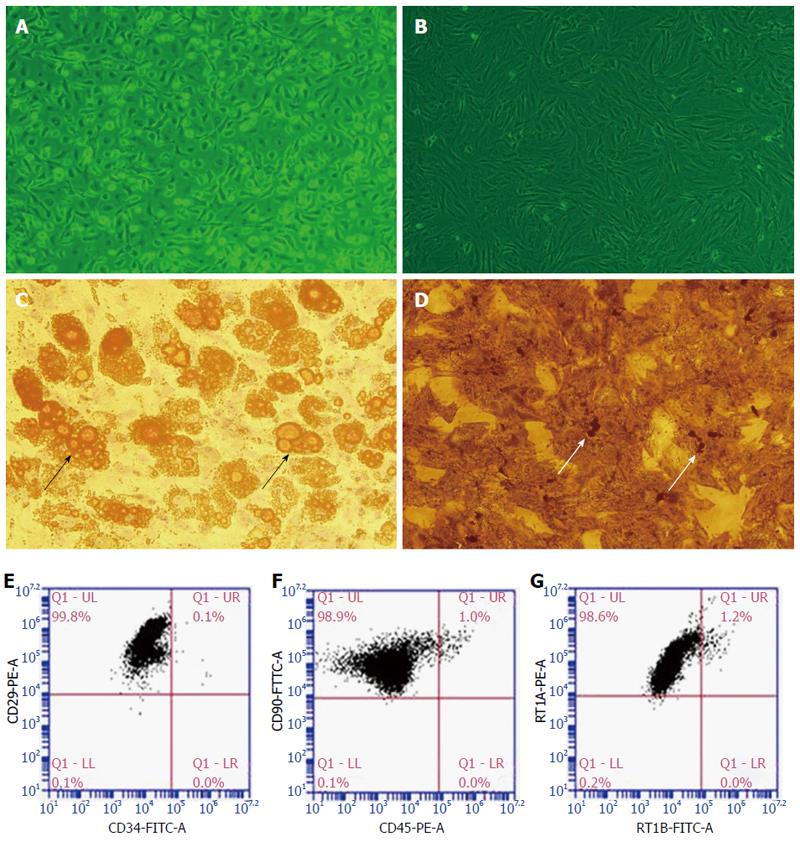
Figure 1 Identification of bone marrow-derived cells as bone marrow mesenchymal stem cells.
Morphology of first-passage (A) and third-passage (B) BMMSCs (× 100). The differentiation capability of BMMSCs into adipogenic or osteogenic cells was evaluated by oil red O (× 200) (C) or Von Kossa staining (D) (× 200). The arrows indicate the red lipid droplets (C) or the black calcium deposition (D); The proportion of CD29-positive and CD34-negative cells was 99.8% (E); The proportion of CD90-positive and CD45-negative cells was approximately 98.9% (F); The proportion of RT1A-positive and RT1B-negative cells was 98.6% (G). BMMSCs: Bone marrow mesenchymal stem cells.
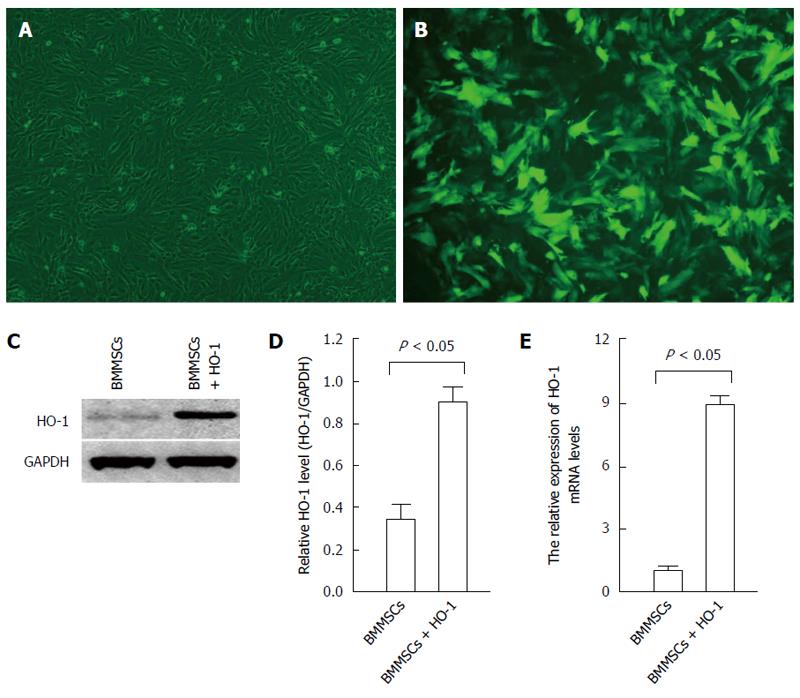
Figure 2 Expression of fluorescence, protein, and mRNA of HO-1 in HO-1 modified BMMSCs.
A: Bright field microscopy of HO-1 modified BMMSCs; B: Fluorescent microscopy of HO-1 modified BMMSCs (The positive expression rate of GFP exceeded 85 %); C: Expression of HO-1 protein in HO-1 modified BMMSCs and native BMMSCs; D: The expression of HO-1 protein in HO-1 modified BMMSCs (0.903 ± 0.072) was significantly higher than that in native BMMSCs (0.348 ± 0.065; P < 0.05); E: The relative expression of HO-1 mRNA in HO-1 modified BMMSCs (8.89 ± 0.40) was 7.89 times higher than that in native BMMSCs (1.00 ± 0.24; P < 0.05). BMMSCs: Bone marrow mesenchymal stem cells; HO-1: Heme oxygenase-1.
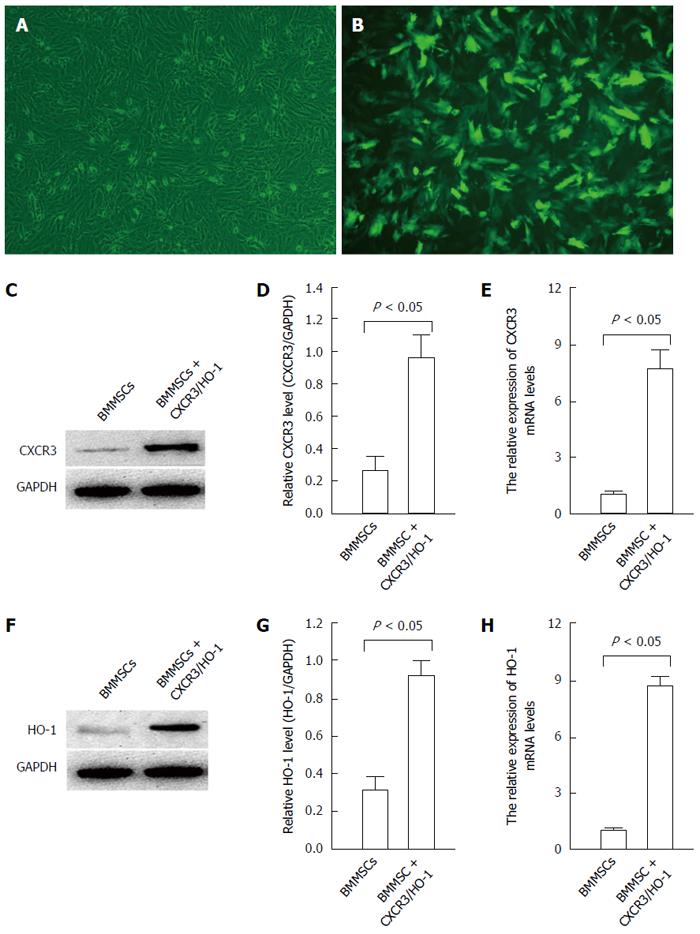
Figure 3 Expression of fluorescence, protein and mRNA of CXCR3 and HO-1 in CXCR3/HO-1 modified BMMSCs.
A: Bright field microscopy of CXCR3/HO-1 modified BMMSCs; B: Fluorescent microscopy of CXCR3/HO-1 modified BMMSCs (the positive expression rate of GFP exceeded 85%); C: Expression of CXCR3 protein in CXCR3/HO-1 modified BMMSCs and native BMMSCs; D: The expression of CXCR3 protein in CXCR3/HO-1 modified BMMSCs (0.96 ± 0.14) was significantly higher than that in native BMMSCs (0.25 ± 0.09, P < 0.05); E: The relative expression of CXCR3 mRNA in CXCR3/HO-1 modified BMMSCs (7.69 ± 1.06) was 6.69 times higher than that in native BMMSCs (1.00 ± 0.20, P < 0.05); F: Expression of HO-1 protein in CXCR3/HO-1 modified BMMSCs and native BMMSCs; G: The expression of HO-1 protein in CXCR3/HO-1 modified BMMSCs (0.91 ± 0.081) was significantly higher than that in native BMMSCs (0.305 ± 0.071, P < 0.05); H: The relative expression of HO-1 mRNA in CXCR3/HO-1 modified BMMSCs (8.71 ± 0.51) was 7.71 times higher than that in native BMMSCs (1.00 ± 0.19, P < 0.05). BMMSCs: Bone marrow mesenchymal stem cells; HO-1: Heme oxygenase-1.
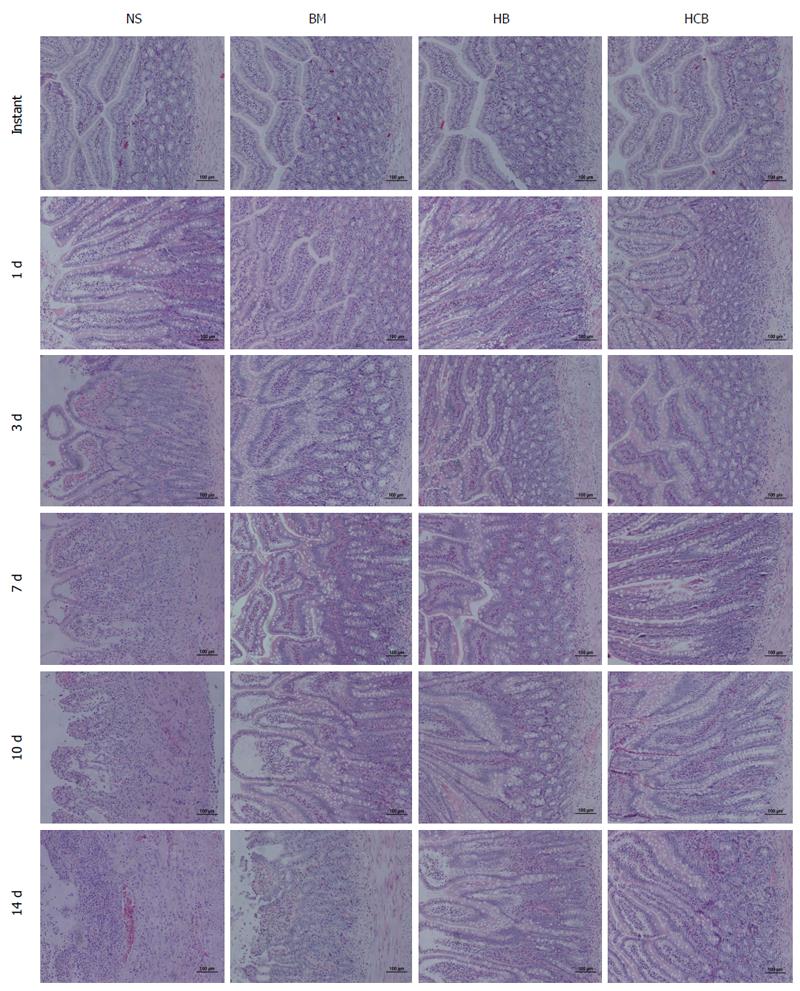
Figure 4 Pathology of transplanted small bowel (HE staining, × 100).
All four groups showed normal histological results immediately after transplant. The NS group showed mild rejection at day 1 after transplantation: shorter and bifurcated intestinal villi, mild submucosal edema, cryptic epithelial cells with mild damage (cytoplasmic basophilic increase, nuclear enlargement, and color deepening) and increased apoptosis, more than six apoptotic bodies per 10 crypt cells, and mild mononuclear cells which are the main inflammatory cells found during inflammatory infiltration of the lamina propria; in contrast, the BM group, HB group, and HCB group showed only mild edema. The pathological changes at 3 d after transplantation in the NS group were more severe than those at 1 day, where the submucosal edema was aggravated, and there was increased inflammatory infiltration of the lamina propria; the BM group and HB group showed mild inflammatory infiltration of the lamina propria, and the HCB group was similar to the normal intestine. The NS group showed moderate rejection at day 7 after transplantation: a reduced ratio of villous height to crypt, partial necrosis of glandular epithelial cells, aggravated edema and inflammation, diffuse crypt damage and increased apoptosis, and mild arteritis and congestion of lamina propria and submucosa; the BM group and HB group showed mild rejection: the BM group had shorter intestinal villi, mild submucosal edema, inflammatory cell infiltration, mild crypt epithelial injury, and increased apoptosis; the HB group had mild inflammatory cell infiltration, mild crypt injury, with other signs not being obvious; the HCB group were indeterminate for rejection: mild cryptic epithelial damage and the number of apoptotic bodies increased, with mild, local inflammatory cell infiltration of the lamina propria. The NS group showed severe rejection at day 10 after transplantation: intestinal villus changes were further aggravated, with serious shedding of the intestinal mucosal epithelial cells, while crypt epithelial injury was very serious; inflammatory cell infiltration involved the muscle layer, resulting in severe arteritis; the pathological changes in the BM group, HB group, and HCB group at day 10 were more severe than those at day 7 after transplantation. The structures of the intestinal mucosa layer were completely destroyed and the intestinal wall became thinner with necrosis in the NS group 14 d after transplantation; the BM group showed moderate rejection; the HB group did not achieve moderate rejection but rejection was more severe than mild; the HCB group showed mild rejection.
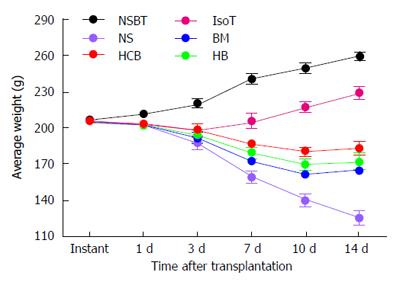
Figure 5 Average body weight of rats after small bowel transplantation.
The average body weight (BW) of rats in the NSBT group increased by 3.82 g/d. BW of rats in the IsoT group decreased slightly after transplantation, recovered to preoperative BW at day 7 (206.08 ± 3.87 vs 205.45 ± 2.10), and later increased by 3.32 g/d. BW of rats at day 1 showed no significant difference between the NS group, BM group, HB group, and HCB group (203.78 ± 3.01 g vs 202.87 ± 2.33 g vs 202.16 ± 2.14 g vs 203.76 ± 2.65 g, P > 0.05). Any two groups of the NS group, BM group, HB group, and HCB group showed significant differences in the average BW of rats at 3 d, 7 d, 10 d, and 14 d after transplantation, respectively (3 d: 188.34 ± 2.13 g vs 192.00 ± 3.39 g vs 194.21 ± 2.99 g vs 198.65 ± 2.02 g; 7 d: 160.02 ± 4.87 g vs 172.67 ± 2.17 g vs 179.35 ± 2.37 g vs 187.21 ± 3.28 g; 10 d: 140.25 ± 4.45 g vs 161.83 ± 3.01 g vs 170.05 ± 2.72 g vs 180.32 ± 3.85 g; 14 d: 125.74 ± 6.63 g vs 165.32 ± 2.89 g vs 172.23 ± 6.92 g vs 183.65 ± 5.44 g; P < 0.05). BW in the HCB group was the highest, followed by the HB group and BM group, and BW in the NS group was the lowest. The average BW of rats at day 3 showed no significant difference between the BM group and the HB group (P > 0.05).
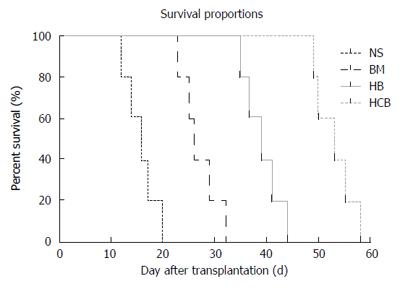
Figure 6 Survival rates of rats after small bowel transplantation.
The survival time of rats in the HCB group was longer than those in the NS group, BM group and HB group (median survival time: 53 d vs 16 d vs 26 d vs 39 d; P < 0.05). The survival time of rats in the HB group was longer than that in the BM group (P < 0.05). The survival time of rats in the NS group was shorter than those in the BM group, HB group, and HCB group (P < 0.05). The χ2 and P values for comparison of survival rates in different groups are the same (χ2 = 9.701 and P < 0.01).
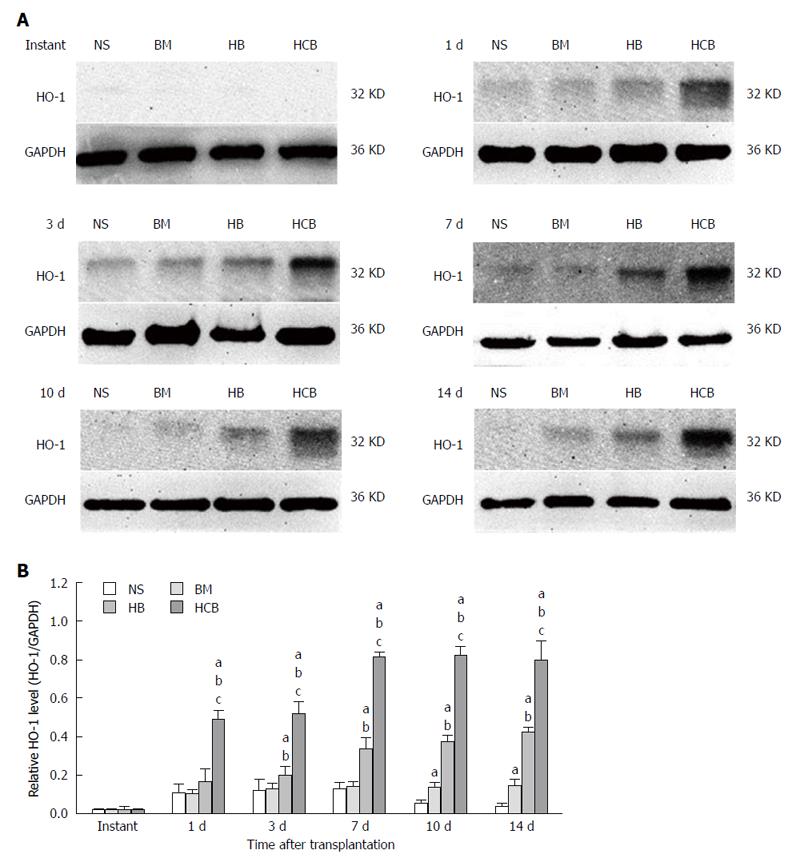
Figure 7 The expression of HO-1 protein in small intestine in different groups.
aP < 0.05 vs NS group, bP < 0.05 vs BM group, cP < 0.05 vs HB group. A: Expression of HO-1 protein in the NS group, BM group, HB group, and HCB group; B: Relative concentration of HO-1 protein in different groups. The expression of HO-1 protein in the transplanted small bowel was low at 0 h, and there was no significant difference between these four groups (P > 0.05). The relative concentration of HO-1 protein in the HCB group was the highest, followed by the HB group and BM group, and was lowest in the NS group at other time points (P < 0.05). HO-1: Heme oxygenase-1; NS: Normal saline.
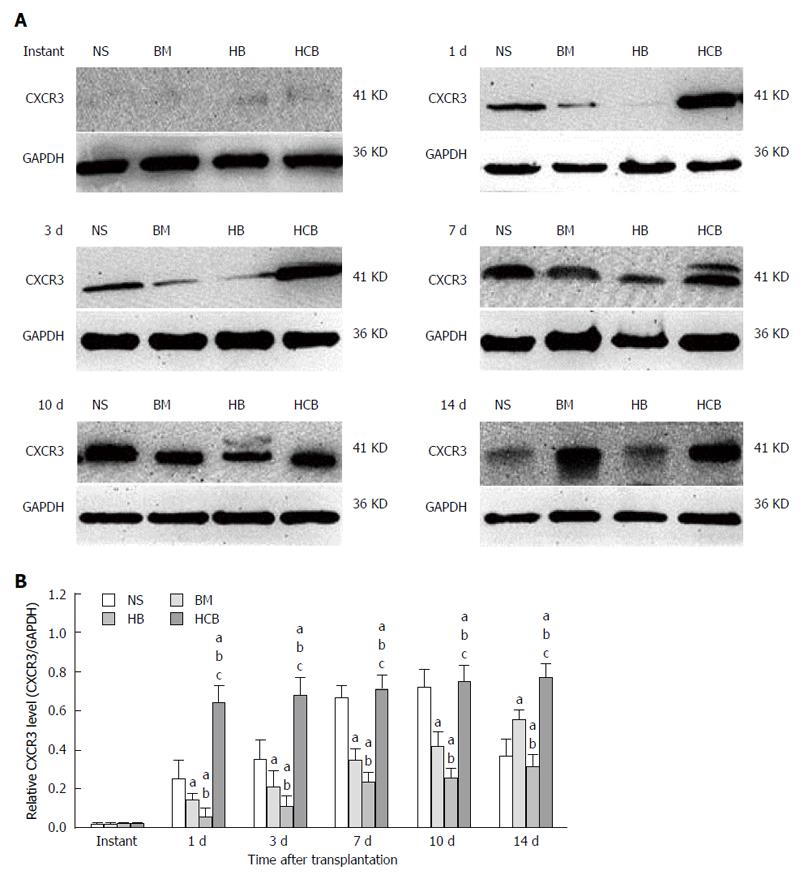
Figure 8 Expression of CXCR3 protein in small intestine in different groups.
aP < 0.05 vs NS group, bP < 0.05 vs BM group, cP < 0.05 vs HB group. A: Expression of CXCR3 protein in the NS group, BM group, HB group, and HCB group; B: Relative concentration of CXCR3 protein in different groups. The expression of CXCR3 protein in the transplanted small bowel was low immediately after transplantation, and there was no significant difference between these 4 groups (P > 0.05). The relative concentration of CXCR3 protein in the HCB group was the highest, followed by the NS group and BM group, while it was lowest in the HB group at 1 d, 3 d, 7 d, and 10 d. The relative concentration of CXCR3 protein in the BM group was higher than that in the NS group at day 14, which may be due to a false increase caused by mass necrosis of transplanted small bowel in the NS group.
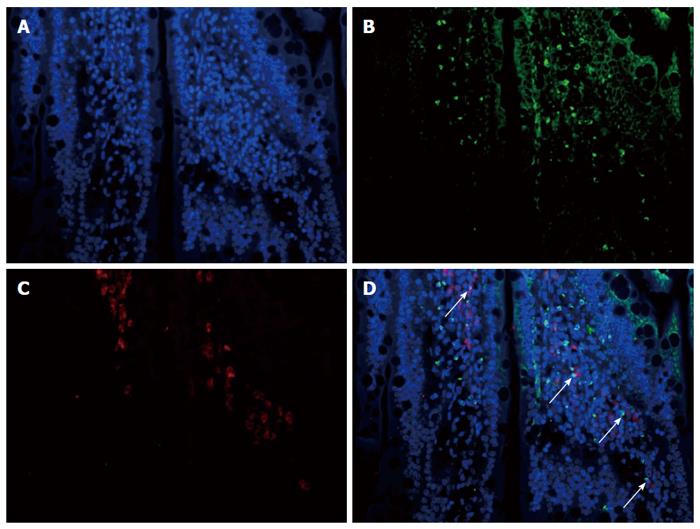
Figure 9 Expression of CXCR3/HO-1 in the transplanted small bowel in the HCB group at day 1.
A: Nuclear staining (DAPI); B: Staining of CXCR3 protein; C: Staining of HO-1 protein; D: Composite image of three types of staining showed co-expression of CXCR3 and HO-1 proteins in the transplanted small bowel (shown by arrows).
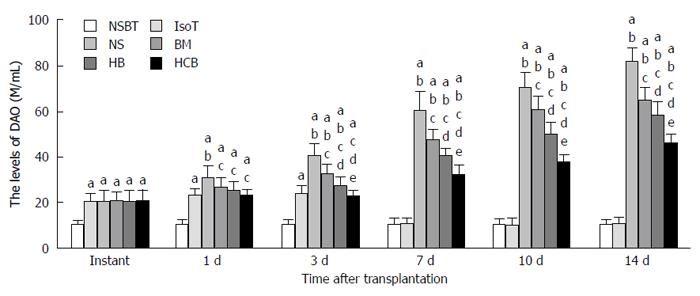
Figure 10 Concentrations of diamine oxidase in different groups.
aP < 0.05 vs NSBT group bP < 0.05 vs IsoT group, cP < 0.05 vs NS group, dP < 0.05 vs BM group, eP < 0.05 vs HB group. The concentration of DAO in the NSBT group was significantly lower than those in the other five groups (P < 0.05). The concentration of DAO in the IsoT group was comparable to that in the HCB group at day 1 (23.43 ± 2.77 M/mL vs 23.26 ± 2.50 M/mL; P < 0.05) and day 3 (24.13 ± 3.51 M/mL vs 23.26 ± 2.50 M/mL; P < 0.05). Serum concentration of DAO in the IsoT group at day 7 (11.14 ± 1.25 M/mL) nearly returned to the level of the NSBT group (10.80 ± 2.78 M/mL). At day 1 after transplantation, serum concentration of DAO in the NS group was significantly higher than those in the BM group, HB group, and HCB group (P < 0.05), comparable in the BM group and HB group (P > 0.05), and was lower in the HCB group when compared with the HB group (P < 0.05). Serum concentration of DAO in the HCB group was significantly lower than those in the NS group, BM group, and HB group at 3 d, 7 d, 10 d, and 14 d (P < 0.05). DAO: Diamine oxidase.
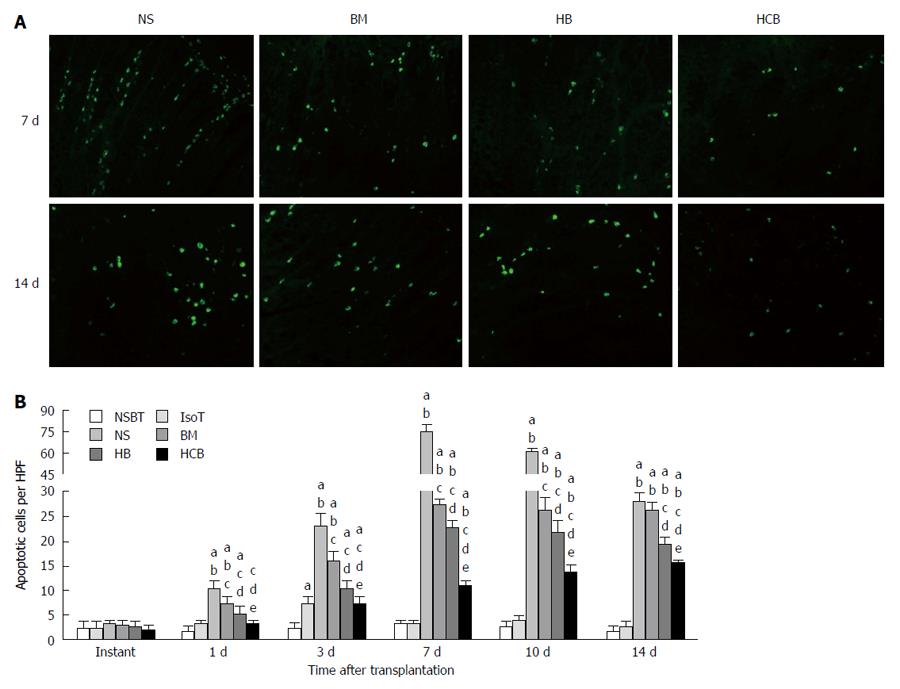
Figure 11 Apoptosis in the transplanted small bowel in different groups.
A: Fluorescent histochemistry images of apoptosis in the NS group, BM group, HB group, and HCB group at 7 d and 14 d (× 200); B: Comparison of apoptotic cell numbers in different groups. aP < 0.05 vs NSBT group, bP < 0.05 vs IsoT group, cP < 0.05 vs NS group, dP < 0.05 vs BM group, eP < 0.05 vs HB group. There was no significant difference in apoptosis between these six groups at 0 h (P > 0.05). The apoptotic cell number in the IsoT group increased at day 3 (7.20 ± 1.53/HPF), and nearly returned to the level of the NSBT group at day 7 (3.30 ± 0.57/HPF vs 3.20 ± 0.57/HPF). The apoptotic cell number in the NS group was the highest, and was significantly higher than those in the other five groups at all time points except immediately after transplantation (P < 0.05). The apoptotic cell number in the NS group increased significantly, reaching its maximum at day 7 (75.00 ± 5.20/HP), before decreasing (61.00 ± 2.65/HPF at day 10, 28.00 ± 1.73/HPF at day 14). The apoptotic cell number in the BM group was higher when compared with the HB group, and was higher in the HB group when compared with the HCB group (P < 0.05) simultaneously.
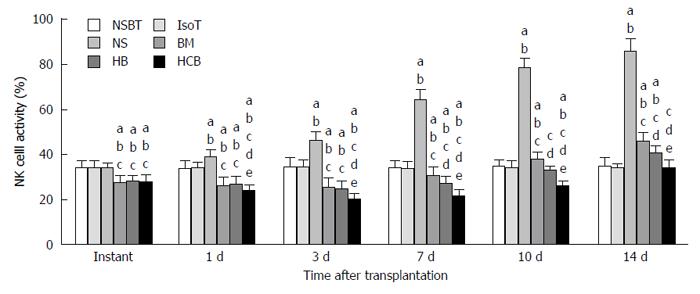
Figure 12 Activity of NK cells in different groups at each time point.
aP < 0.05 vs NSBT group, bP < 0.05 vs IsoT group, cP < 0.05 vs NS group, dP < 0.05 vs BM group, eP < 0.05 vs HB group. The activity of NK cells in the BM group (27.70% ± 3.28%), HB group (28.05% ± 2.87%), and HCB group (27.93% ± 3.26%) was significantly lower than that in the NSBT group (34.17% ± 3.29%), IsoT group (34.05% ± 3.22%), and NS group (34.05% ± 2.19%) at instant (P < 0.05). The activity of NK cells in the NS group increased significantly at 1 d, 3 d, 7 d, 10 d, and 14 d, and was higher than that in the other five groups at the same time points (P < 0.05). The activity of NK cells in the BM group was higher than that in the HB group, and the HB group was higher than the HCB group at 1 d, 3 d, 7 d, 10 d, and 14 d after transplantation (1 d: 26.47 ± 3.65% vs 26.86 ± 3.65% vs 24.20% ± 2.54%; 3 d: 25.64% ± 4.37% vs 24.97% ± 3.21% vs 20.20% ± 2.54%; 7 d: 30.59% ± 4.02% vs 27.47% ± 2.94% vs 21.67% ± 3.02%; 10 d: 37.92% ± 3.29% vs 33.3%1 ± 1.76% vs 26.19% ± 2.02%; 14 d: 46.12% ± 3.87% vs 40.81% ± 3.07% vs 34.40% ± 3.21%; P < 0.05).
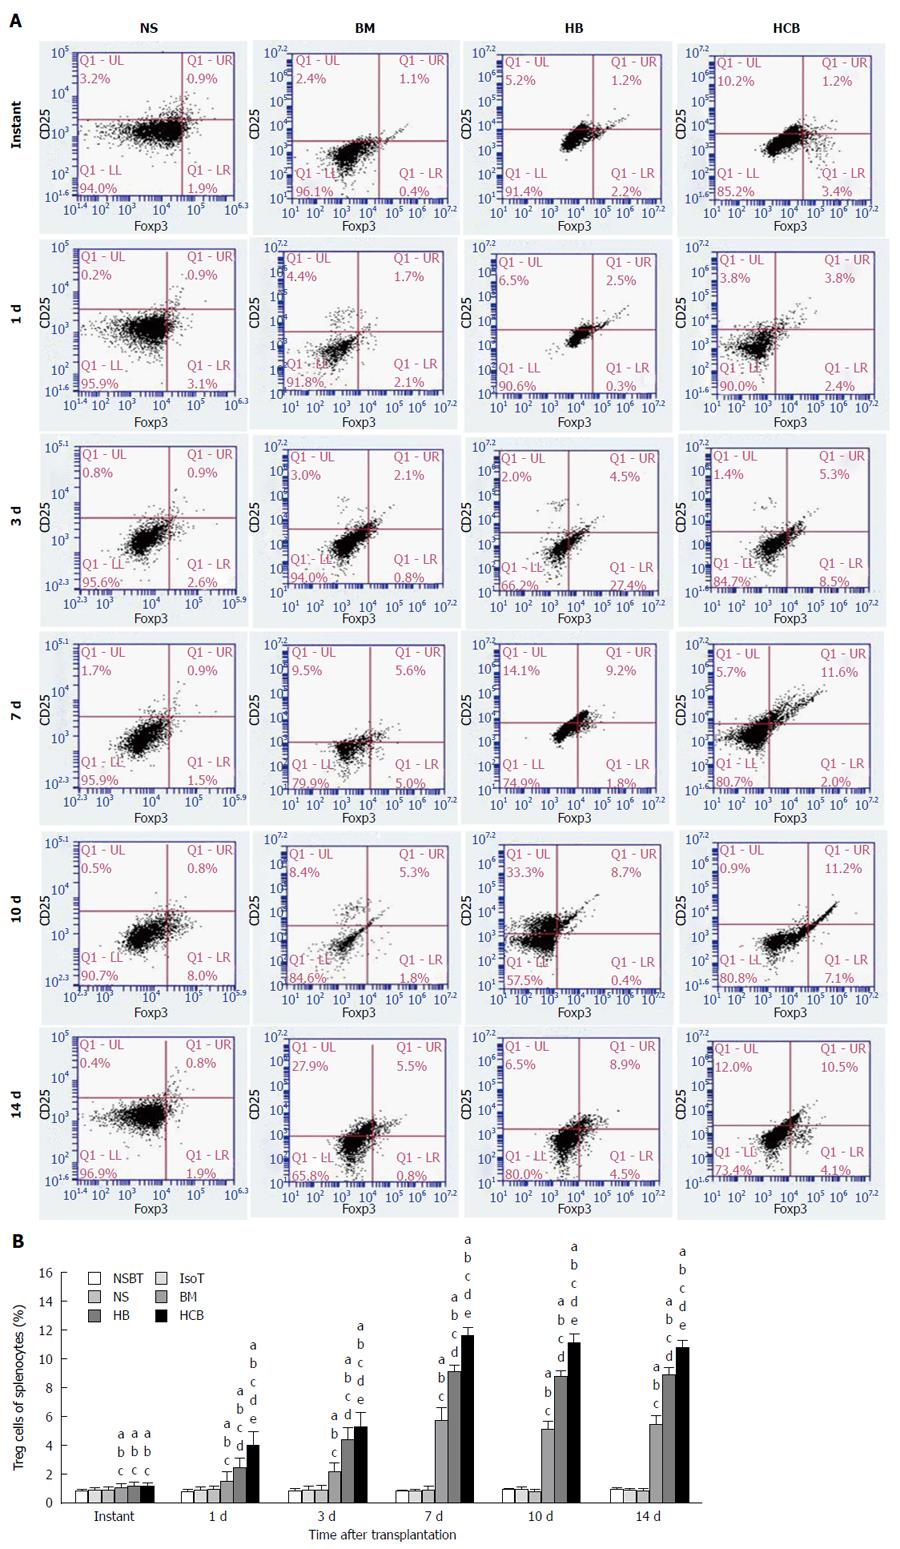
Figure 13 Ratio of regulatory T cells in different groups.
A: Flow cytometry of regulatory T cells in the NS group, BM group, HB group, and HCB group; B: Column chart of the ratio of regulatory T cells in different groups. aP < 0.05 vs NSBT group, bP < 0.05 vs IsoT group, cP < 0.05 vs NS group, dP < 0.05 vs BM group, eP < 0.05 vs HB group. The ratio of regulatory T cells in the BM group (1.09% ± 0.28%), HB group (1.20% ± 0.29%), and HCB group (1.18% ± 0.25%) was comparable, and these ratios were all significantly higher than those in the NBST group (0.86% ± 0.12%), IsoT group (0.90% ± 0.16%), and NS group (0.88% ± 0.24%; P < 0.05) immediately after transplantation. The ratio of regulatory T cells in the NBST group, IsoT group, and NS group showed no significant change over time (P > 0.05). The ratio of regulatory T cells in the HCB group was higher than that in the HB group and BM group, and the HB group was higher than the BM group at the same time points (1 d: 3.98% ± 0.930% vs 2.49% ± 0.65% vs 1.55% ± 0.62%; 3 d: 5.29% ± 1.01% vs 4.38% ± 0.82% vs 2.19% ± 0.59%; 7 d: 11.60% ± 0.54% vs 9.10% ± 0.48% vs 5.70 ± 0.89%; 10 d: 11.14% ± 0.60% vs 8.79% ± 0.40% vs 5.13% ± 0.55%; 14 d: 10.74% ± 0.53% vs 8.93% ± 0.44% vs 5.46% ± 0.61%; P < 0.05).
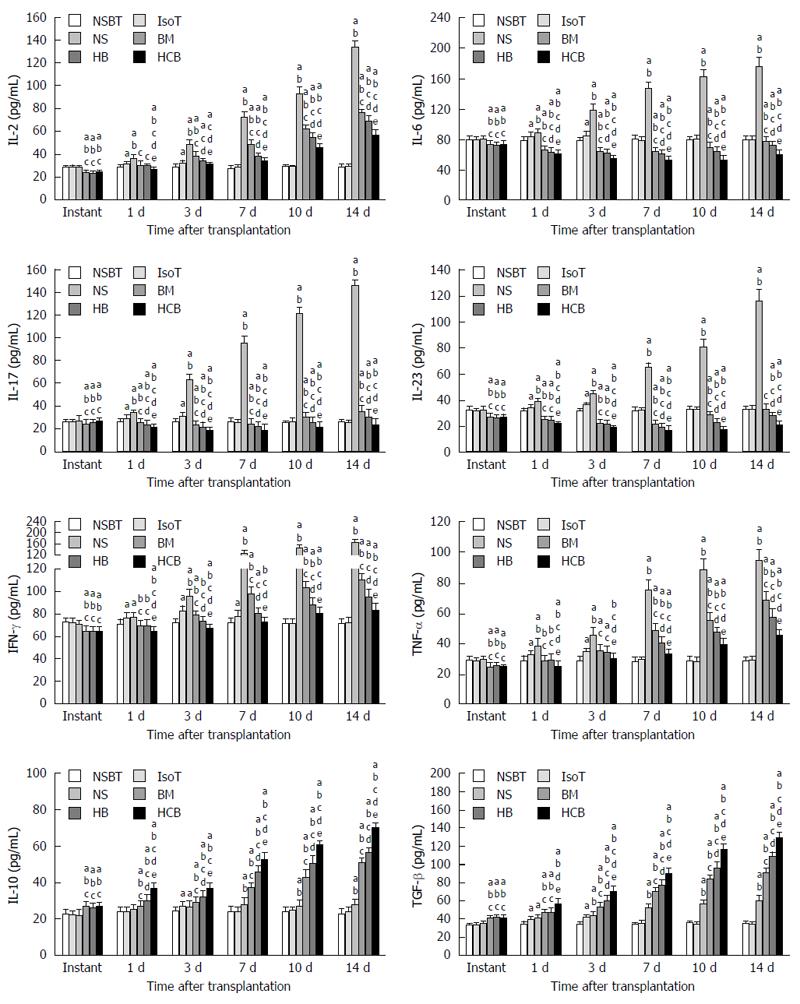
Figure 14 Proinflammatory cytokines and anti-inflammatory cytokines in different groups.
aP < 0.05 vs NSBT group, bP < 0.05 vs IsoT group, cP < 0.05 vs NS group, dP < 0.05 vs BM group, eP < 0.05 vs HB group. Cytokines in the BM group, HB group, and HCB group were comparable (P > 0.05), while cytokines in the NBST group, IsoT group, and NS group were comparable immediately after transplantation (P > 0.05). The levels of proinflammatory cytokines (IL-2, IL-6, IL-7, IL-23, IFN-γ, and TNF-α) in the former three groups were significantly lower than those levels in the latter three groups (P < 0.05), and the anti-inflammatory cytokine levels (IL-10 and TGF-β) in the former three groups were significantly higher than those in the latter three groups (P < 0.05). Cytokines in the IsoT group changed over time, and nearly returned to normal levels at day 7 (P > 0.05). Concentrations of IL-2, IFN-γ, and TNF-α in the HCB group were significantly lower than those in the NS group, BM group, and HB group at each time point (P < 0.05), with levels in the HB group lower than in the BM group (P < 0.05), and highest in the NS group (P < 0.05). Concentrations of IL-2, IFN-γ, and TNF-α in the BM group, HB group, and HCB group were significantly higher than those in the NSBT group at 10 d and 14 d (P < 0.05). Concentrations of IL-6, IL-17, and IL-23 in the HCB group were significantly lower than those in the NS group, BM group, and HB group (P < 0.05), with levels in the HB group lower than in the BM group (P < 0.05), and highest in the NS group (P < 0.05). Concentrations of IL-6, IL-17, and IL-23 in the BM group, HB group, and HCB group were significantly lower than those in the NSBT group at 1 d, 3 d, and 7 d. Concentrations of IL-10 and TGF-β in the HCB group were higher than those in the other five groups. The HB group had the second highest level, the BM group level was higher than the NS group, and the NSBT group was comparable to the IsoT group with the lowest cytokine level, especially at 7 d, 10 d, and 14 d after transplantation.
- Citation: Yin ML, Song HL, Yang Y, Zheng WP, Liu T, Shen ZY. Effect of CXCR3/HO-1 genes modified bone marrow mesenchymal stem cells on small bowel transplant rejection. World J Gastroenterol 2017; 23(22): 4016-4038
- URL: https://www.wjgnet.com/1007-9327/full/v23/i22/4016.htm
- DOI: https://dx.doi.org/10.3748/wjg.v23.i22.4016


