Copyright
©The Author(s) 2017.
World J Gastroenterol. Jun 14, 2017; 23(22): 4016-4038
Published online Jun 14, 2017. doi: 10.3748/wjg.v23.i22.4016
Published online Jun 14, 2017. doi: 10.3748/wjg.v23.i22.4016
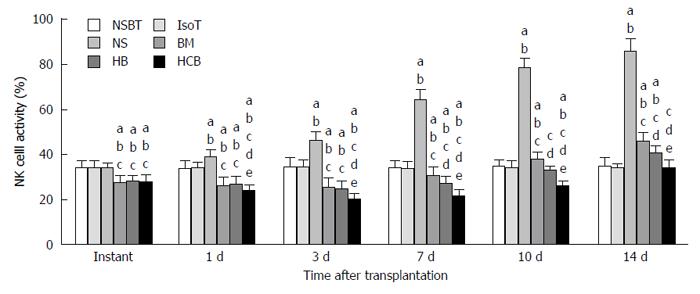
Figure 12 Activity of NK cells in different groups at each time point.
aP < 0.05 vs NSBT group, bP < 0.05 vs IsoT group, cP < 0.05 vs NS group, dP < 0.05 vs BM group, eP < 0.05 vs HB group. The activity of NK cells in the BM group (27.70% ± 3.28%), HB group (28.05% ± 2.87%), and HCB group (27.93% ± 3.26%) was significantly lower than that in the NSBT group (34.17% ± 3.29%), IsoT group (34.05% ± 3.22%), and NS group (34.05% ± 2.19%) at instant (P < 0.05). The activity of NK cells in the NS group increased significantly at 1 d, 3 d, 7 d, 10 d, and 14 d, and was higher than that in the other five groups at the same time points (P < 0.05). The activity of NK cells in the BM group was higher than that in the HB group, and the HB group was higher than the HCB group at 1 d, 3 d, 7 d, 10 d, and 14 d after transplantation (1 d: 26.47 ± 3.65% vs 26.86 ± 3.65% vs 24.20% ± 2.54%; 3 d: 25.64% ± 4.37% vs 24.97% ± 3.21% vs 20.20% ± 2.54%; 7 d: 30.59% ± 4.02% vs 27.47% ± 2.94% vs 21.67% ± 3.02%; 10 d: 37.92% ± 3.29% vs 33.3%1 ± 1.76% vs 26.19% ± 2.02%; 14 d: 46.12% ± 3.87% vs 40.81% ± 3.07% vs 34.40% ± 3.21%; P < 0.05).
- Citation: Yin ML, Song HL, Yang Y, Zheng WP, Liu T, Shen ZY. Effect of CXCR3/HO-1 genes modified bone marrow mesenchymal stem cells on small bowel transplant rejection. World J Gastroenterol 2017; 23(22): 4016-4038
- URL: https://www.wjgnet.com/1007-9327/full/v23/i22/4016.htm
- DOI: https://dx.doi.org/10.3748/wjg.v23.i22.4016


