Copyright
©The Author(s) 2017.
World J Gastroenterol. Jun 14, 2017; 23(22): 4016-4038
Published online Jun 14, 2017. doi: 10.3748/wjg.v23.i22.4016
Published online Jun 14, 2017. doi: 10.3748/wjg.v23.i22.4016
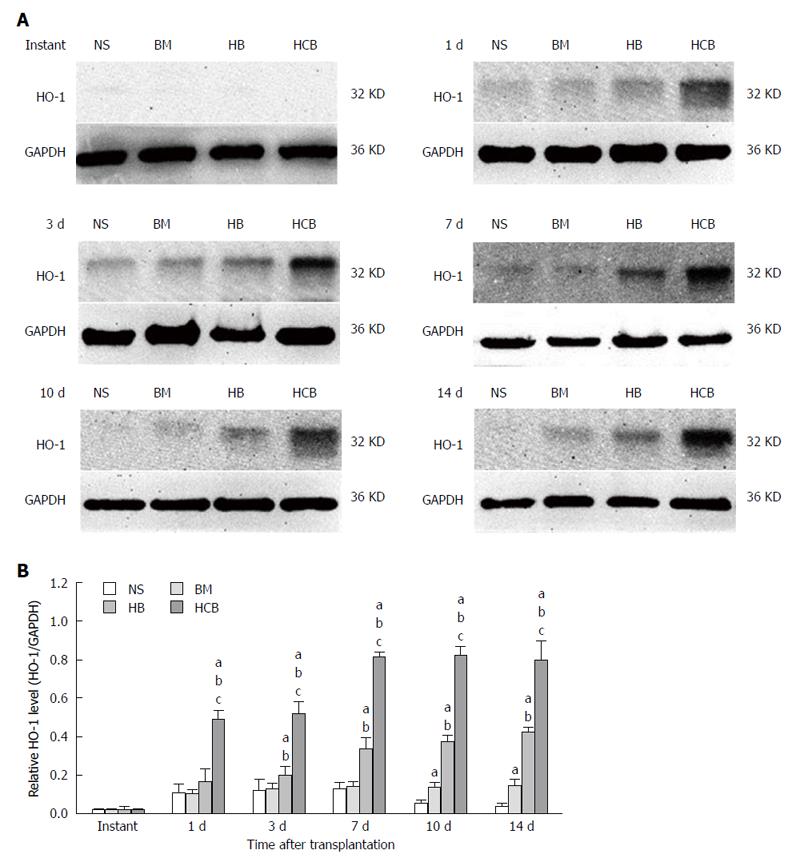
Figure 7 The expression of HO-1 protein in small intestine in different groups.
aP < 0.05 vs NS group, bP < 0.05 vs BM group, cP < 0.05 vs HB group. A: Expression of HO-1 protein in the NS group, BM group, HB group, and HCB group; B: Relative concentration of HO-1 protein in different groups. The expression of HO-1 protein in the transplanted small bowel was low at 0 h, and there was no significant difference between these four groups (P > 0.05). The relative concentration of HO-1 protein in the HCB group was the highest, followed by the HB group and BM group, and was lowest in the NS group at other time points (P < 0.05). HO-1: Heme oxygenase-1; NS: Normal saline.
- Citation: Yin ML, Song HL, Yang Y, Zheng WP, Liu T, Shen ZY. Effect of CXCR3/HO-1 genes modified bone marrow mesenchymal stem cells on small bowel transplant rejection. World J Gastroenterol 2017; 23(22): 4016-4038
- URL: https://www.wjgnet.com/1007-9327/full/v23/i22/4016.htm
- DOI: https://dx.doi.org/10.3748/wjg.v23.i22.4016


