Copyright
©The Author(s) 2017.
World J Gastroenterol. Jun 14, 2017; 23(22): 4016-4038
Published online Jun 14, 2017. doi: 10.3748/wjg.v23.i22.4016
Published online Jun 14, 2017. doi: 10.3748/wjg.v23.i22.4016
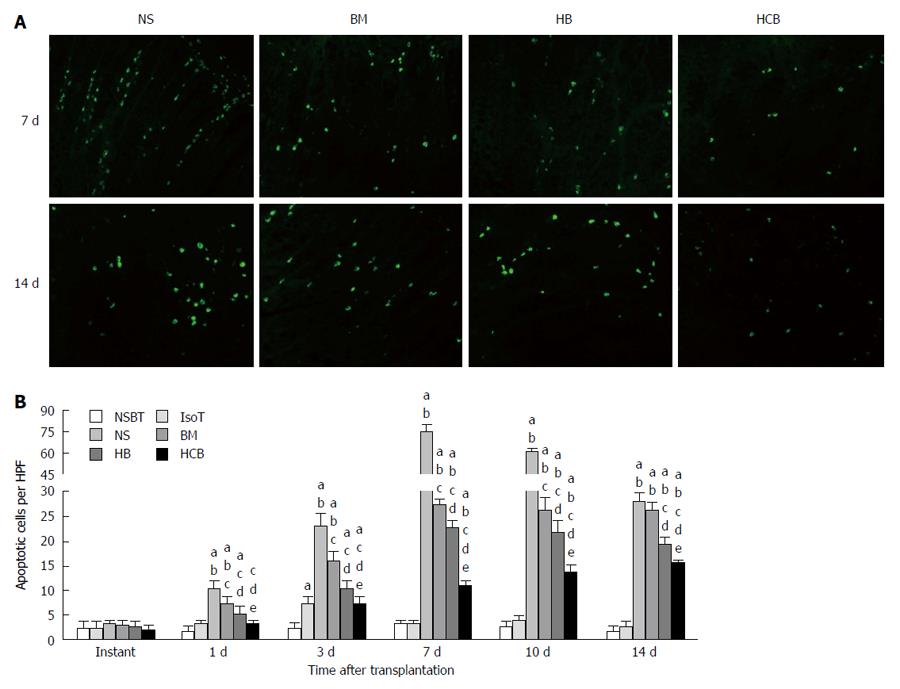
Figure 11 Apoptosis in the transplanted small bowel in different groups.
A: Fluorescent histochemistry images of apoptosis in the NS group, BM group, HB group, and HCB group at 7 d and 14 d (× 200); B: Comparison of apoptotic cell numbers in different groups. aP < 0.05 vs NSBT group, bP < 0.05 vs IsoT group, cP < 0.05 vs NS group, dP < 0.05 vs BM group, eP < 0.05 vs HB group. There was no significant difference in apoptosis between these six groups at 0 h (P > 0.05). The apoptotic cell number in the IsoT group increased at day 3 (7.20 ± 1.53/HPF), and nearly returned to the level of the NSBT group at day 7 (3.30 ± 0.57/HPF vs 3.20 ± 0.57/HPF). The apoptotic cell number in the NS group was the highest, and was significantly higher than those in the other five groups at all time points except immediately after transplantation (P < 0.05). The apoptotic cell number in the NS group increased significantly, reaching its maximum at day 7 (75.00 ± 5.20/HP), before decreasing (61.00 ± 2.65/HPF at day 10, 28.00 ± 1.73/HPF at day 14). The apoptotic cell number in the BM group was higher when compared with the HB group, and was higher in the HB group when compared with the HCB group (P < 0.05) simultaneously.
- Citation: Yin ML, Song HL, Yang Y, Zheng WP, Liu T, Shen ZY. Effect of CXCR3/HO-1 genes modified bone marrow mesenchymal stem cells on small bowel transplant rejection. World J Gastroenterol 2017; 23(22): 4016-4038
- URL: https://www.wjgnet.com/1007-9327/full/v23/i22/4016.htm
- DOI: https://dx.doi.org/10.3748/wjg.v23.i22.4016


