Copyright
©The Author(s) 2017.
World J Gastroenterol. Jun 14, 2017; 23(22): 4016-4038
Published online Jun 14, 2017. doi: 10.3748/wjg.v23.i22.4016
Published online Jun 14, 2017. doi: 10.3748/wjg.v23.i22.4016
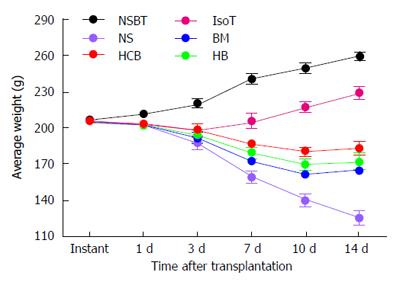
Figure 5 Average body weight of rats after small bowel transplantation.
The average body weight (BW) of rats in the NSBT group increased by 3.82 g/d. BW of rats in the IsoT group decreased slightly after transplantation, recovered to preoperative BW at day 7 (206.08 ± 3.87 vs 205.45 ± 2.10), and later increased by 3.32 g/d. BW of rats at day 1 showed no significant difference between the NS group, BM group, HB group, and HCB group (203.78 ± 3.01 g vs 202.87 ± 2.33 g vs 202.16 ± 2.14 g vs 203.76 ± 2.65 g, P > 0.05). Any two groups of the NS group, BM group, HB group, and HCB group showed significant differences in the average BW of rats at 3 d, 7 d, 10 d, and 14 d after transplantation, respectively (3 d: 188.34 ± 2.13 g vs 192.00 ± 3.39 g vs 194.21 ± 2.99 g vs 198.65 ± 2.02 g; 7 d: 160.02 ± 4.87 g vs 172.67 ± 2.17 g vs 179.35 ± 2.37 g vs 187.21 ± 3.28 g; 10 d: 140.25 ± 4.45 g vs 161.83 ± 3.01 g vs 170.05 ± 2.72 g vs 180.32 ± 3.85 g; 14 d: 125.74 ± 6.63 g vs 165.32 ± 2.89 g vs 172.23 ± 6.92 g vs 183.65 ± 5.44 g; P < 0.05). BW in the HCB group was the highest, followed by the HB group and BM group, and BW in the NS group was the lowest. The average BW of rats at day 3 showed no significant difference between the BM group and the HB group (P > 0.05).
- Citation: Yin ML, Song HL, Yang Y, Zheng WP, Liu T, Shen ZY. Effect of CXCR3/HO-1 genes modified bone marrow mesenchymal stem cells on small bowel transplant rejection. World J Gastroenterol 2017; 23(22): 4016-4038
- URL: https://www.wjgnet.com/1007-9327/full/v23/i22/4016.htm
- DOI: https://dx.doi.org/10.3748/wjg.v23.i22.4016


