Copyright
©The Author(s) 2017.
World J Gastroenterol. Jun 14, 2017; 23(22): 4016-4038
Published online Jun 14, 2017. doi: 10.3748/wjg.v23.i22.4016
Published online Jun 14, 2017. doi: 10.3748/wjg.v23.i22.4016
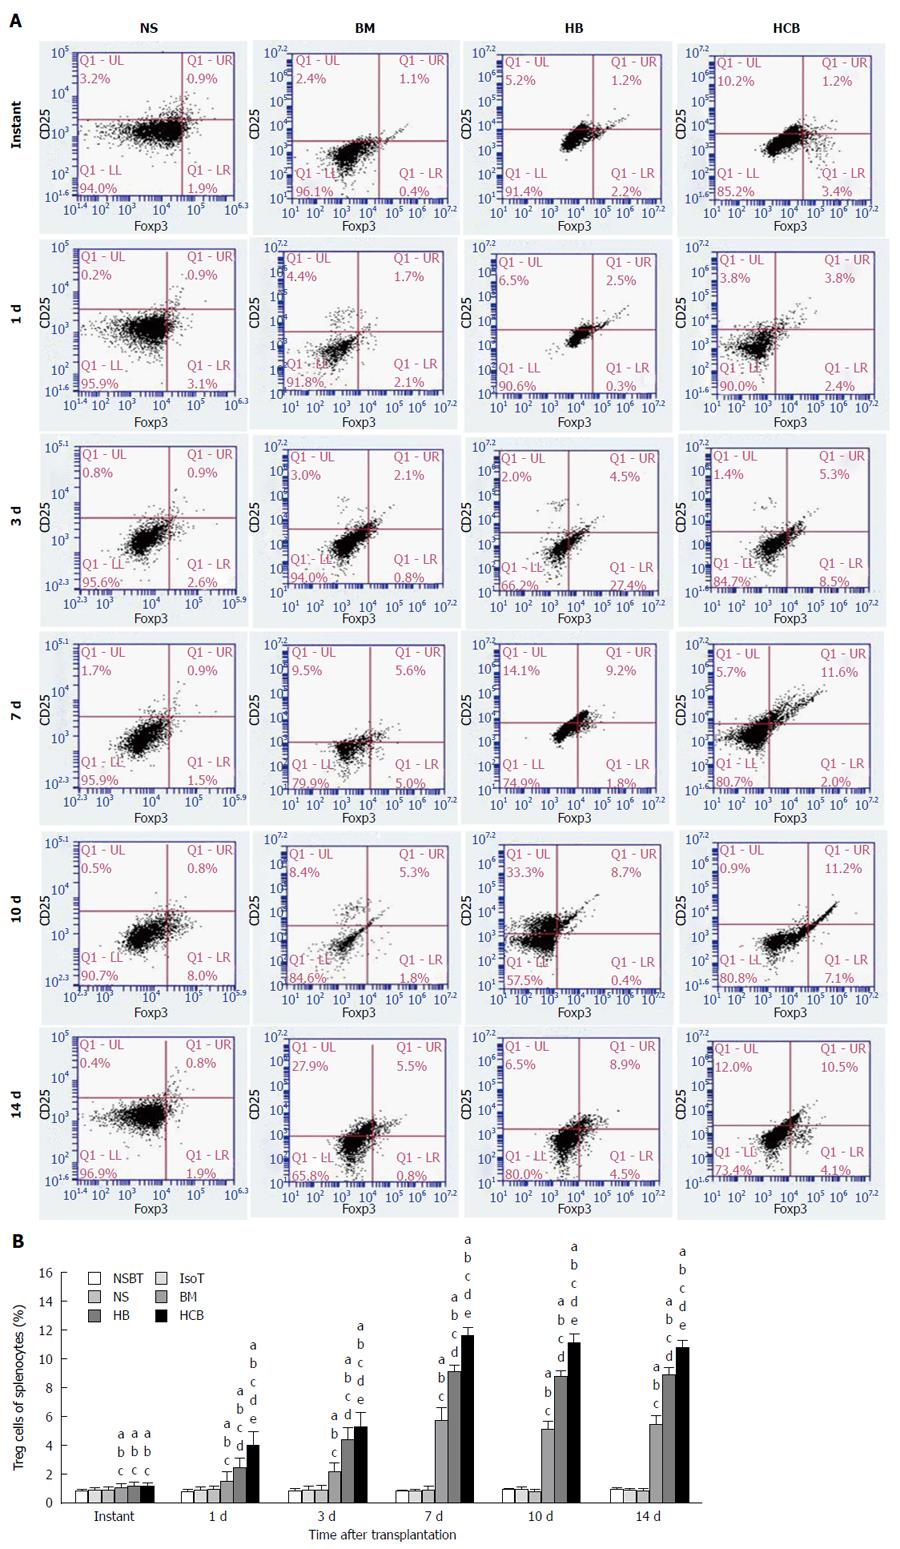
Figure 13 Ratio of regulatory T cells in different groups.
A: Flow cytometry of regulatory T cells in the NS group, BM group, HB group, and HCB group; B: Column chart of the ratio of regulatory T cells in different groups. aP < 0.05 vs NSBT group, bP < 0.05 vs IsoT group, cP < 0.05 vs NS group, dP < 0.05 vs BM group, eP < 0.05 vs HB group. The ratio of regulatory T cells in the BM group (1.09% ± 0.28%), HB group (1.20% ± 0.29%), and HCB group (1.18% ± 0.25%) was comparable, and these ratios were all significantly higher than those in the NBST group (0.86% ± 0.12%), IsoT group (0.90% ± 0.16%), and NS group (0.88% ± 0.24%; P < 0.05) immediately after transplantation. The ratio of regulatory T cells in the NBST group, IsoT group, and NS group showed no significant change over time (P > 0.05). The ratio of regulatory T cells in the HCB group was higher than that in the HB group and BM group, and the HB group was higher than the BM group at the same time points (1 d: 3.98% ± 0.930% vs 2.49% ± 0.65% vs 1.55% ± 0.62%; 3 d: 5.29% ± 1.01% vs 4.38% ± 0.82% vs 2.19% ± 0.59%; 7 d: 11.60% ± 0.54% vs 9.10% ± 0.48% vs 5.70 ± 0.89%; 10 d: 11.14% ± 0.60% vs 8.79% ± 0.40% vs 5.13% ± 0.55%; 14 d: 10.74% ± 0.53% vs 8.93% ± 0.44% vs 5.46% ± 0.61%; P < 0.05).
- Citation: Yin ML, Song HL, Yang Y, Zheng WP, Liu T, Shen ZY. Effect of CXCR3/HO-1 genes modified bone marrow mesenchymal stem cells on small bowel transplant rejection. World J Gastroenterol 2017; 23(22): 4016-4038
- URL: https://www.wjgnet.com/1007-9327/full/v23/i22/4016.htm
- DOI: https://dx.doi.org/10.3748/wjg.v23.i22.4016


