Copyright
©The Author(s) 2017.
World J Gastroenterol. Jun 14, 2017; 23(22): 4016-4038
Published online Jun 14, 2017. doi: 10.3748/wjg.v23.i22.4016
Published online Jun 14, 2017. doi: 10.3748/wjg.v23.i22.4016
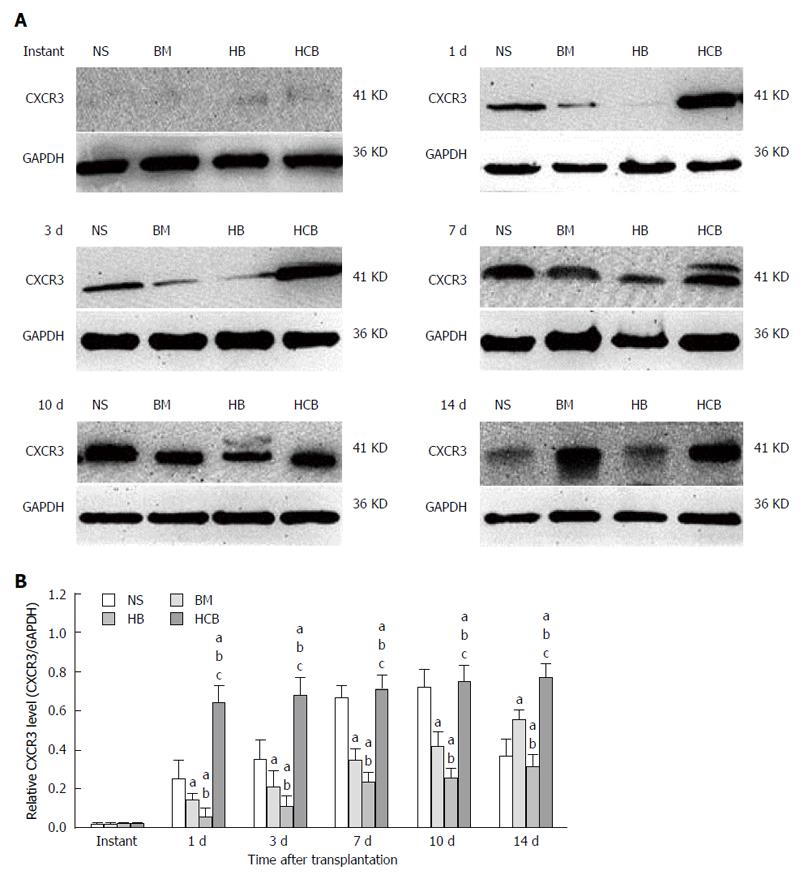
Figure 8 Expression of CXCR3 protein in small intestine in different groups.
aP < 0.05 vs NS group, bP < 0.05 vs BM group, cP < 0.05 vs HB group. A: Expression of CXCR3 protein in the NS group, BM group, HB group, and HCB group; B: Relative concentration of CXCR3 protein in different groups. The expression of CXCR3 protein in the transplanted small bowel was low immediately after transplantation, and there was no significant difference between these 4 groups (P > 0.05). The relative concentration of CXCR3 protein in the HCB group was the highest, followed by the NS group and BM group, while it was lowest in the HB group at 1 d, 3 d, 7 d, and 10 d. The relative concentration of CXCR3 protein in the BM group was higher than that in the NS group at day 14, which may be due to a false increase caused by mass necrosis of transplanted small bowel in the NS group.
- Citation: Yin ML, Song HL, Yang Y, Zheng WP, Liu T, Shen ZY. Effect of CXCR3/HO-1 genes modified bone marrow mesenchymal stem cells on small bowel transplant rejection. World J Gastroenterol 2017; 23(22): 4016-4038
- URL: https://www.wjgnet.com/1007-9327/full/v23/i22/4016.htm
- DOI: https://dx.doi.org/10.3748/wjg.v23.i22.4016


