Copyright
©The Author(s) 2025.
World J Gastrointest Oncol. Aug 15, 2025; 17(8): 105006
Published online Aug 15, 2025. doi: 10.4251/wjgo.v17.i8.105006
Published online Aug 15, 2025. doi: 10.4251/wjgo.v17.i8.105006
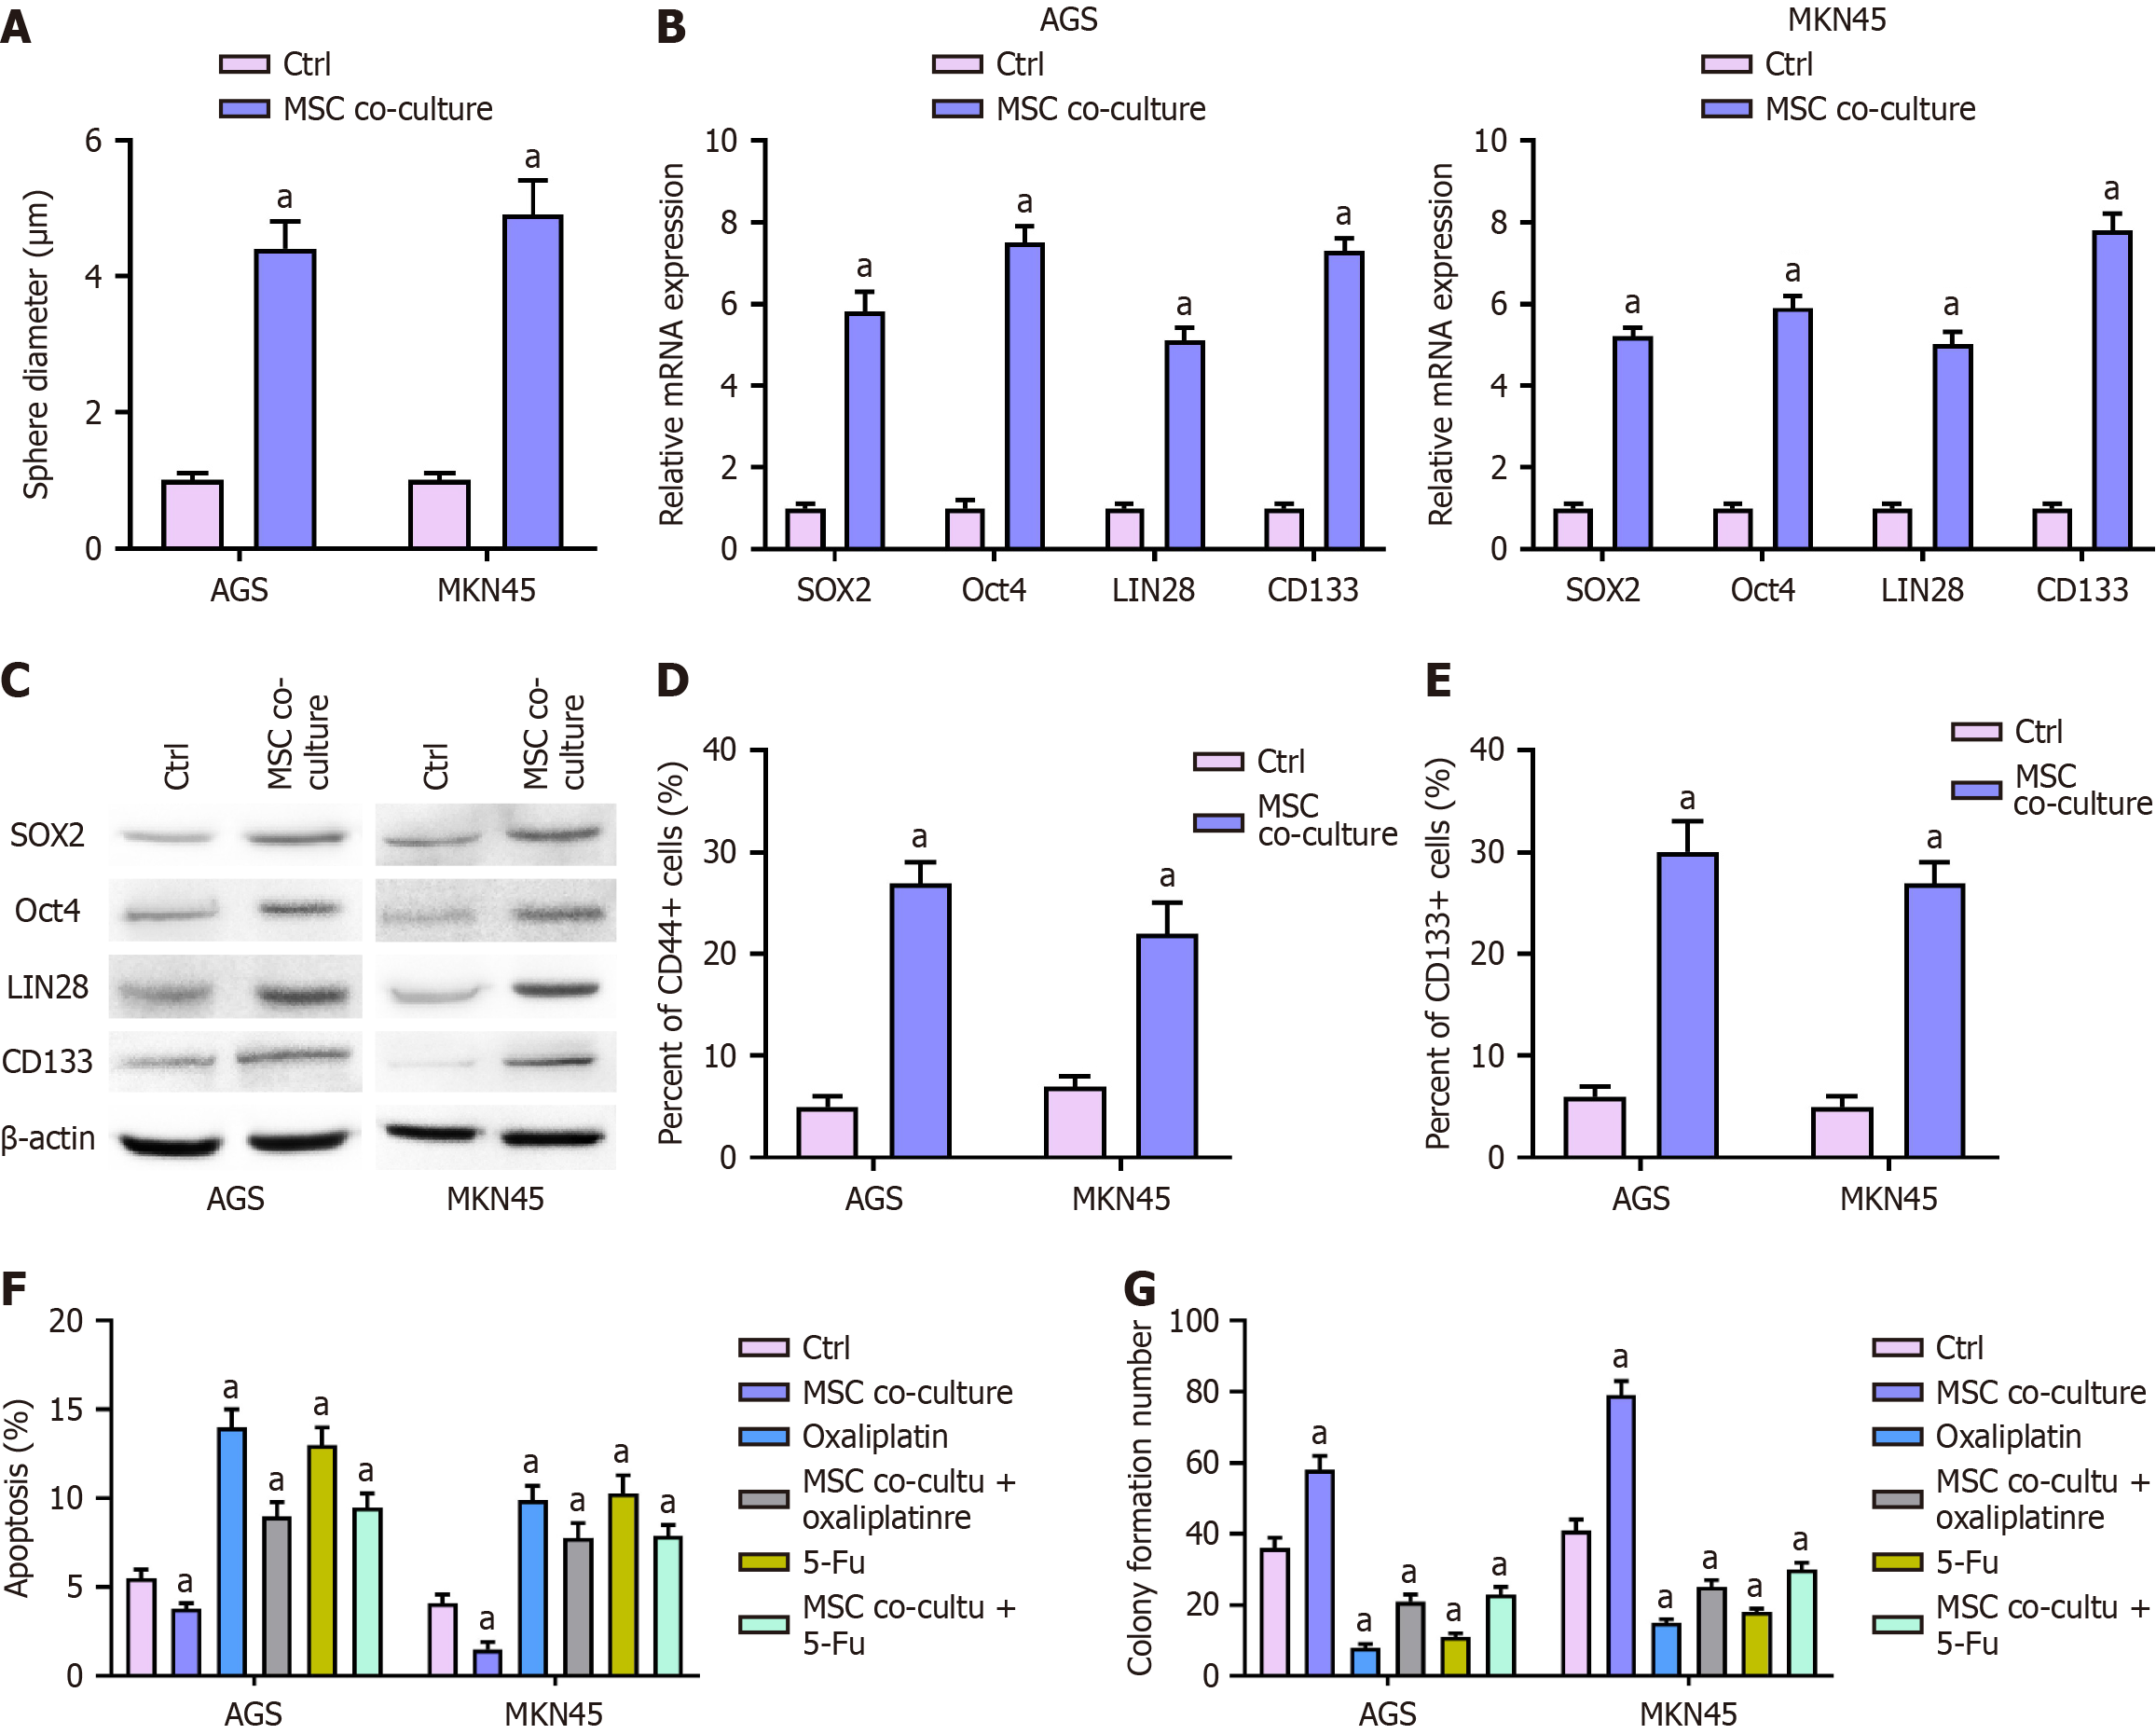
Figure 1 Mesenchymal stromal cells enhances stemness and chemoresistance of gastric cancer cells.
A-E: The MKN45 and AGS cells were co-cultured with mesenchymal stromal cells (MSCs); The stemness was analyzed using sphere formation assay (A); The mRNA expression of SOX2, Oct4, LIN28, and CD133 was measured by qPCR (B); The levels of SOX2, Oct4, LIN28, and CD133 was detected by Western blot analysis (C); The CD44+ and CD133+ cells were identified by flow cytometry analysis (D and E); F and G: The MKN45 and AGS cells were co-cultured with MSCs and treated with oxaliplatin or 5-Fu; The cell apoptosis was determined by flow cytometry analysis (F); The cell proliferation was examined by colony formation assay (G). aP < 0.01; MSC: Mesenchymal stromal cell.
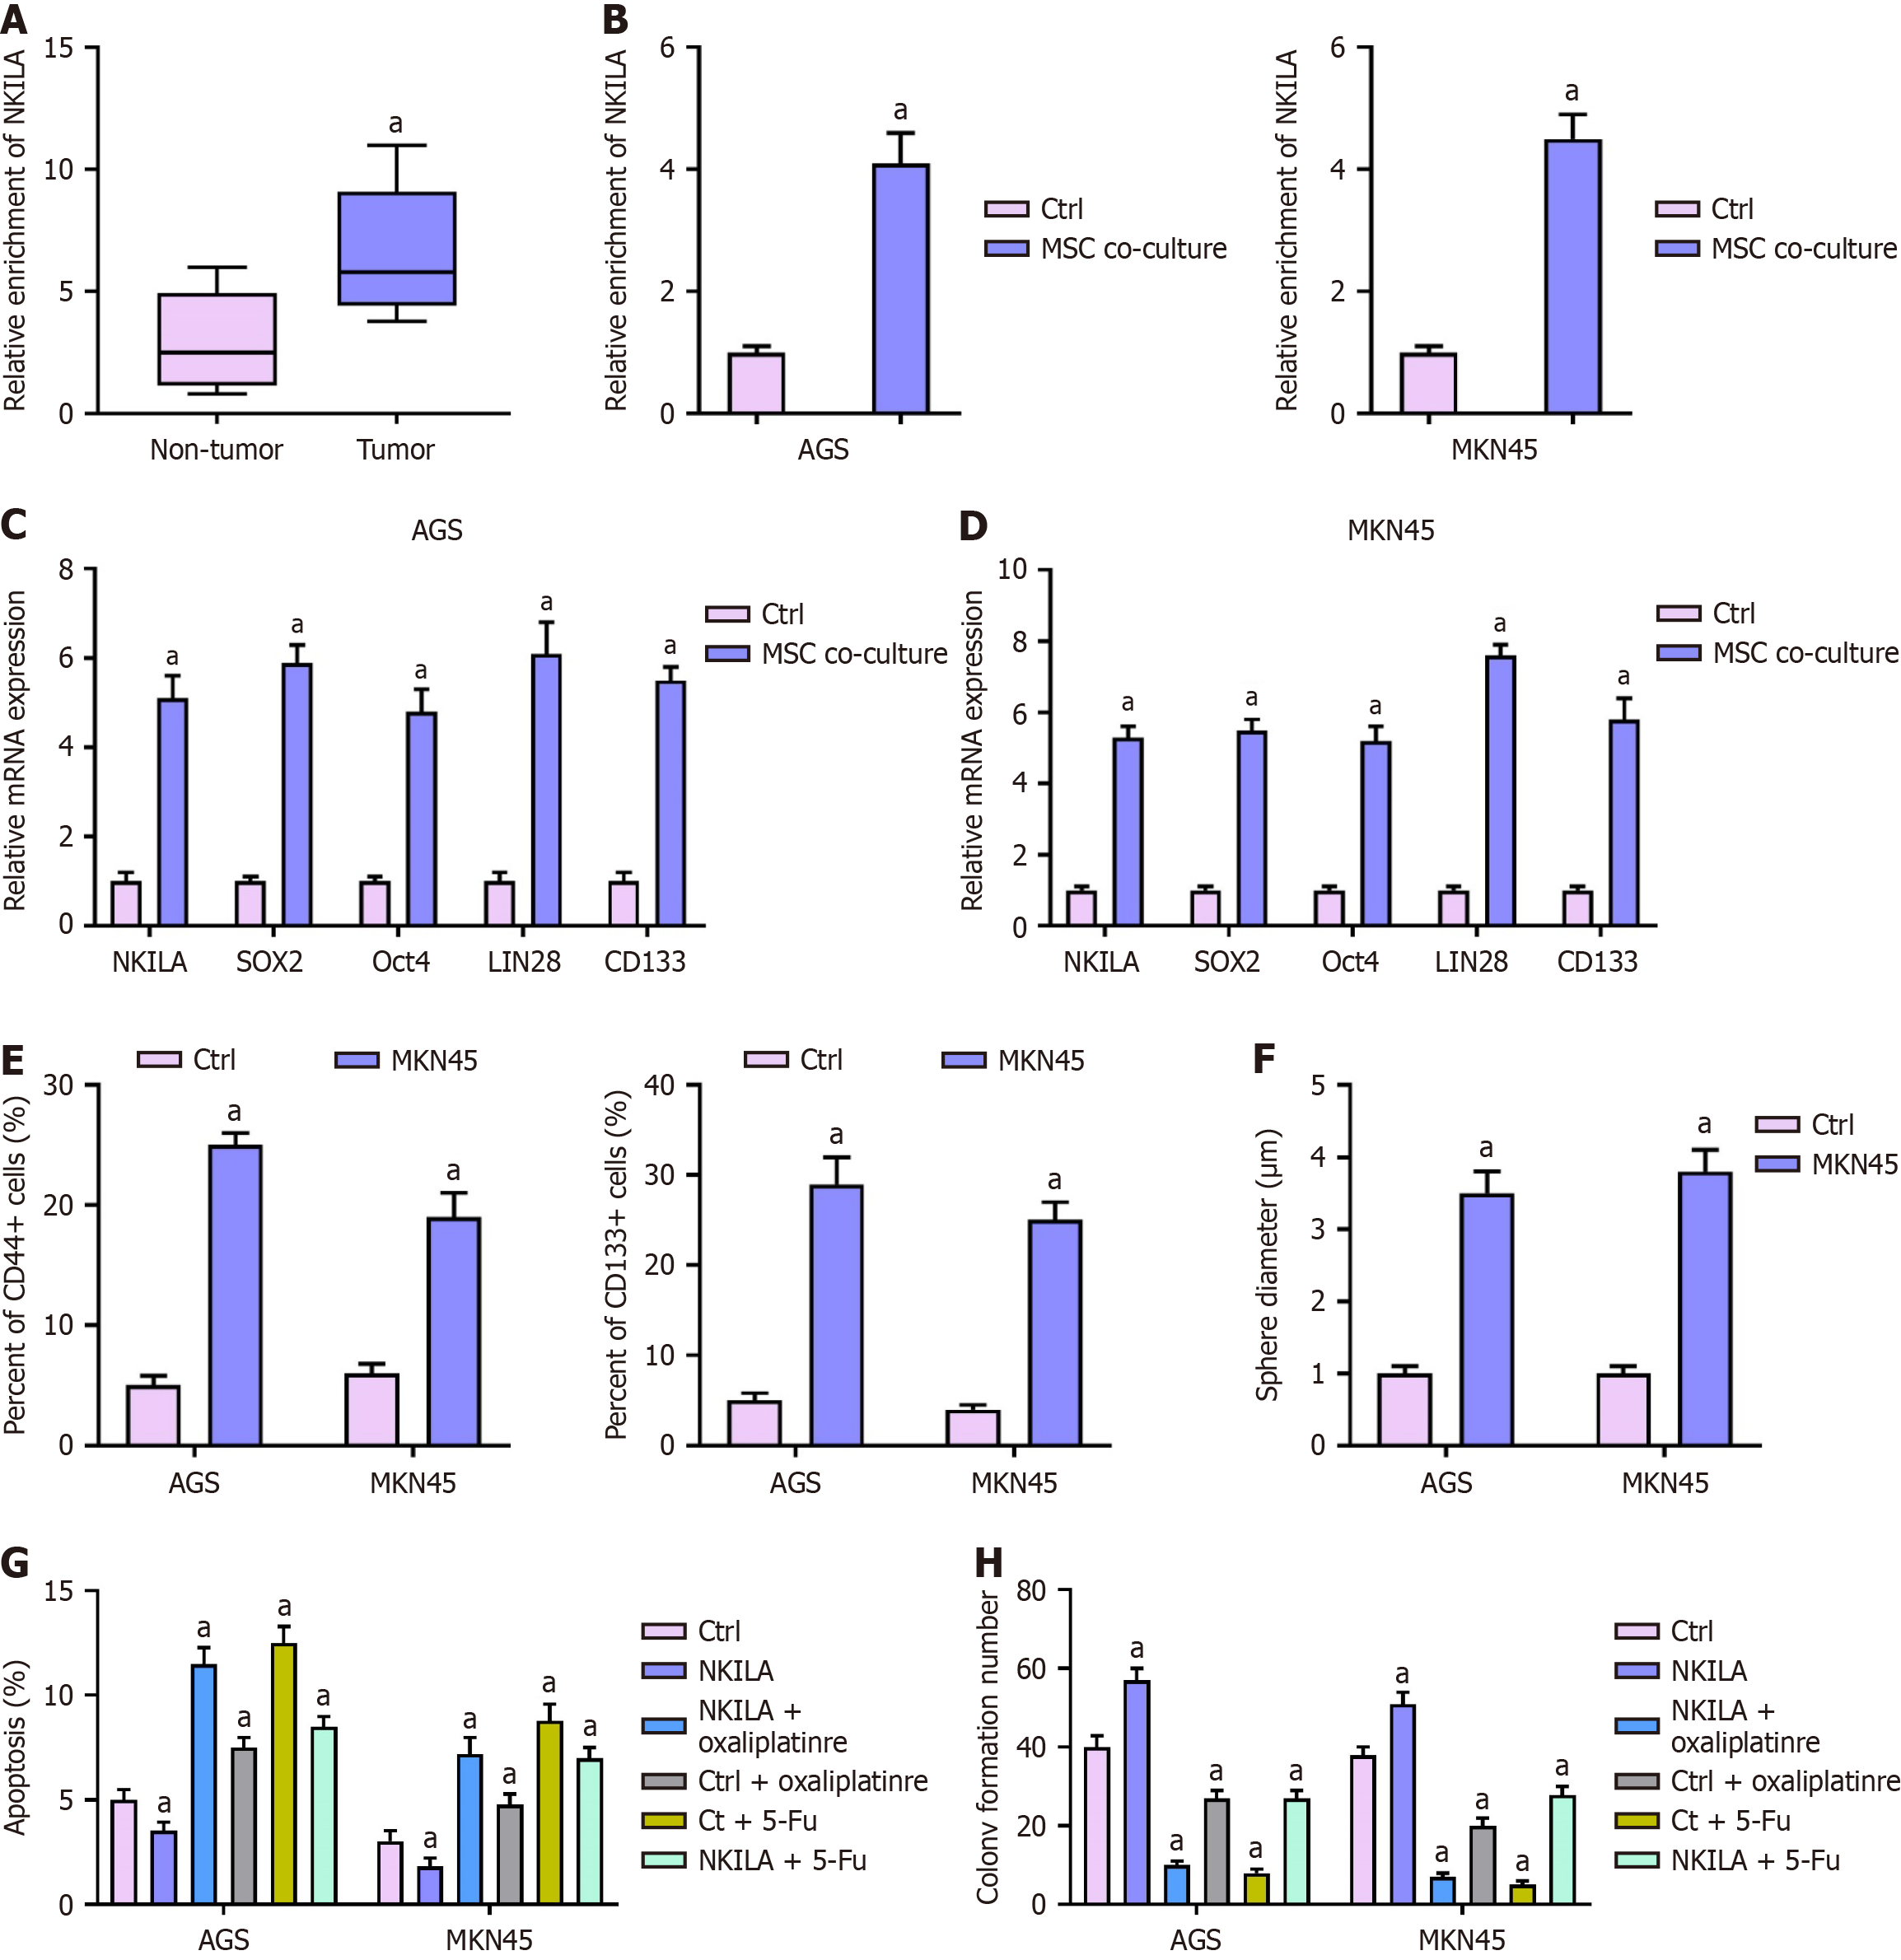
Figure 2 Mesenchymal stromal cells-derived long non-coding RNAs NKILA promotes stemness and chemoresistance of gastric cancer cells.
A: The expression of NKILA was detected by qPCR in clinical gastric cancer tissue and non-tumor tissues; B: The expression of NKILA was determined by qPCR inMKN45 and AGS cells co-cultured with mesenchymal stromal cells; C-F: The MKN45 and AGS cells were transfected with NKILA overexpressing plasmid; The mRNA expression of SOX2, Oct4, LIN28, and CD133 was measured by qPCR (C and D); The CD44+ and CD133+ cells were identified by flow cytometry analysis (E); The stemness was analyzed using sphere formation assay (F); G and H: The MKN45 and AGS cells were transfected with NKILA overexpressing plasmid and treated with oxaliplatin or 5-Fu; The cell apoptosis was determined by flow cytometry analysis (G); The cell proliferation was examined by colony formation assay (H). aP < 0.01; MSC: Mesenchymal stromal cell.
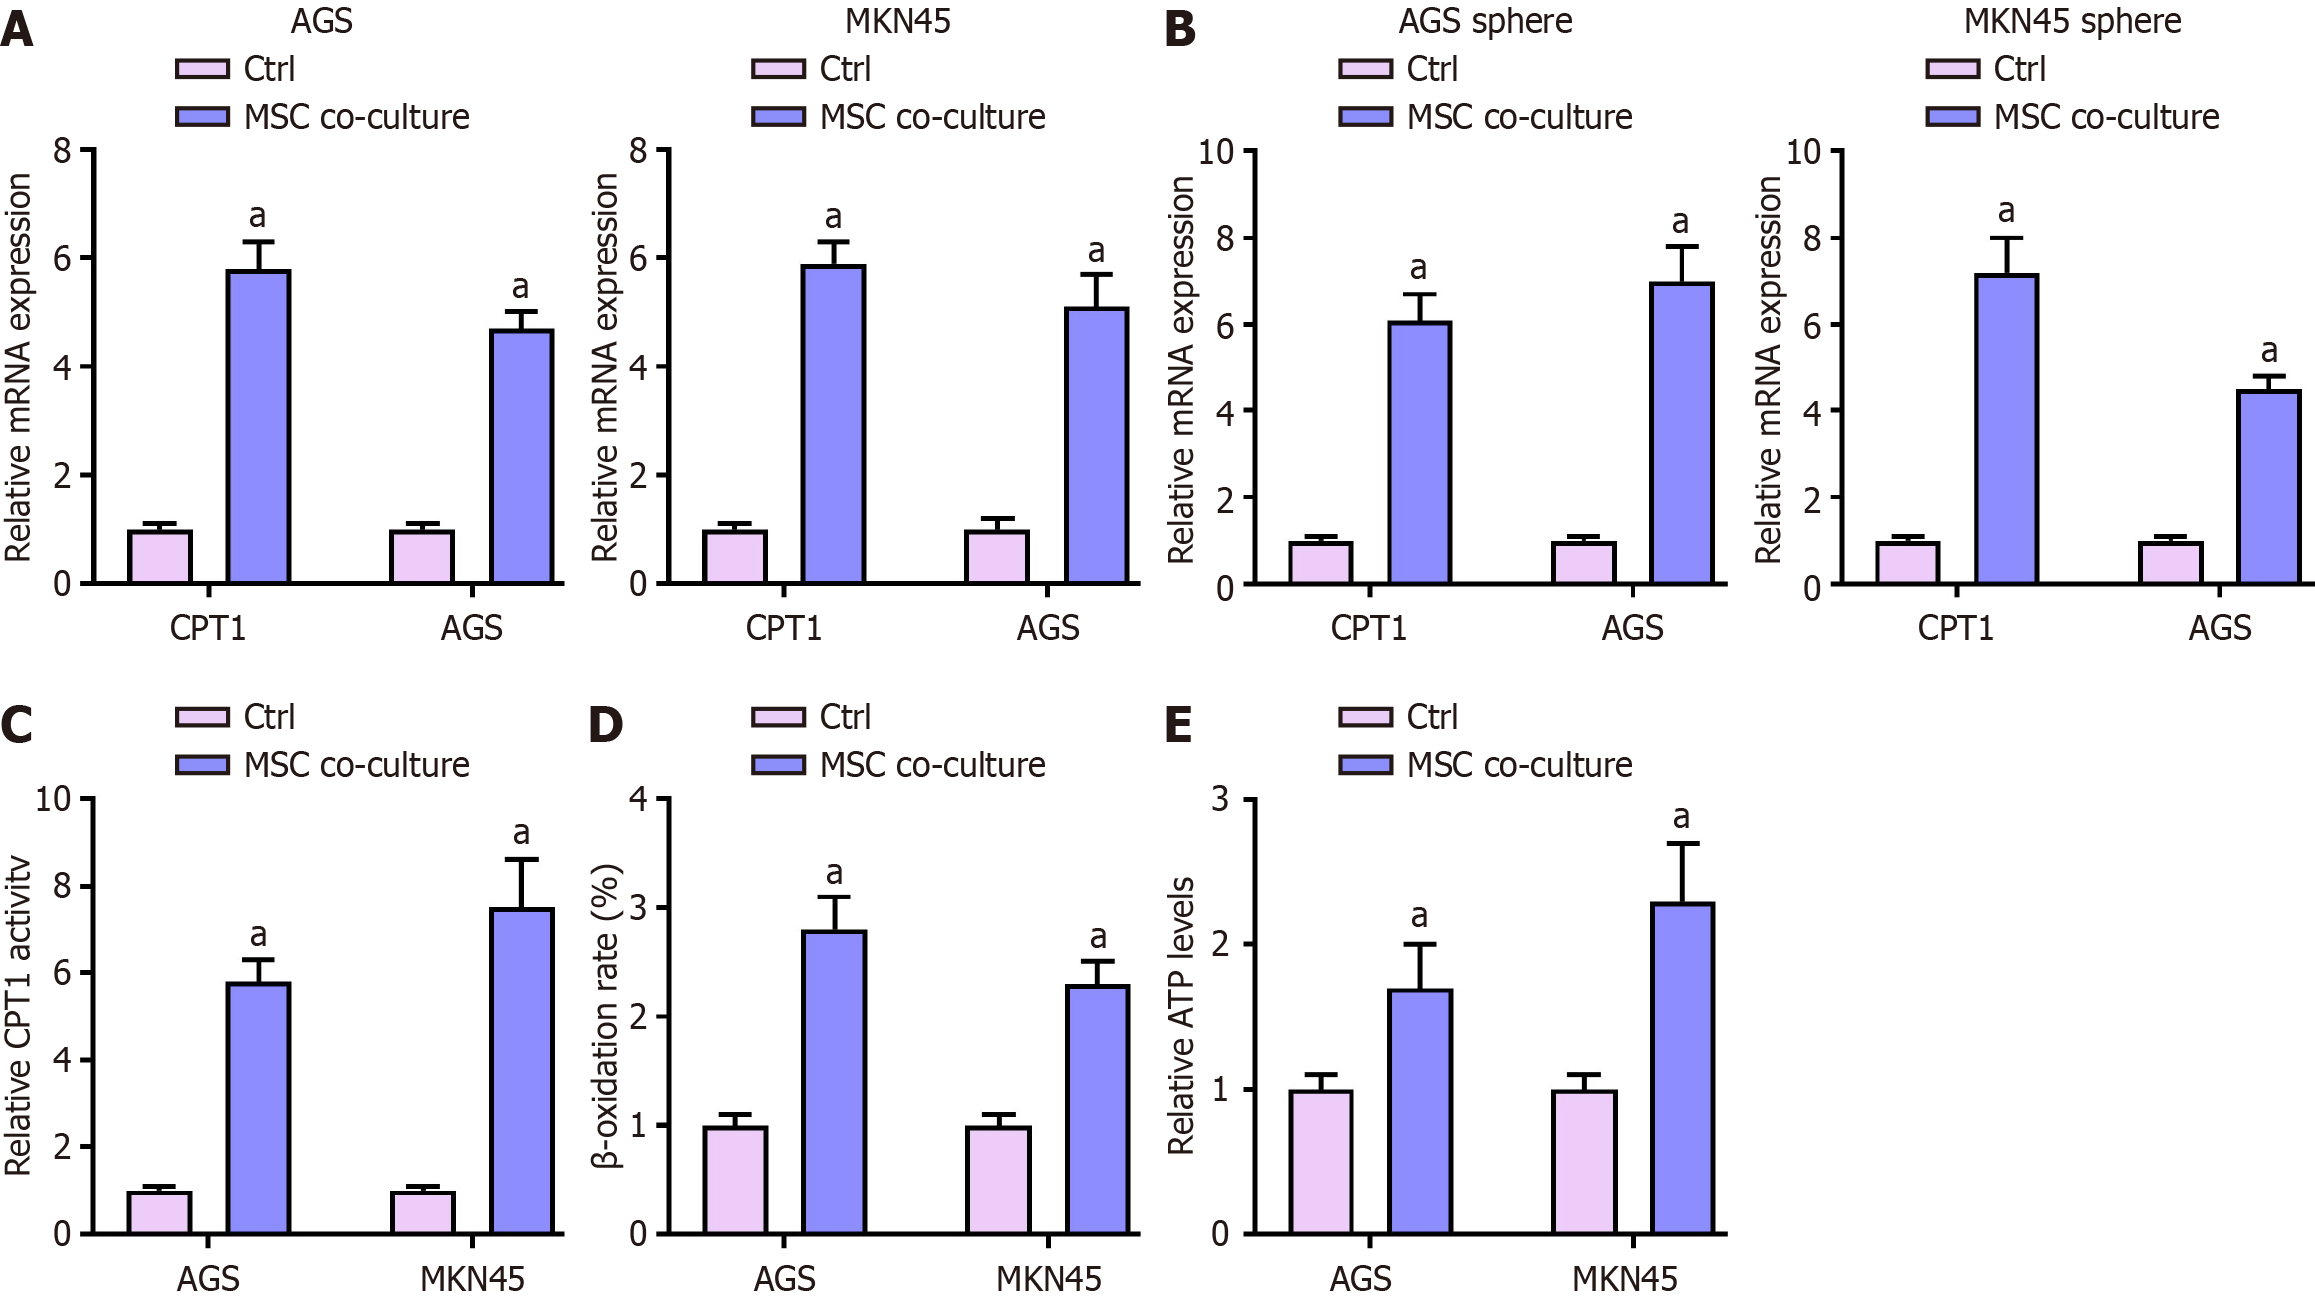
Figure 3 Mesenchymal stromal cells induces fatty acid oxidation in gastric cancer cells.
The MKN45 and AGS cells were co-cultured with mesenchymal stromal cells. A: The expression of CPT1 and ACS was measured by qPCR in MKN45 and AGS cells; B: The expression of CPT1 and ACS was measured by qPCR in MKN45 and AGS sphere; C: The CPT1 activity was detected in the cells; D: The β-oxidation was analyzed in the cells; E: The relative ATP levels was determined in the cells. aP < 0.01; MSC: Mesenchymal stromal cell.
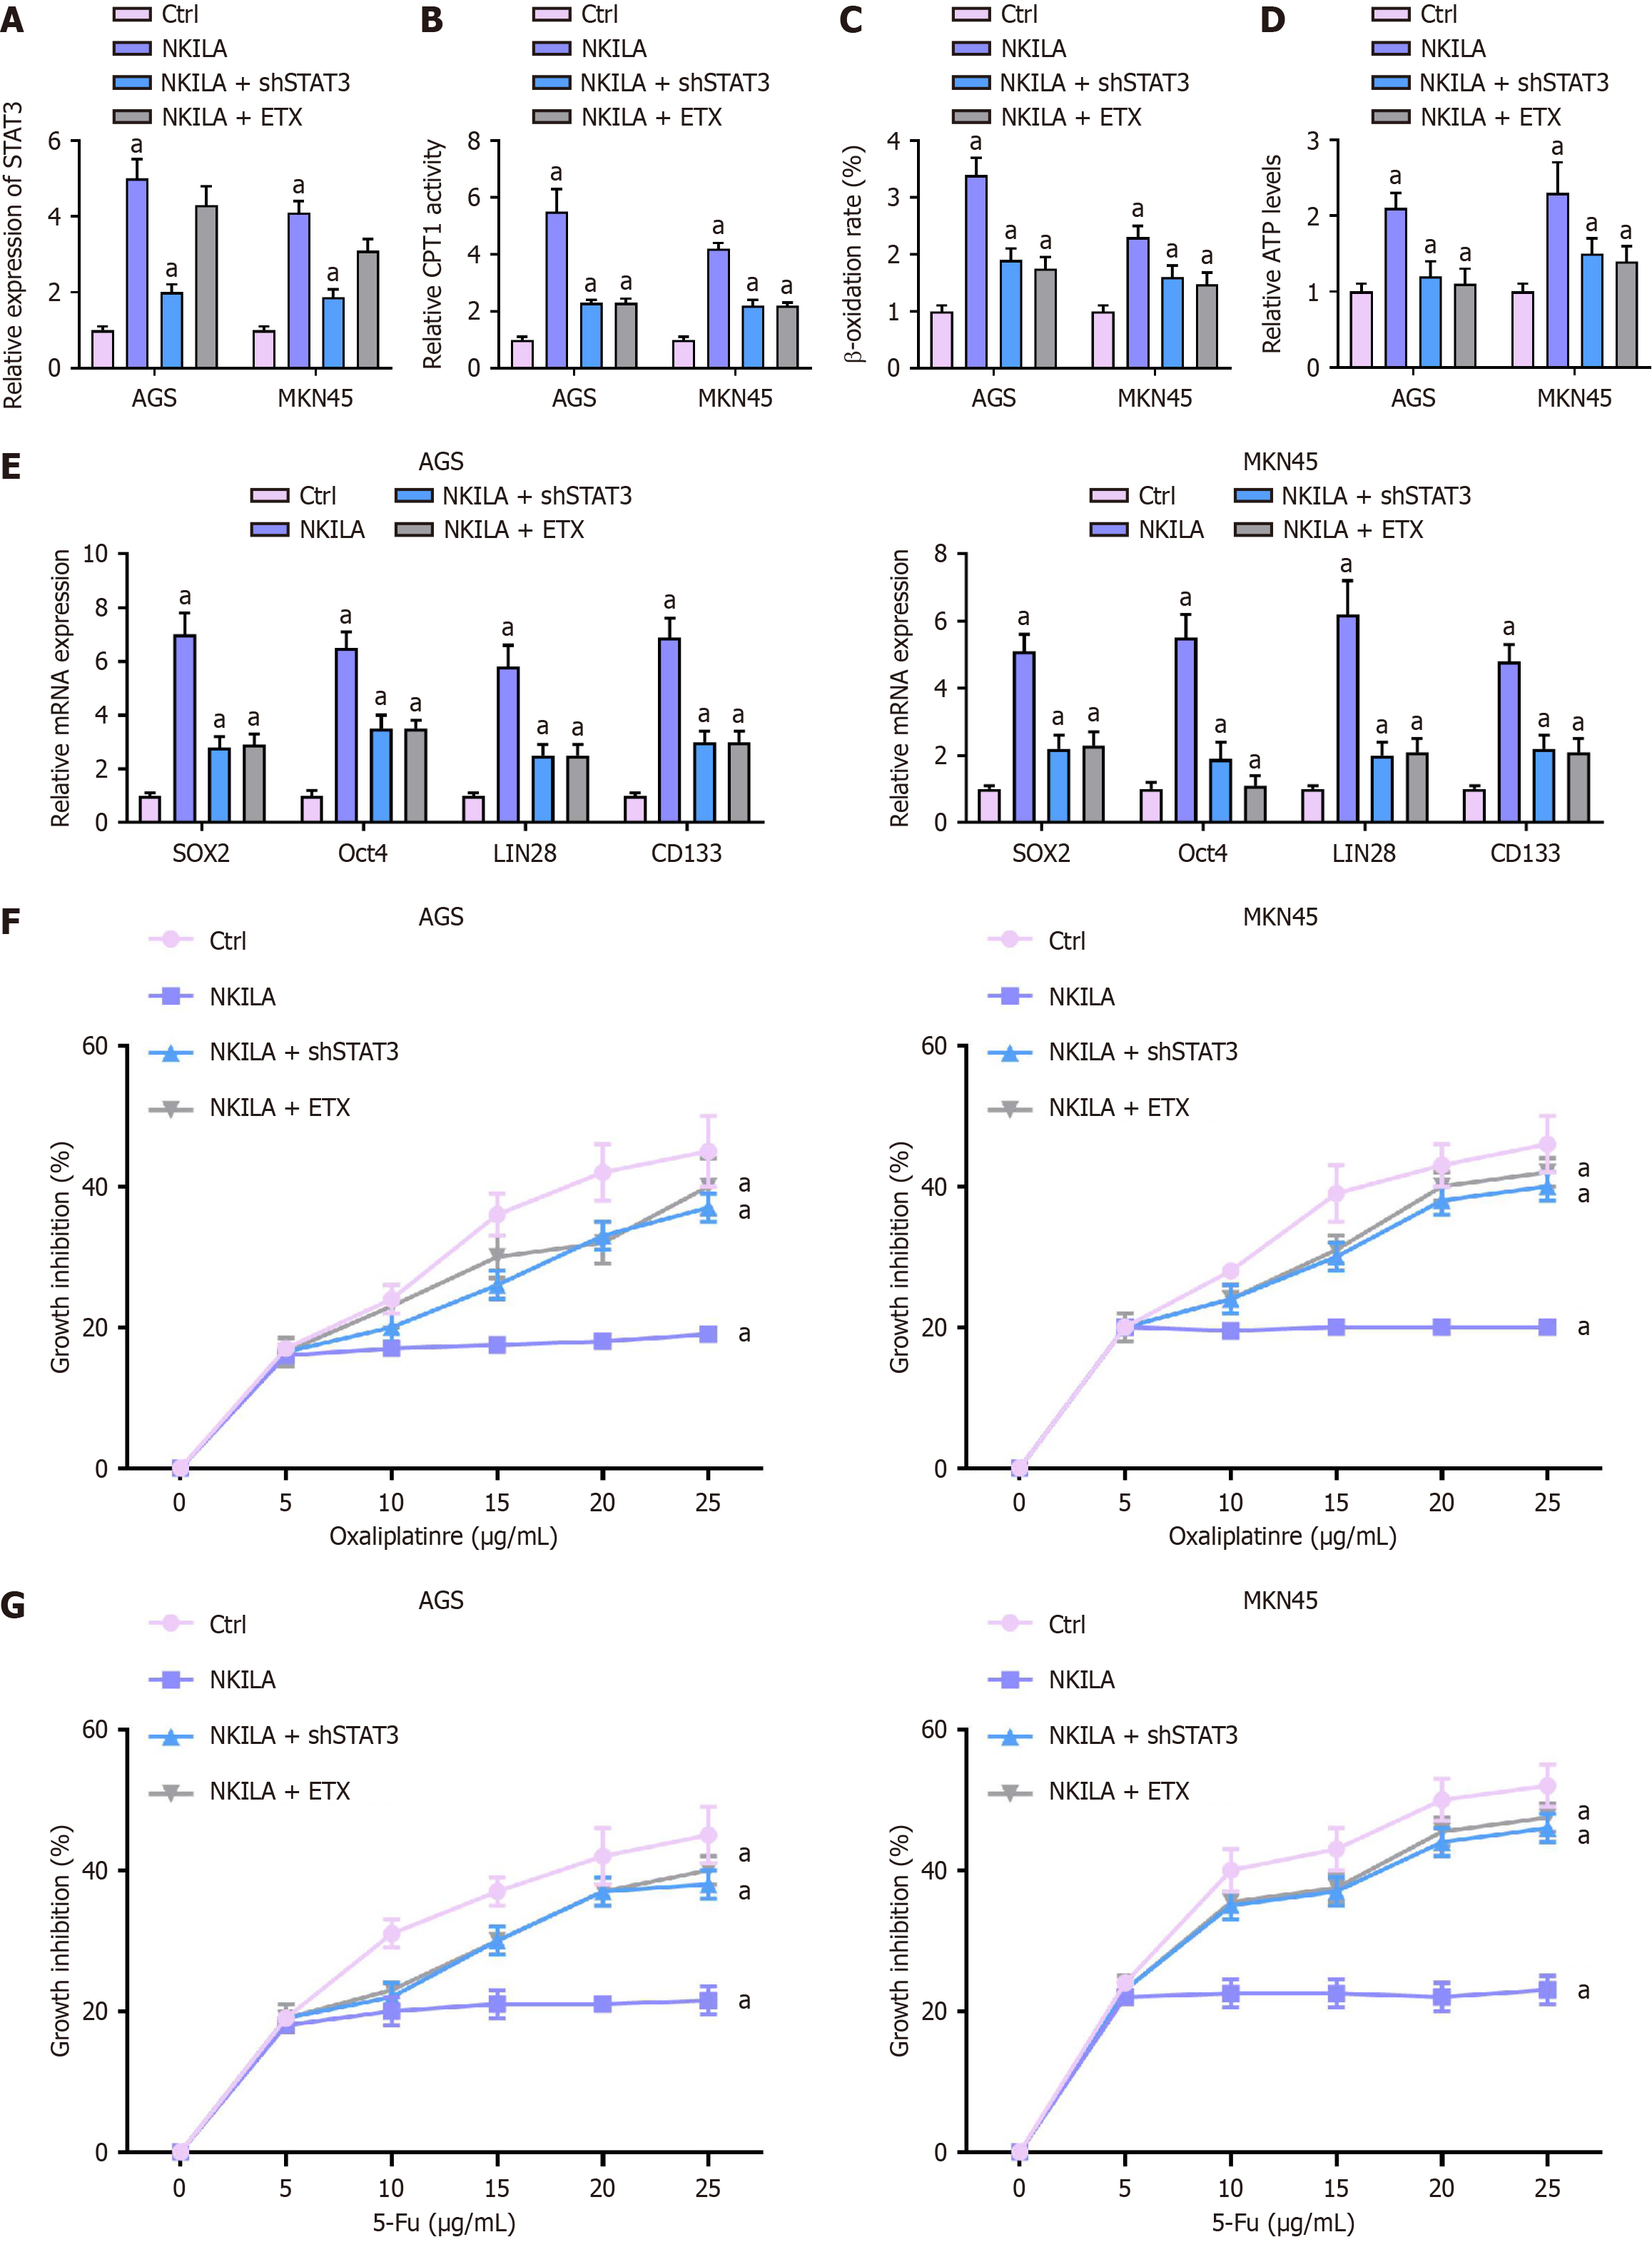
Figure 4 NKILA promotes fatty acid oxidation of gastric cancer cells by STAT3.
The MKN45 and AGS cells were transfected NKILA and co-treated with STAT3 shRNA of ETX. A: The expression of STAT3 was measured by qPCR; B: The CPT1 activity was detected in the cells; C: The β-oxidation was analyzed in the cells; D: The relative ATP levels was determined in the cells; E: The mRNA expression of SOX2, Oct4, LIN28, and CD133 was measured by qPCR; F and G: The chemoresistance of oxaliplatin or 5-Fu was detected by CCK-8. aP < 0.01.
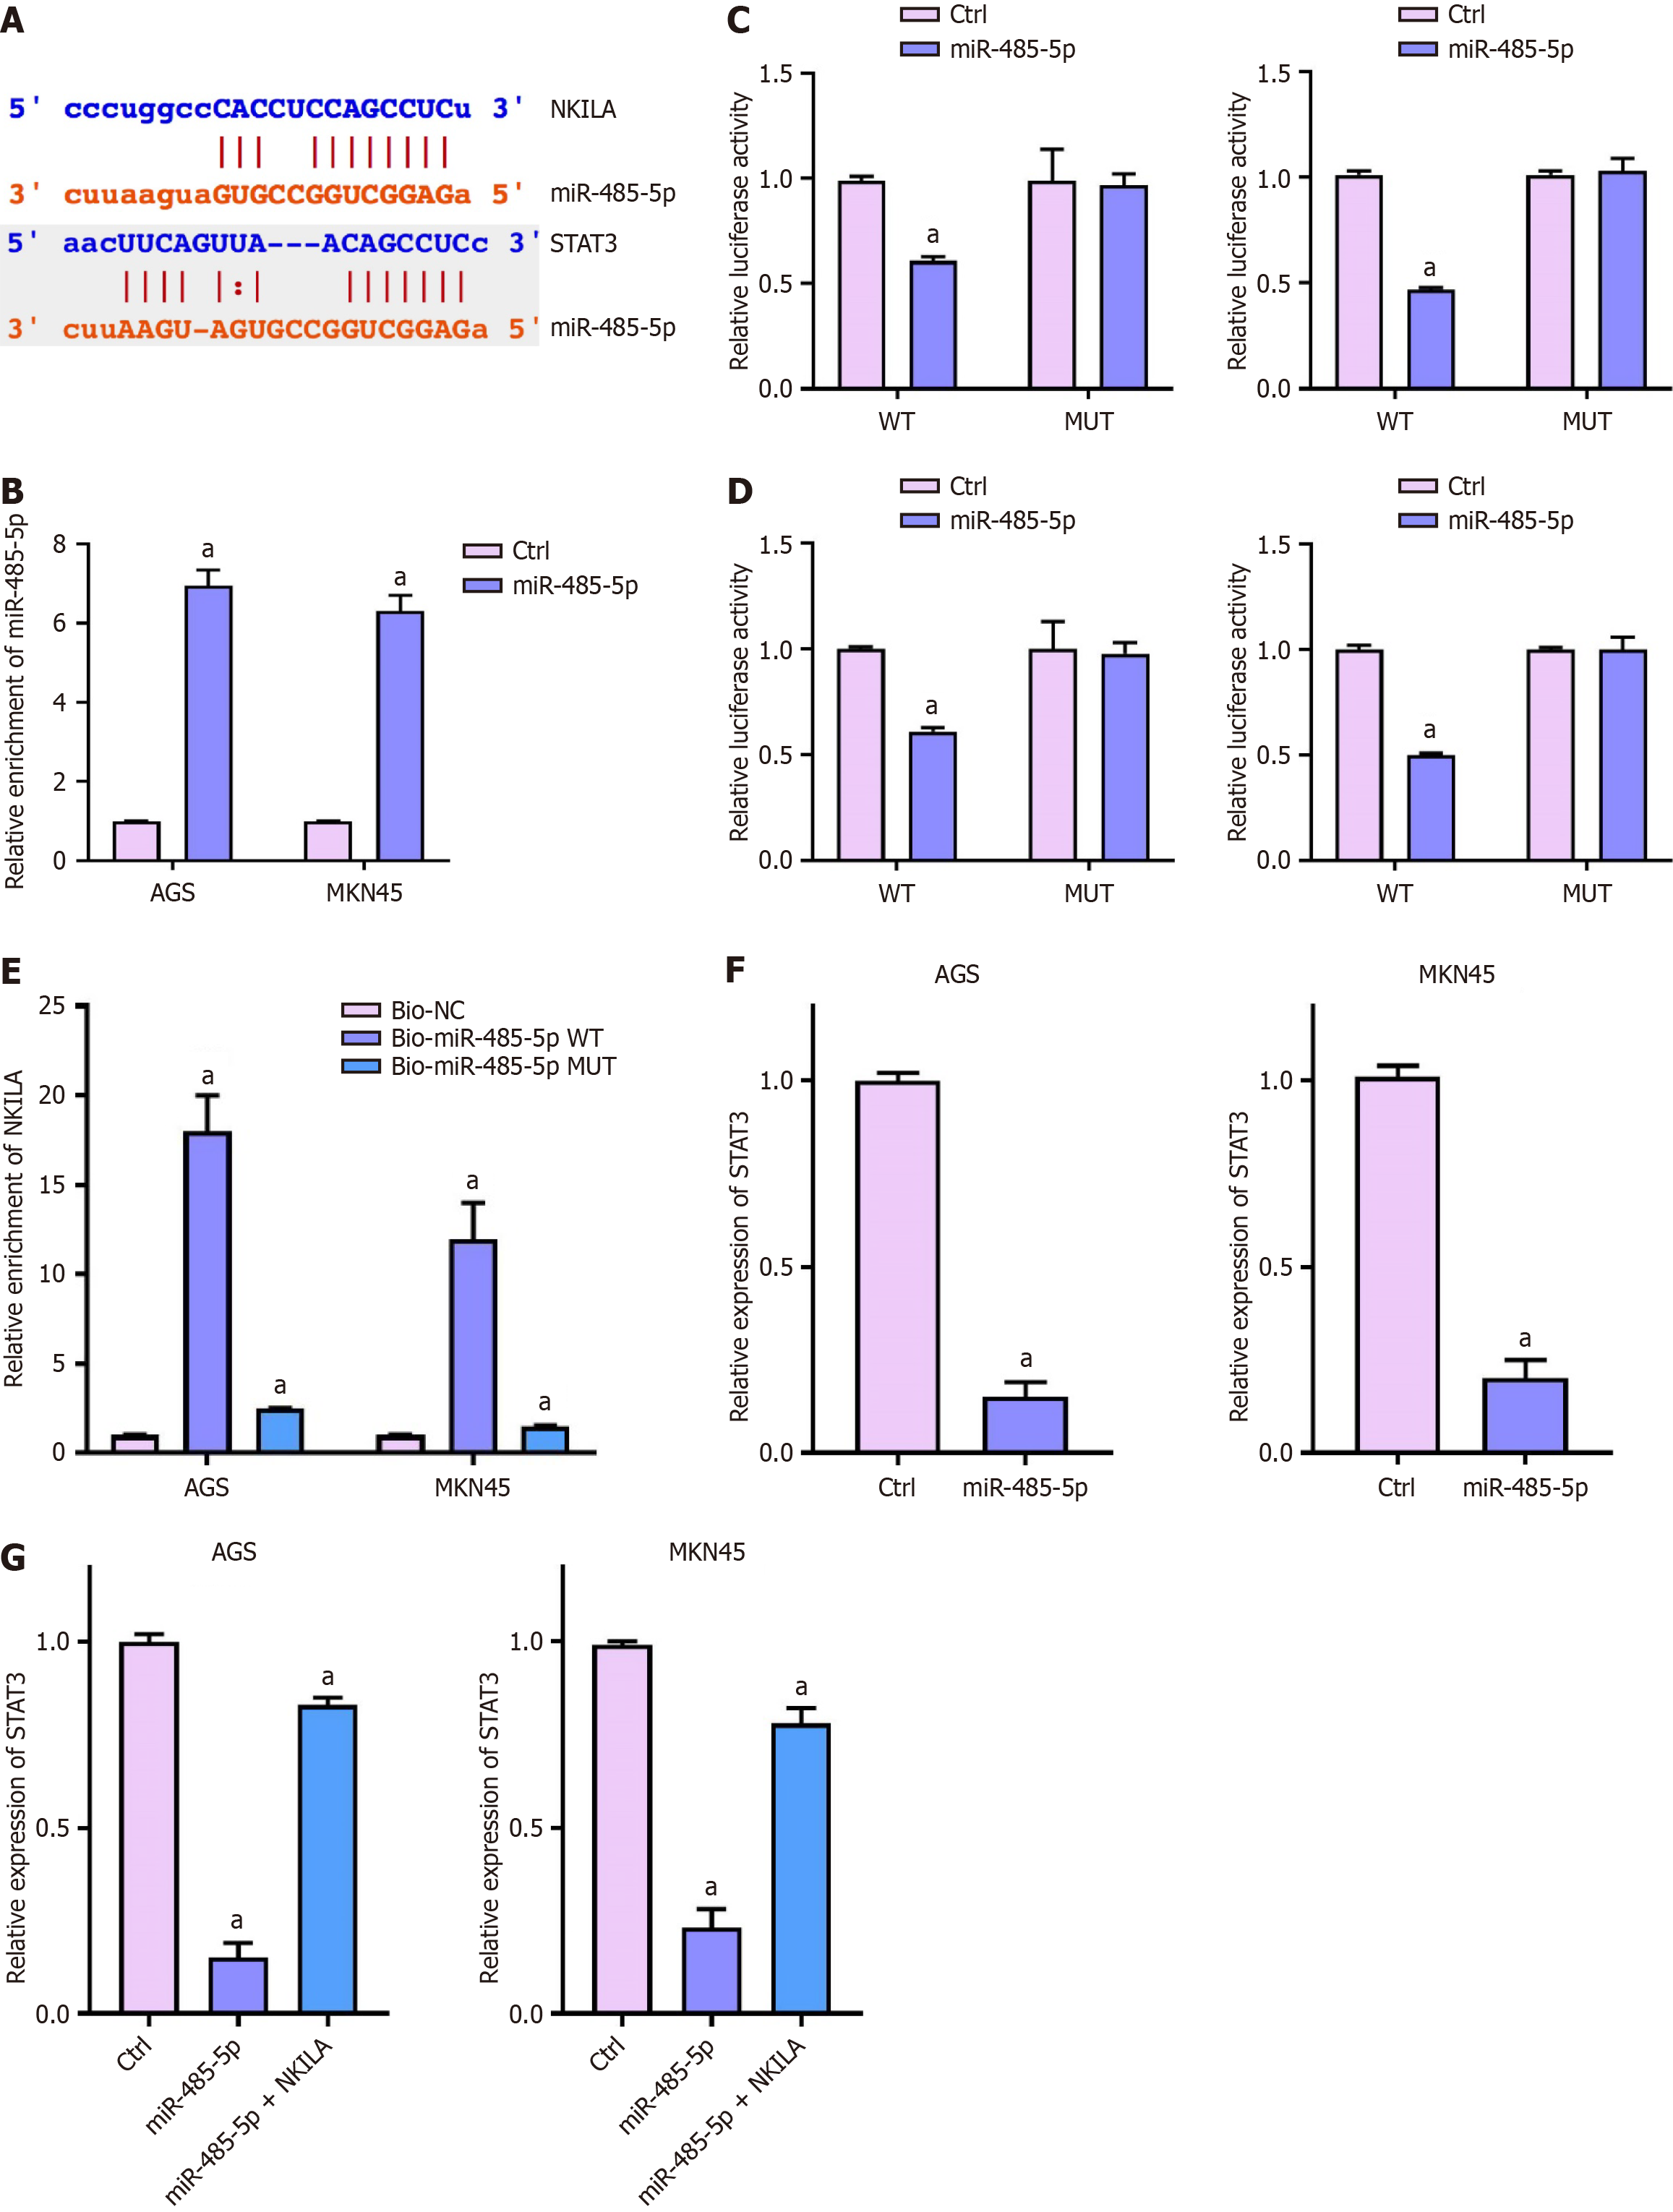
Figure 5 NKILA enhances STAT3 expression by targeting miR-485-5p in gastric cancer cells.
A: The interaction site of miR-485-5p between NKILA and STAT3; B and C: The MKN45 and AGS cells were transfected miR-485-5p mimic. The expression of miR-485-5p was measured by qPCR (B). The luciferase activity of NKILA was analyzed by Luciferase reporter gene assay (C); D: The direct interaction of miR-485-5p and NKILA was analyzed by RNA pull down; E: The luciferase activity of STAT3 3'UTR was analyzed by Luciferase reporter gene assay; F: The expression of STAT3 was measured by qPCR in MKN45 and AGS cells were transfected miR-485-5p mimic; G: The expression of STAT3 was measured by qPCR in MKN45 and AGS cells were transfected miR-485-5p mimic and NKILA overexpression plasmid. aP < 0.01.
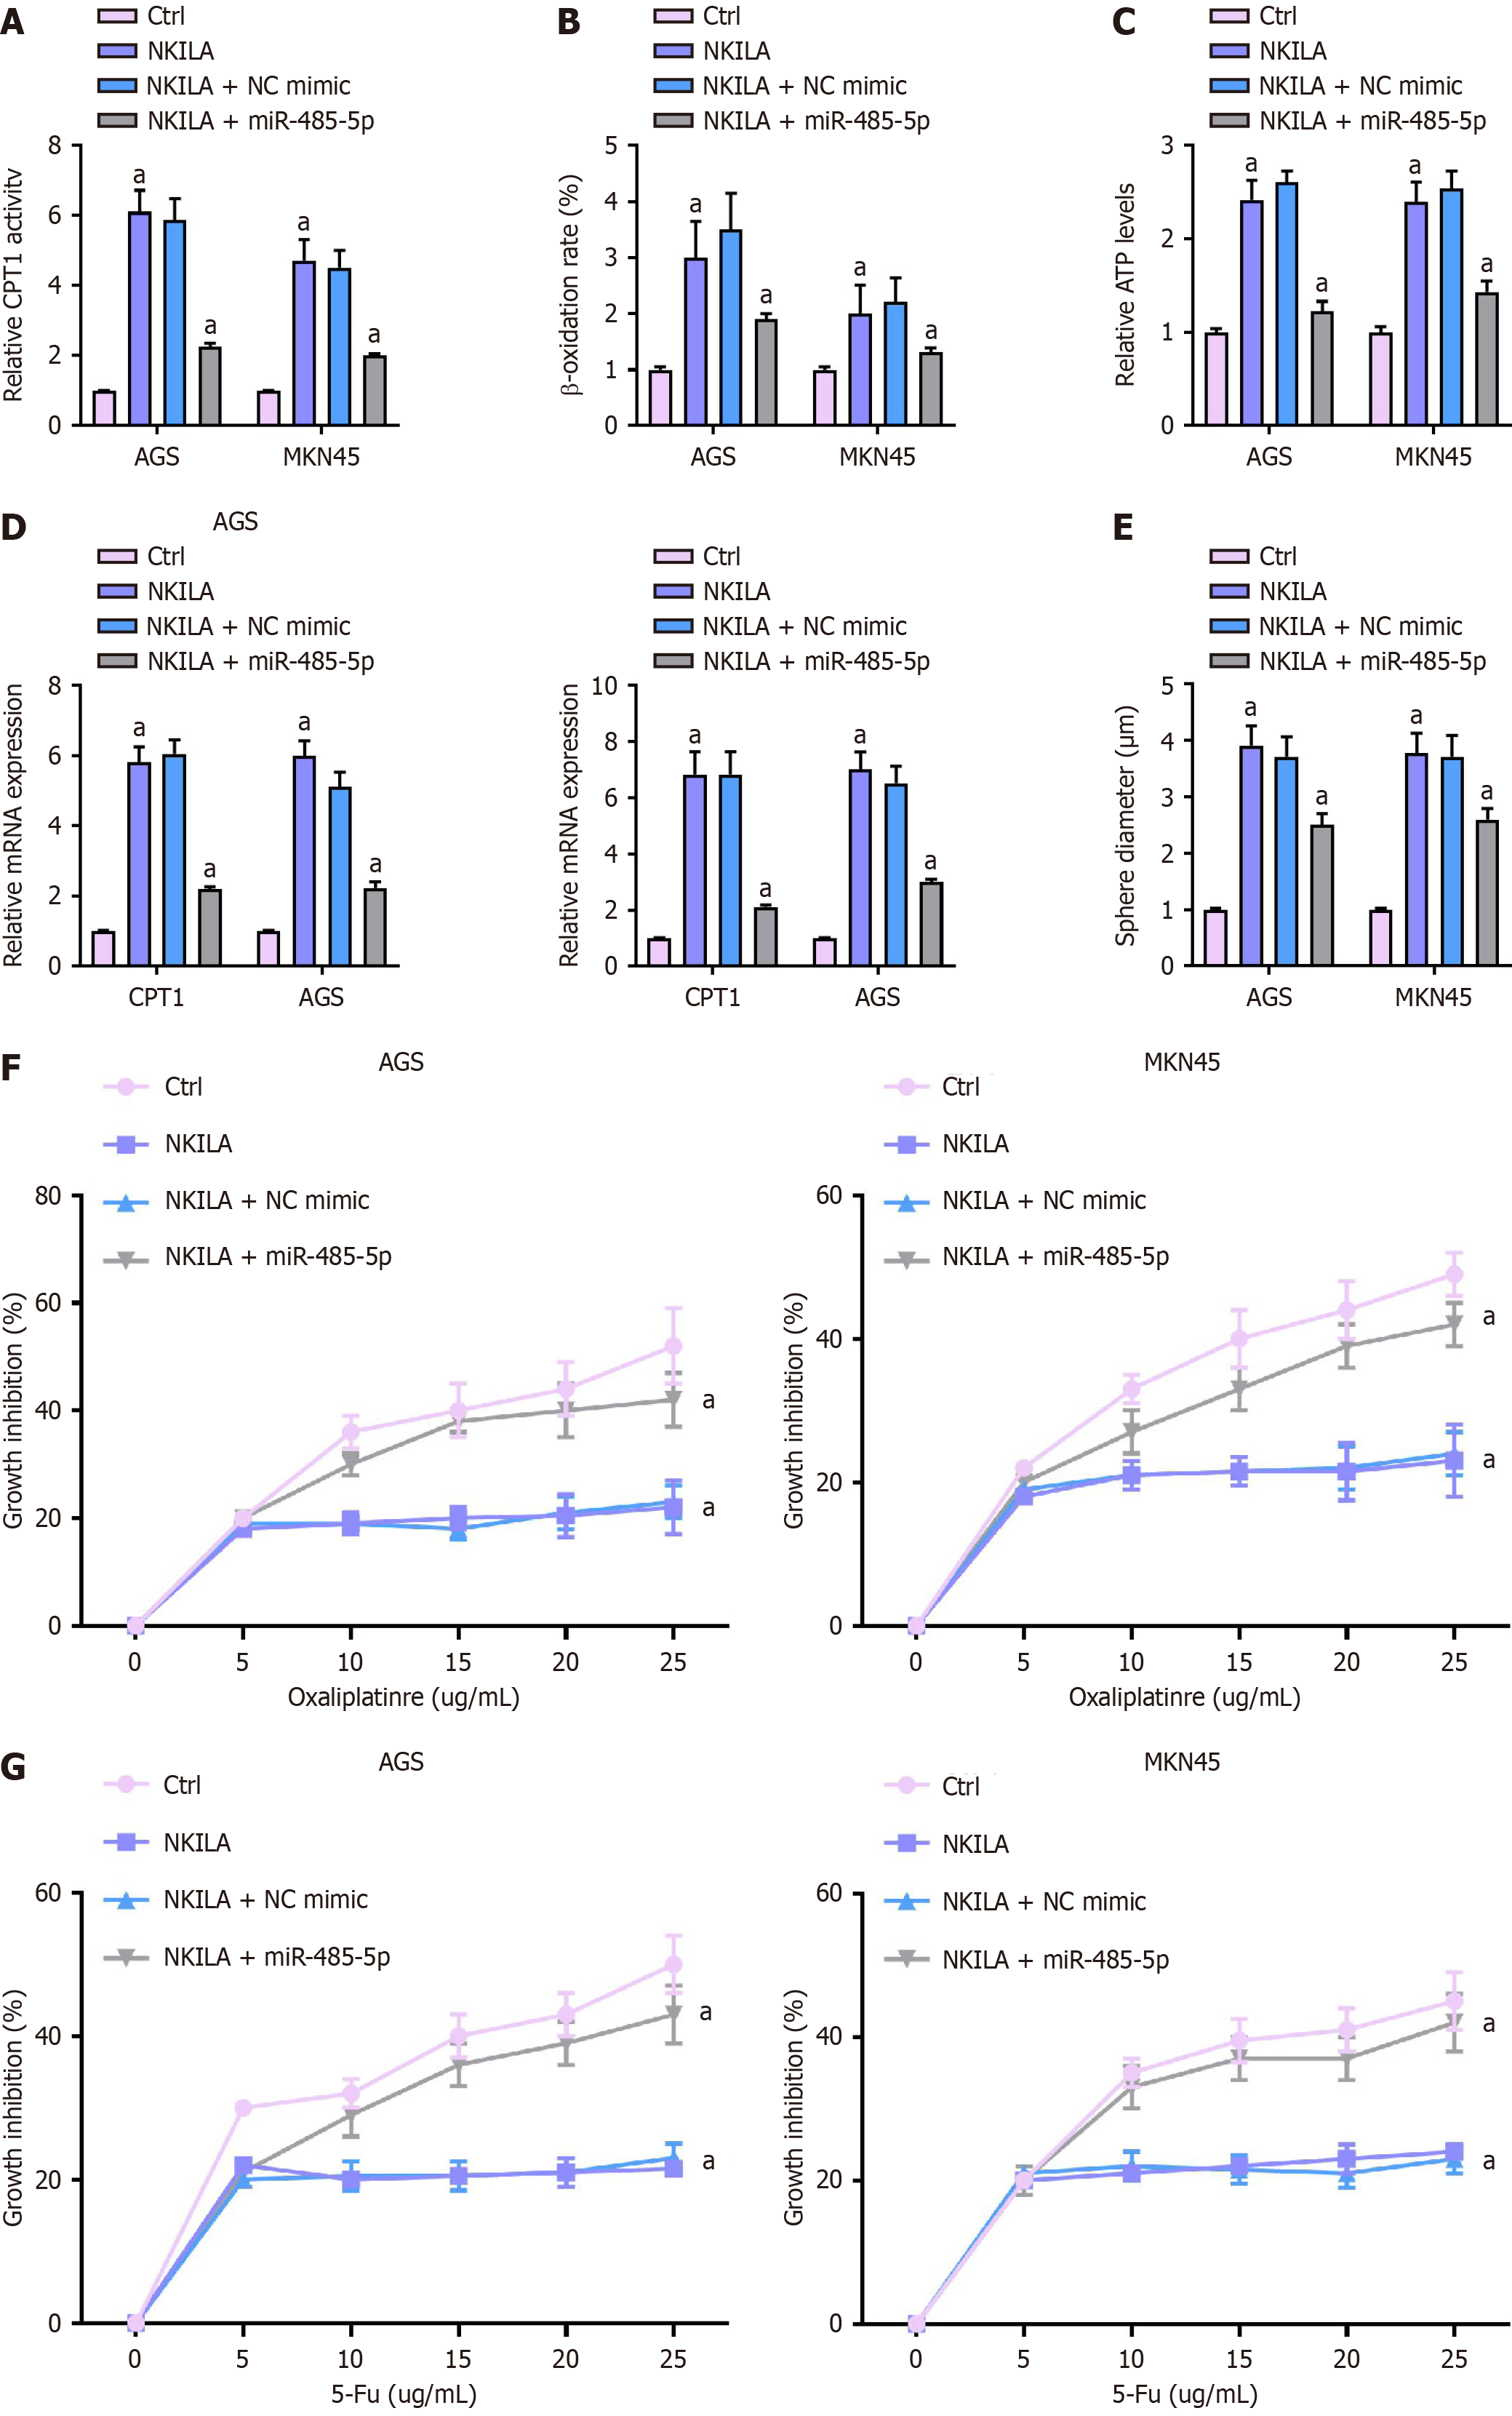
Figure 6 NKILA induces fatty acid oxidation of gastric cancer cells by targeting miR-485-5p.
The MKN45 and AGS cells were transfected NKILA and co-treated with miR-485-5p mimic. A: The CPT1 activity was detected in the cells; B: The β-oxidation was analyzed in the cells; C: The relative ATP levels was determined in the cells; D: The mRNA expression of SOX2, Oct4, LIN28, and CD133 was measured by qPCR; E: The stemness was analyzed using sphere formation assay; F and G: The chemoresistance of oxaliplatin or 5-Fu was detected by CCK-8. aP < 0.01.
- Citation: Lyu XJ, Zhou L, Jiang XM, Zheng D. Mesenchymal stem cell-derived lncRNAs NKILA contributes to stemness and chemoresistance by fatty acid oxidation in gastric cancer via miR-485-5p/STAT3. World J Gastrointest Oncol 2025; 17(8): 105006
- URL: https://www.wjgnet.com/1948-5204/full/v17/i8/105006.htm
- DOI: https://dx.doi.org/10.4251/wjgo.v17.i8.105006


