Published online May 28, 2025. doi: 10.3748/wjg.v31.i20.105554
Revised: April 4, 2025
Accepted: May 15, 2025
Published online: May 28, 2025
Processing time: 122 Days and 3.1 Hours
Hepatic stellate cell (HSC) activation is key to liver fibrosis. Targeting DNA methylation shows promise. Zebularine, a methylation inhibitor, may suppress HSC activation via the calcineurin (CaN)/NFAT3 pathway. Magnetic resonance imaging (MRI) is a noninvasive tool for evaluating liver fibrosis evaluation tool, but multiparametric MRI for zebularine’s effects in liver fibrosis mouse models has not been studied.
To clarify the anti-fibrosis mechanism and MRI-evaluated efficacy of zebularine.
In vitro, transforming growth factor (TGF)-β1-stimulated human HSCs (LX-2) were treated with zebularine. α-smooth muscle actin, fibrotic and anti-fibrotic gene levels, and regulator of calcineurin1 (RCAN1) regulation were measured. In vivo, carbon tetrachloride (CCl4)-induced liver fibrosis in mice was treated with zebularine, and fibrosis was evaluated using various biochemical, histopathological, and MRI methods.
Zebularine upregulated RCAN1.4 protein (P < 0.01) and inhibited the CaN/NFAT3 pathway (P < 0.05). In HSCs, TGF-β1 reduced anti-fibrotic gene massage RNA (mRNA) and increased fibrotic mRNA (P < 0.05), whereas zebularine had the opposite effects (P < 0.01, P < 0.05). CCl4-treated mice exhibited increases in various fibrosis-related indices, all of which were reversed by zebularine treatment (P < 0.05).
Zebularine may reduce LX-2 activation and extracellular matrix deposition via RCAN1.4 and CaN/NFAT3 path
Core Tip: This study explored zebularine’s role in liver fibrosis. Given that hepatic stellate cell activation drives fibrosis and zebularine’s potential via calcineurin/NFAT3, it aimed to clarify its mechanism and efficacy using multiparametric magnetic resonance imaging (MRI). In vitro and in vivo tests showed zebularine regulated genes, inhibited the pathway, and reduced fibrosis, with MRI validating its efficacy.
- Citation: Lyu SY, Xiao W, Chen YJ, Liao QL, Cai YY, Yu C, Liu JY, Liu H, Zhang MP, Ren YL, Yu QL, Qi YM, Xiao EH, Luo YH. Multi-parameter magnetic resonance imaging of zebularine in liver fibrosis treatment and calcineurin/NFAT3 mechanism. World J Gastroenterol 2025; 31(20): 105554
- URL: https://www.wjgnet.com/1007-9327/full/v31/i20/105554.htm
- DOI: https://dx.doi.org/10.3748/wjg.v31.i20.105554
Liver fibrosis results from a combination of long-term liver damage and excessive connective tissue deposition[1]. If left untreated, it can progress to irreversible cirrhosis, characterized by portal hypertension and severe impairment of liver function, posing a significant threat to human health[2]. Therefore, liver fibrosis should be treated to prevent cirrhosis. Clinical approaches often involve multi-faceted strategies targeting various aspects of the disease process, such as pathogenesis, hepatoprotection, and anti-fibrotic, anti-inflammatory, and antioxidant properties[3]. However, there are currently no effective therapeutic drugs or biological agents for the specific treatment of liver fibrosis, making the reversal of liver fibrosis and prevention of its progression to cirrhosis a major challenge in clinical research.
Hepatic stellate cells (HSCs), stimulated by various liver fibrosis-promoting factors, transform into myofibroblasts, secreting an abundant extracellular matrix (ECM)[4], a core component of fibrosis. HSCs exhibit overexpression of α-smooth muscle actin (α-SMA) and type I collagen (CoL1a1)[5]. Activation of HSCs and liver fibrosis are regulated by the same signaling factors, such as transforming growth factor-β (TGF-β)[6], with TGF-β being the major fibroblast factor responsible for HSC activation. Thus, targeting HSCs is a fundamental approach for treating liver fibrosis.
DNA methylation is an essential component of epigenetic modification and plays a crucial role in aggravating liver fibrosis. Genes such as hMSH3, MGMT, SPP1, and GSTM3 that promote liver fibrosis are susceptible to upregulation through hypomethylation[7], while Smad7, PTCH1, and PPAR-γ, which inhibit liver fibrosis, are susceptible to episodic silencing by hypermethylation[8]. Preclinical studies have shown that DNA methylation inhibitors, such as 5-aza-deoxycytidine, inhibit HSC activation[9], resulting in improved liver function and regression of fibrosis[10]. By competitively inhibiting DNA methyltransferase (DNMT) activity, 5-aza-deoxycytidine reduces the binding of CpG island 5-cytosine to methyl groups, thereby restoring the expression levels of genes involved in the regulation of fibrosis[11]. However, the drawbacks of 5-azacytidine and 5-aza-deoxycytidine, such as instability, toxicity, and short half-lives, limit their clinical application. Zebularine, a new-generation chemically synthesized DNA methylation inhibitor, effectively maintains the demethylated state of genes with fewer side effects and improved specificity[12]. It has been shown to successfully reverse TGF-β-induced α-SMA expression in a time- and dose-dependent manner[13]. It also restores the responsiveness of nonfibrotic fibroblasts to protective factors through demethylation[14]. However, the molecular mechanism by which zebularine inhibits fibroblast proliferation via demethylation remains unclear.
Calcineurin (CaN) is the only phosphatase activated by calcium and calmodulins. During liver fibrosis, NFAT3 in the cytoplasm undergoes dephosphorylation by CaN and translocates into the nucleus. It promotes the apoptosis of activated HSCs, leading to excessive deposition of ECM, which in turn facilitates the progression of fibrosis[10,15]. The CaN/NFAT3 signaling pathway is an important pathway for the deposition of ECM. The regulator of calcineurin1 (RCAN1), an endogenous inhibitor of CaN, is regulated by DNA methylation. RCAN1.4, the major isoform, inhibits HSC activation by antagonizing the CaN/NFAT3 signaling pathway[10]. Studies have indicated that upregulation of the RCAN1.4 gene results in therapeutic remission of various diseases, such as liver[10] and renal fibrosis[13]. Whether zebularine can upregulate RCAN1.4 and block the CaN/NFAT3 signaling pathway, thereby antagonizing HSC activation, remains to be investigated.
The “gold standard” for evaluating liver fibrosis is liver biopsy. However, biopsies have limitations, such as sampling error, poor reproducibility, bleeding, and inconvenience for dynamic observation and follow-up. Magnetic resonance imaging (MRI) provides several advantages, including a lack of radiation exposure, superior soft-tissue resolution, and capability for multi-parameter and multidirectional imaging[16]. Our preliminary study found a strong correlation between multi-parameter MRI data and the pathological staging of fibrosis and inflammation[17,18].
We hypothesized that the methylation inhibitor zebularine may negatively regulate the CaN/NFAT3 signaling pathway by upregulating RCAN1.4 expression, thereby inhibiting HSC activation and ECM production, ultimately reversing liver fibrosis. Additionally, multiparametric MRI could allow for noninvasive liver fibrosis grading and assessment of antifibrotic therapy efficacy, enabling the evaluation of the efficacy of zebularine treatment in a liver fibrosis model.
In this study, we aimed to provide new insights into the role of zebularine in epigenetic regulation and its potential as a therapeutic agent for liver fibrosis and to validate MRI as a diagnostic tool for fibrosis evaluation.
The Animal Care and Use Committee of the Second Xiangya Hospital in Central South University (approval number: 20230520). All procedures were performed in full compliance with relevant Chinese laws and institutional ethical guidelines.
The human HSC line LX-2 (Procell, CL-0560, Wuhan, Hubei Province, China) was cultured in a constant temperature incubator (37 °C, 5% carbon dioxide) using Dulbecco’s modified eagle medium (Corning, 10-013-CVRC, United States) containing 10% fetal bovine serum (Procell, 164210-50, Wuhan, Hubei Province, China).
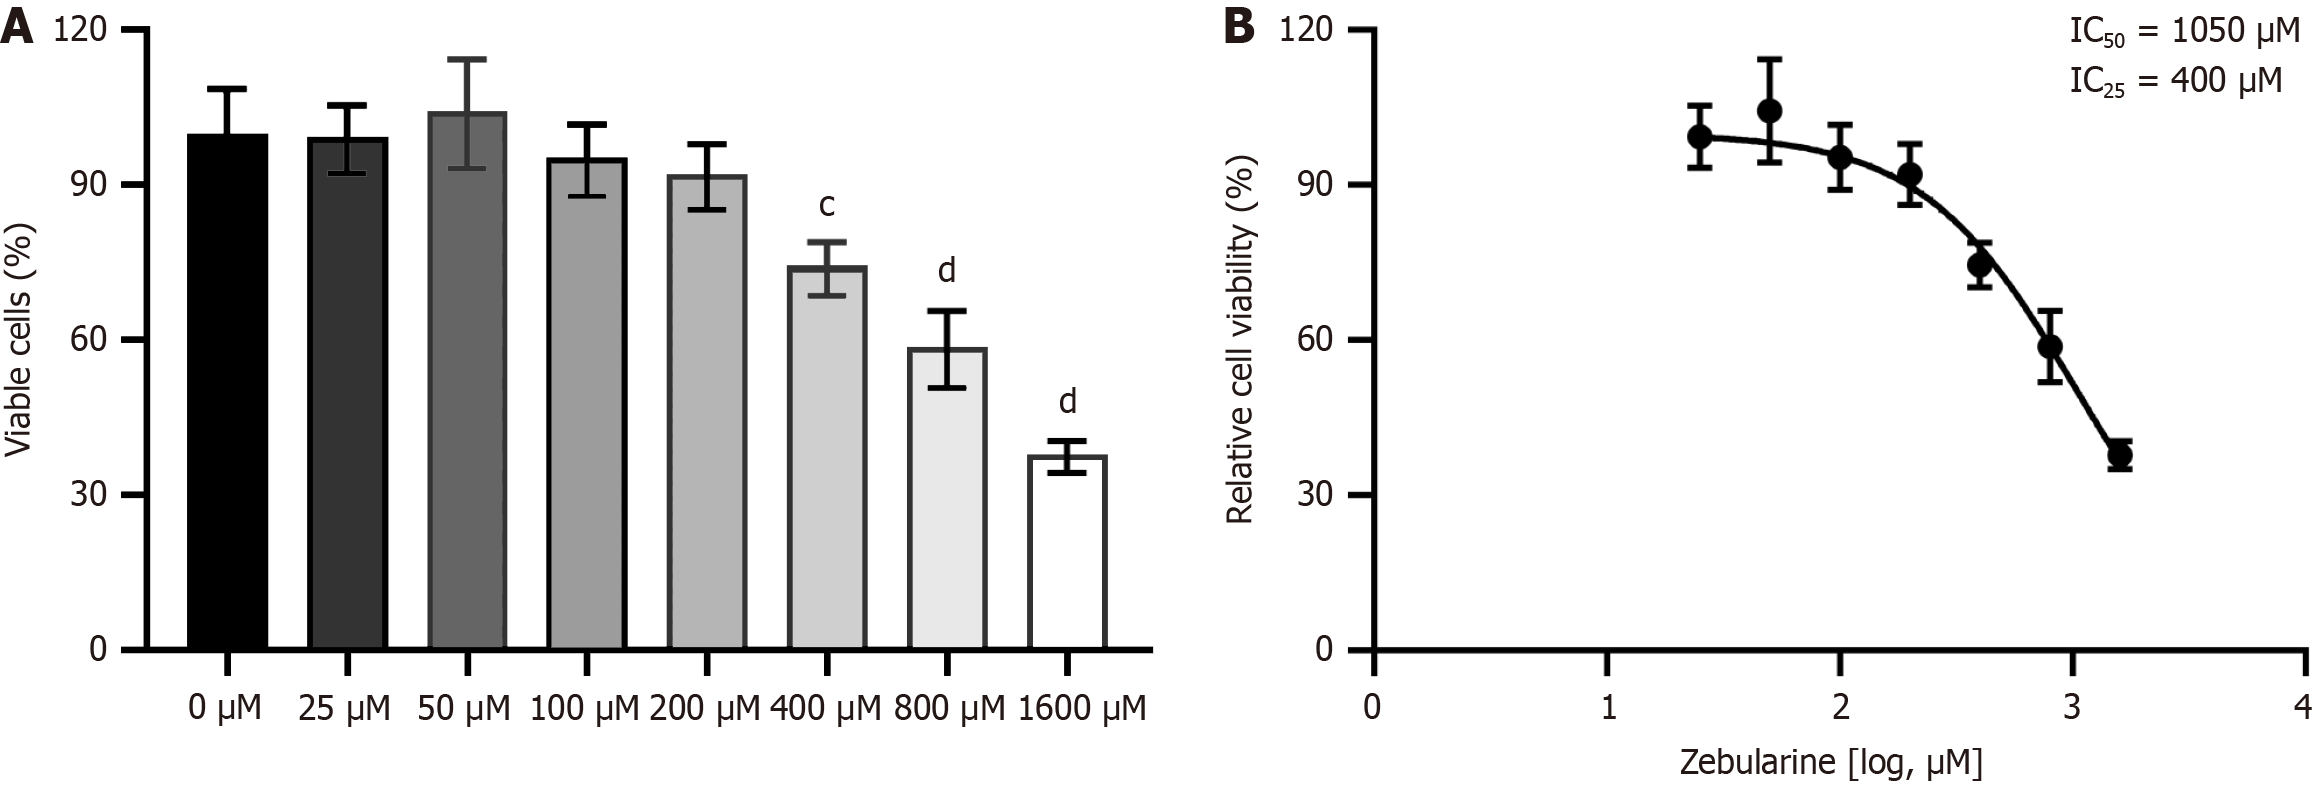
Cell viability was assessed using the cell counting kit (CCK)-8 assay. LX-2 cells (activated with 10 ng/mL TGF-β1) were seeded into 96-well plates (3000 cells per well, n = 3). Cells were treated with 0, 25, 50, 100, 200, 400, 800, and 1600 mM zebularine for 72 hours. The waste solution was removed, and a medium containing 10% CCK-8 reagent (Solarbio, Beijing, China) was added to each well and incubated for 4 hours. The absorbance (A) at 450 nm was measured using a microplate reader. Cell viability was calculated as follows: Cell viability (%) = (Aexperimental group - Ablank group)/(Acontrol - Ablank group) × 100%.
Total RNA was extracted and reverse-transcribed into complementary DNA using RNA extraction and reverse tran
| Gene (human) | Forward | Reverse |
| CoL1a1 | 5’-AGACGAAGACATCCCACCA-3’ | 5’-GTCGCAGACGCAGATCC-3’ |
| ACTA2 (α-SMA) | 5’-GTTACGAGTTGCCTGATGG-3’ | 5’-AGGTGGTTTCATGGATGC-3’ |
| SEPTIN9 | 5’-GTGAAGAACTCAGAACCCTCG-3 | 5’-TCAATGGACAGCTCAGTGC-3’ |
| PPAR-γ | 5’-AGATCATTTACACAATGCTGGC-3’ | 5’-TAAAGTCACCAAAAGGCTTTCG-3’ |
| PTEN | 5’-GACCAGAGACAAAAAGGGAGTA-3’ | 5’-ACAAACTGAGGATTGCAAGTTC-3’ |
| RCAN1.4 | 5’-TTTAGCTCCCTGATTGCCTGT-3’ | 5’-AAAGGTGATGTCCTTGTCATACG-3’ |
| PTCH1 | 5’-TTTTCTGCTGTTTTACAAGCCC-3’ | 5’-CATGGTAATCTGCGTTTCATGG-3’ |
| β-actin (loading control) | 5’-TCCCTGGAGAAGAGCTACGA-3’ | 5’-TGAAGGTAGTTTCGTGGATGC-3’ |
Proteins were extracted from HSCs using radio immunoprecipitation assay reagent (89900, Thermo Scientific, United States), separated by polyacrylamide sodium dodecyl sulfate gel electrophoresis, and transferred to polyvinylidene difluoride (PVDF) membranes (ISEQ0010, Millipore, MA, United States). The membranes were incubated overnight at 4 °C with the primary antibodies listed in Table 2. The PVDF membranes were subsequently incubated with horseradish peroxidase-coupled secondary antibodies, and protein bands were detected using enhanced chemiluminescence reagent (K-12045-d10, Advansta, United States). Western blotting was performed three times, and the target protein bands were scanned for optical densitometry and normalized by glyceraldehyde-3-phosphate dehydrogenase, β-tubulin, and Lamin B1 signal intensities using Image-J processing software.
| Protein | Application | Origin | Dilution |
| α-SMA | WB and IHC-P | ab5694, Abcam, United Kingdom | 1:200 |
| RCAN1.4 | WB | ab140131, Abcam, United Kingdom | 1:10000 |
| CaN | WB | 55147-1-AP, Proteintech, China | 1:1000 |
| NFAT3 | WB and IHC and IF | bs-6461R, Bioss, China | 1:1000 |
| β-tubulin | WB and IHC and IF | 10094-1-AP, Proteintech, China | 1:5000 |
| GAPDH | WB and IHC and IF | ab9485, Abcam, United Kingdom | 1:2500 |
| Lamin B1 | WB and IHC and IF | 12987-1-AP, Proteintech, China | 1:5000 |
| HRP-conjugated affinipure goat anti-rabbit IgG (High + Low) | ELISA, WB | SA00001-2, Proteintech, China | 1:5000 |
Female Balb/C mice (6-8 weeks old, 18-22 g) were purchased from the Laboratory Animal Center of the Second Xiangya Hospital, Central South University. Mice were housed in pathogen-free animal facilities and temperature-controlled rooms (20 °C-26 °C) with a 12-hour regular light-dark cycle and ad libitum access to food and water. After 1 week of adaptive breeding, the mice were randomly divided into the control, a carbon tetrachloride (CCl4), and a CCl4 + zebula
The treatments were as follows: The CCl4 + zebularine group was administered intraperitoneal injections of zebularine (225 mg/kg/day)[13]. The control group received an equivalent volume of saline containing 3% dimethyl sulfoxide. In the CCl4-induced hepatic fibrosis model group and CCl4 + zebularine group, mice were administered a mixture (1:3 v/v) of CCl4 and olive oil[19] via intraperitoneal injection at a dose of 0.7 mL/kg twice a week. The control group received an equivalent dose of olive oil. At the end of the modeling period, MRI scans were performed on all mice.
A 3.0T clinical MR scanner (uMR790; United Imaging Medical, Shanghai, China) equipped with an 8-channel mouse coil was used for MRI. Initially, unenhanced whole-liver sequences were obtained, including T1-weighted fast spin-echo, T2-weighted single-shot fast spin-echo, diffusion-weighted imaging (DWI) with two b values (b = 0, 800 s/mm), variable flip-angle T1 mapping, and multi-echo spin-echo T2 mapping. Subsequently, a contrast agent (80 μL saline plus 20 μL gadoxetate disodium) was injected via the tail vein, and enhanced T1-weighted imaging and T1 mapping were per
| Parameter/sequence | T1WI | T2WI | EPI-DWI | T1 MAP | T2 MAP |
| TR | 585 | 3243 | 2000 | 15 | 3000 |
| TE | 11.32 | 87.38 | 80 | 3.87 | 17.4, 34.8, 52.2, 69.6, 87.0, 104.4 |
| Flip angle (°) | 150° | 140° | 90° | 5°, 25° | 180° |
| Voxel size (mm³) (X × Y × Z) | 0.16 × 0.16 × 1 | 0.30 × 0.30 × 1 | 0.59 × 0.59 × 2 | 0.13 × 0.13 × 1 | 0.50 × 0.50 × 2 |
| FOV (mm²) | 40 × 40 | 40 × 40 | 50 × 80 | 75 × 83 | 90 × 100 |
| Slices | 20 | 20 | 15 | 20 | 15 |
| Acquisition time | 4:47 | 5:24 | 3:22 | 3:8 | 5:39 |
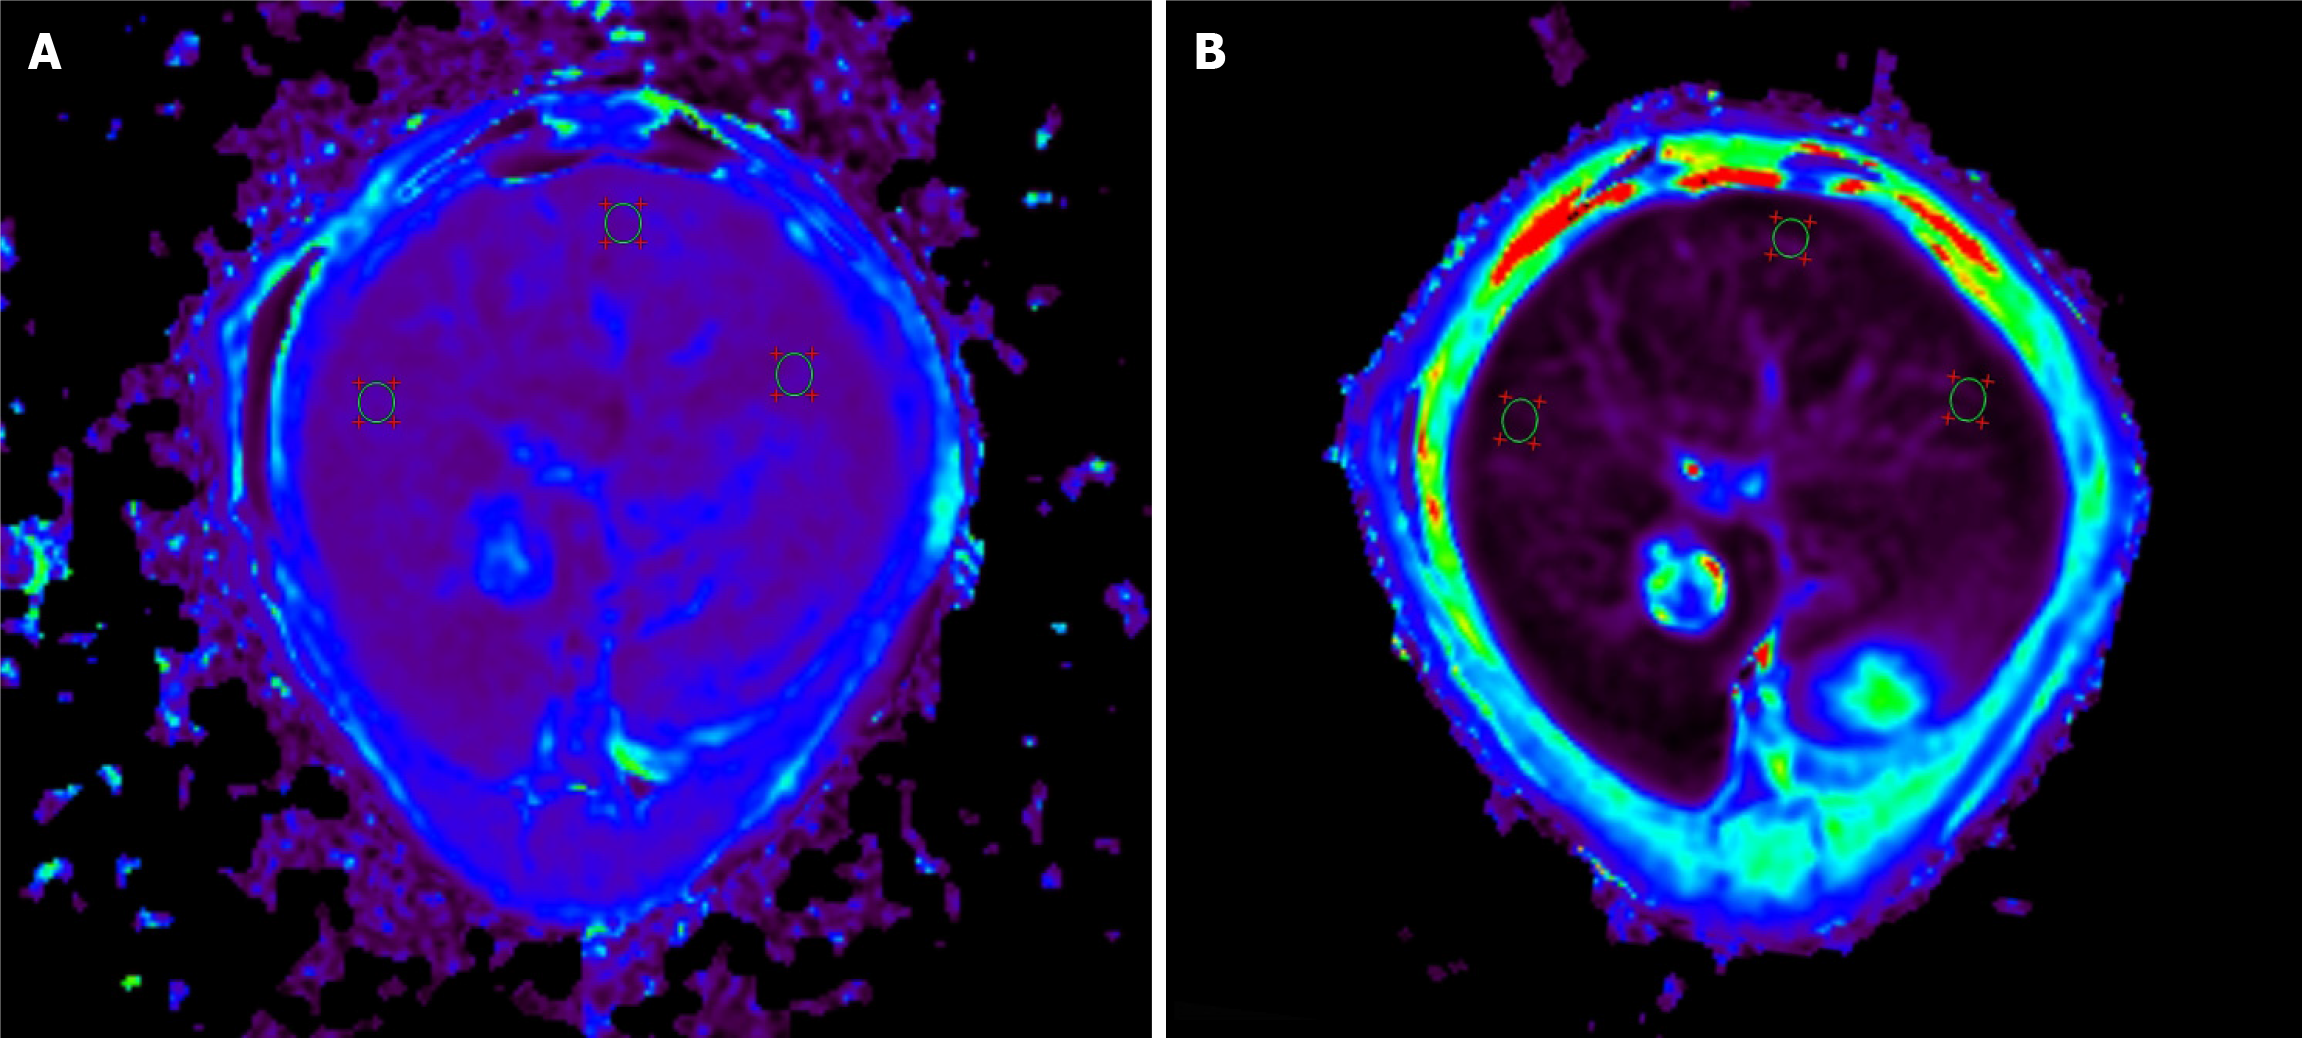
The captured images were sent to a post-processing workstation (uWS-MR, United Imaging Medical, Shanghai, China). Pixel-level T1 maps were developed using the Levenberg-Marquardt curve-fitting algorithm, while T2 maps were generated by fitting the echo intensity of each pixel using the log-linear least squares method. Two radiologists with 11 years of experience in diagnostic abdominal imaging (Xiao EH and Luo YH) selected six regions of interest in the whole liver cross-section, avoiding large vessels and bile ducts, with an averaged area of 0.75 mm² (Figure 1). The difference in the TI values (ΔT1) was calculated as T1pre - T1post. DWI data were processed using custom software developed in MATLAB R2018b (MathWorks, Natick, MA, United States). The apparent diffusion coefficient (ADC) was calculated voxel-wise by applying the following formula: Sb/S0 = e-bADC, where Sb and S0 represent the signal intensities with and without diffusion weighting, respectively, and b is the diffu
To evaluate liver function, serum samples were extracted from the retroorbital venous plexus of each mouse, and the levels of the enzymes aspartate aminotransferase (AST) and alanine aminotransferase (ALT) were determined.
Following MRI at the designated time points, the mice were humanely euthanized and liver tissue was promptly harvested for histological analysis. The liver weights (G) were recorded, the hepatosomatic index (HSI) was calculated as the liver weight-body ratio, and the tissues were labeled, fixed in 4% paraformaldehyde, dehydrated, and embedded in paraffin to obtain pathological sections. The embedded tissues were stained with hematoxylin and eosin (HE) and Masson’s trichrome staining kit (G1006; ServiceBio, Wuhan, Hubei Province, China).
Observations were conducted using an Olympus microscope (Olympus Corporation, Tokyo, Japan), and the collagen fiber area fraction was quantified using ImageJ software (Rawak Software, Stuttgart, Germany).
Fibrosis and inflammation were evaluated and staged according to the METAVIR scoring system for fibrosis[20,21] and activity[22].
Statistical comparisons between groups were performed using one-way analysis of variance (ANOVA) for normally distributed data with homogeneous variances. For non-normally distributed data, the Kruskal-Wallis test with Bonferroni correction was applied. When data were normally distributed but exhibited heterogeneity of variance, one-way ANOVA with Tamhane’s T2 post hoc test was employed. Spearman’s rank correlation analysis was conducted to assess the relationships between MRI parameters and the pathological and inflammatory stages of liver fibrosis. All statistical analyses were performed using SPSS software (version 27.0; SPSS Inc., Chicago, IL, United States). Statistical significance was defined as P < 0.05. The statistical review of the study was carried out under the supervision of a biomedical statis
The CCK8 assay showed that the survival rate of activated LX-2 cells decreased as zebularine concentration increased (Figure 2A). The IC25 and IC50 of zebularine in activated LX-2 cells were 410 mmol/L and 1050 mmol/L, respectively (Figure 2B). A concentration of 400 mmol/L zebularine was used in subsequent experiments.
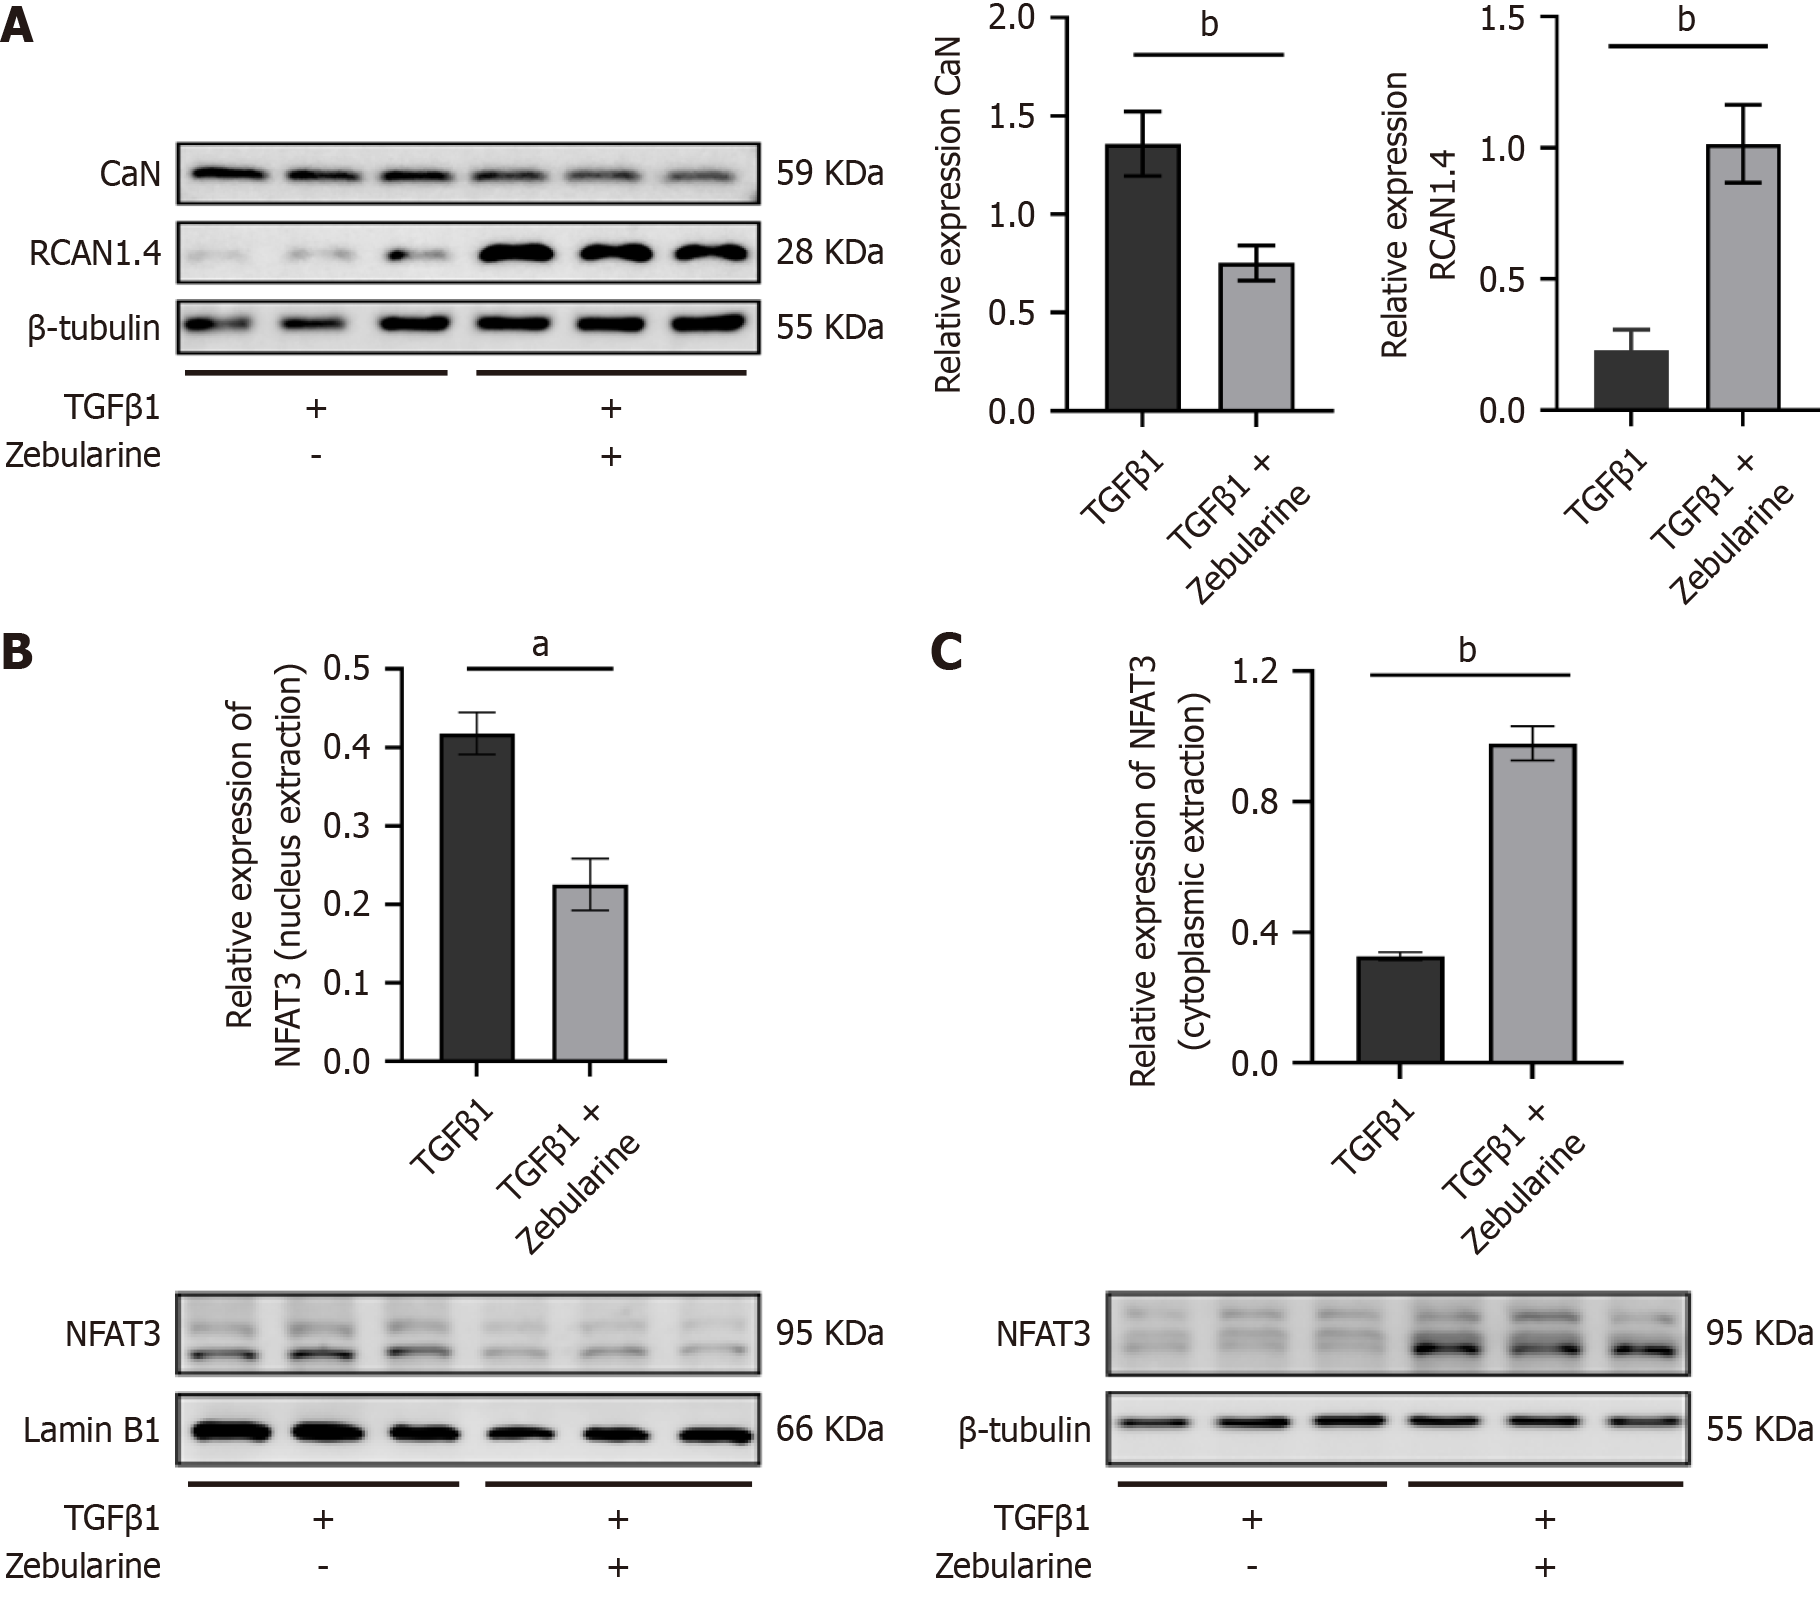
Compared to the TGF-β1 group, the protein expression of RCAN1.4 was significantly increased in the TGF-β1 + zebularine group (P < 0.01), whereas the expression of CaN was decreased (P < 0.01, Figure 3A). Additionally, zebularine decreased NFAT3 protein expression in the nucleus of activated LX-2 cells (P < 0.05, Figure 3B) and increased its expression in the cytoplasm (P < 0.01, Figure 3C).
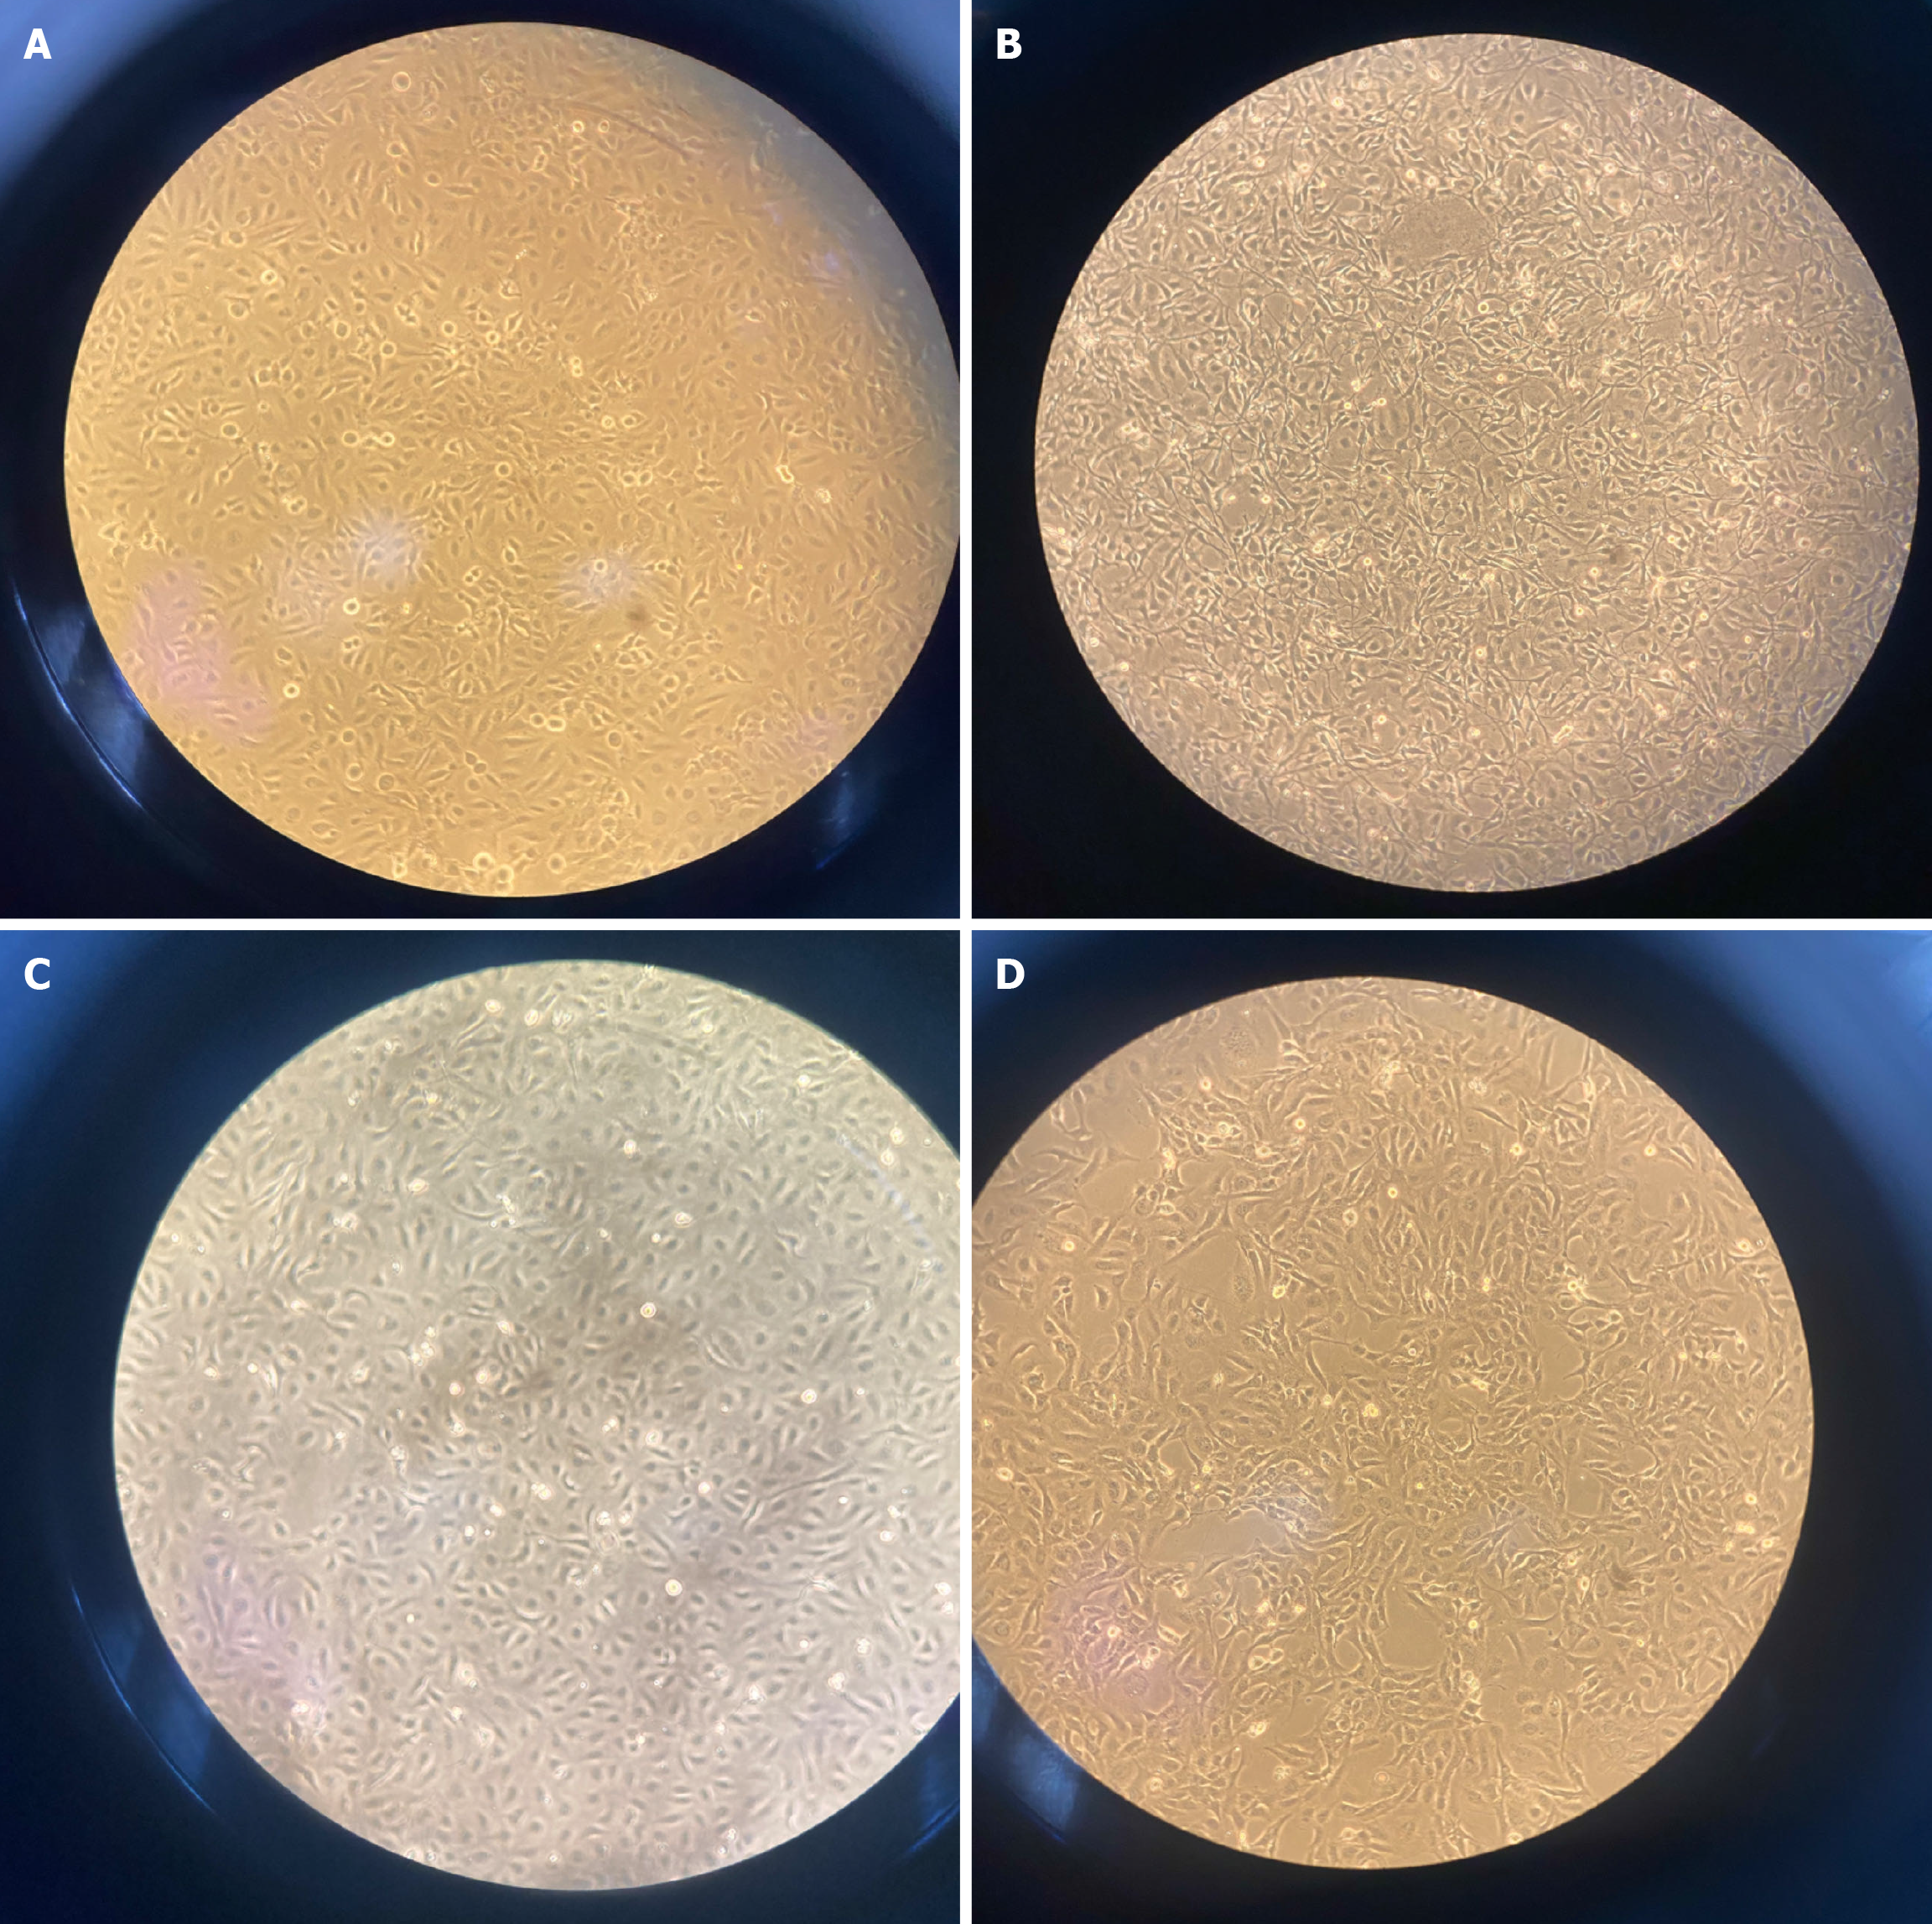
In the resting state, LX-2 cells exhibit a polygonal morphology (Figure 4A). Following TGF-β1 treatment, the cells adopted a long spindle shape, and the number of interstitial laser breaks increased (Figure 4B). Compared to cells in the TGF-β1 group, cells in the TGF-β1 + zebularine group were thinner and less elongated, with many cells maintaining a star or polygonal shape (Figure 4C and D).
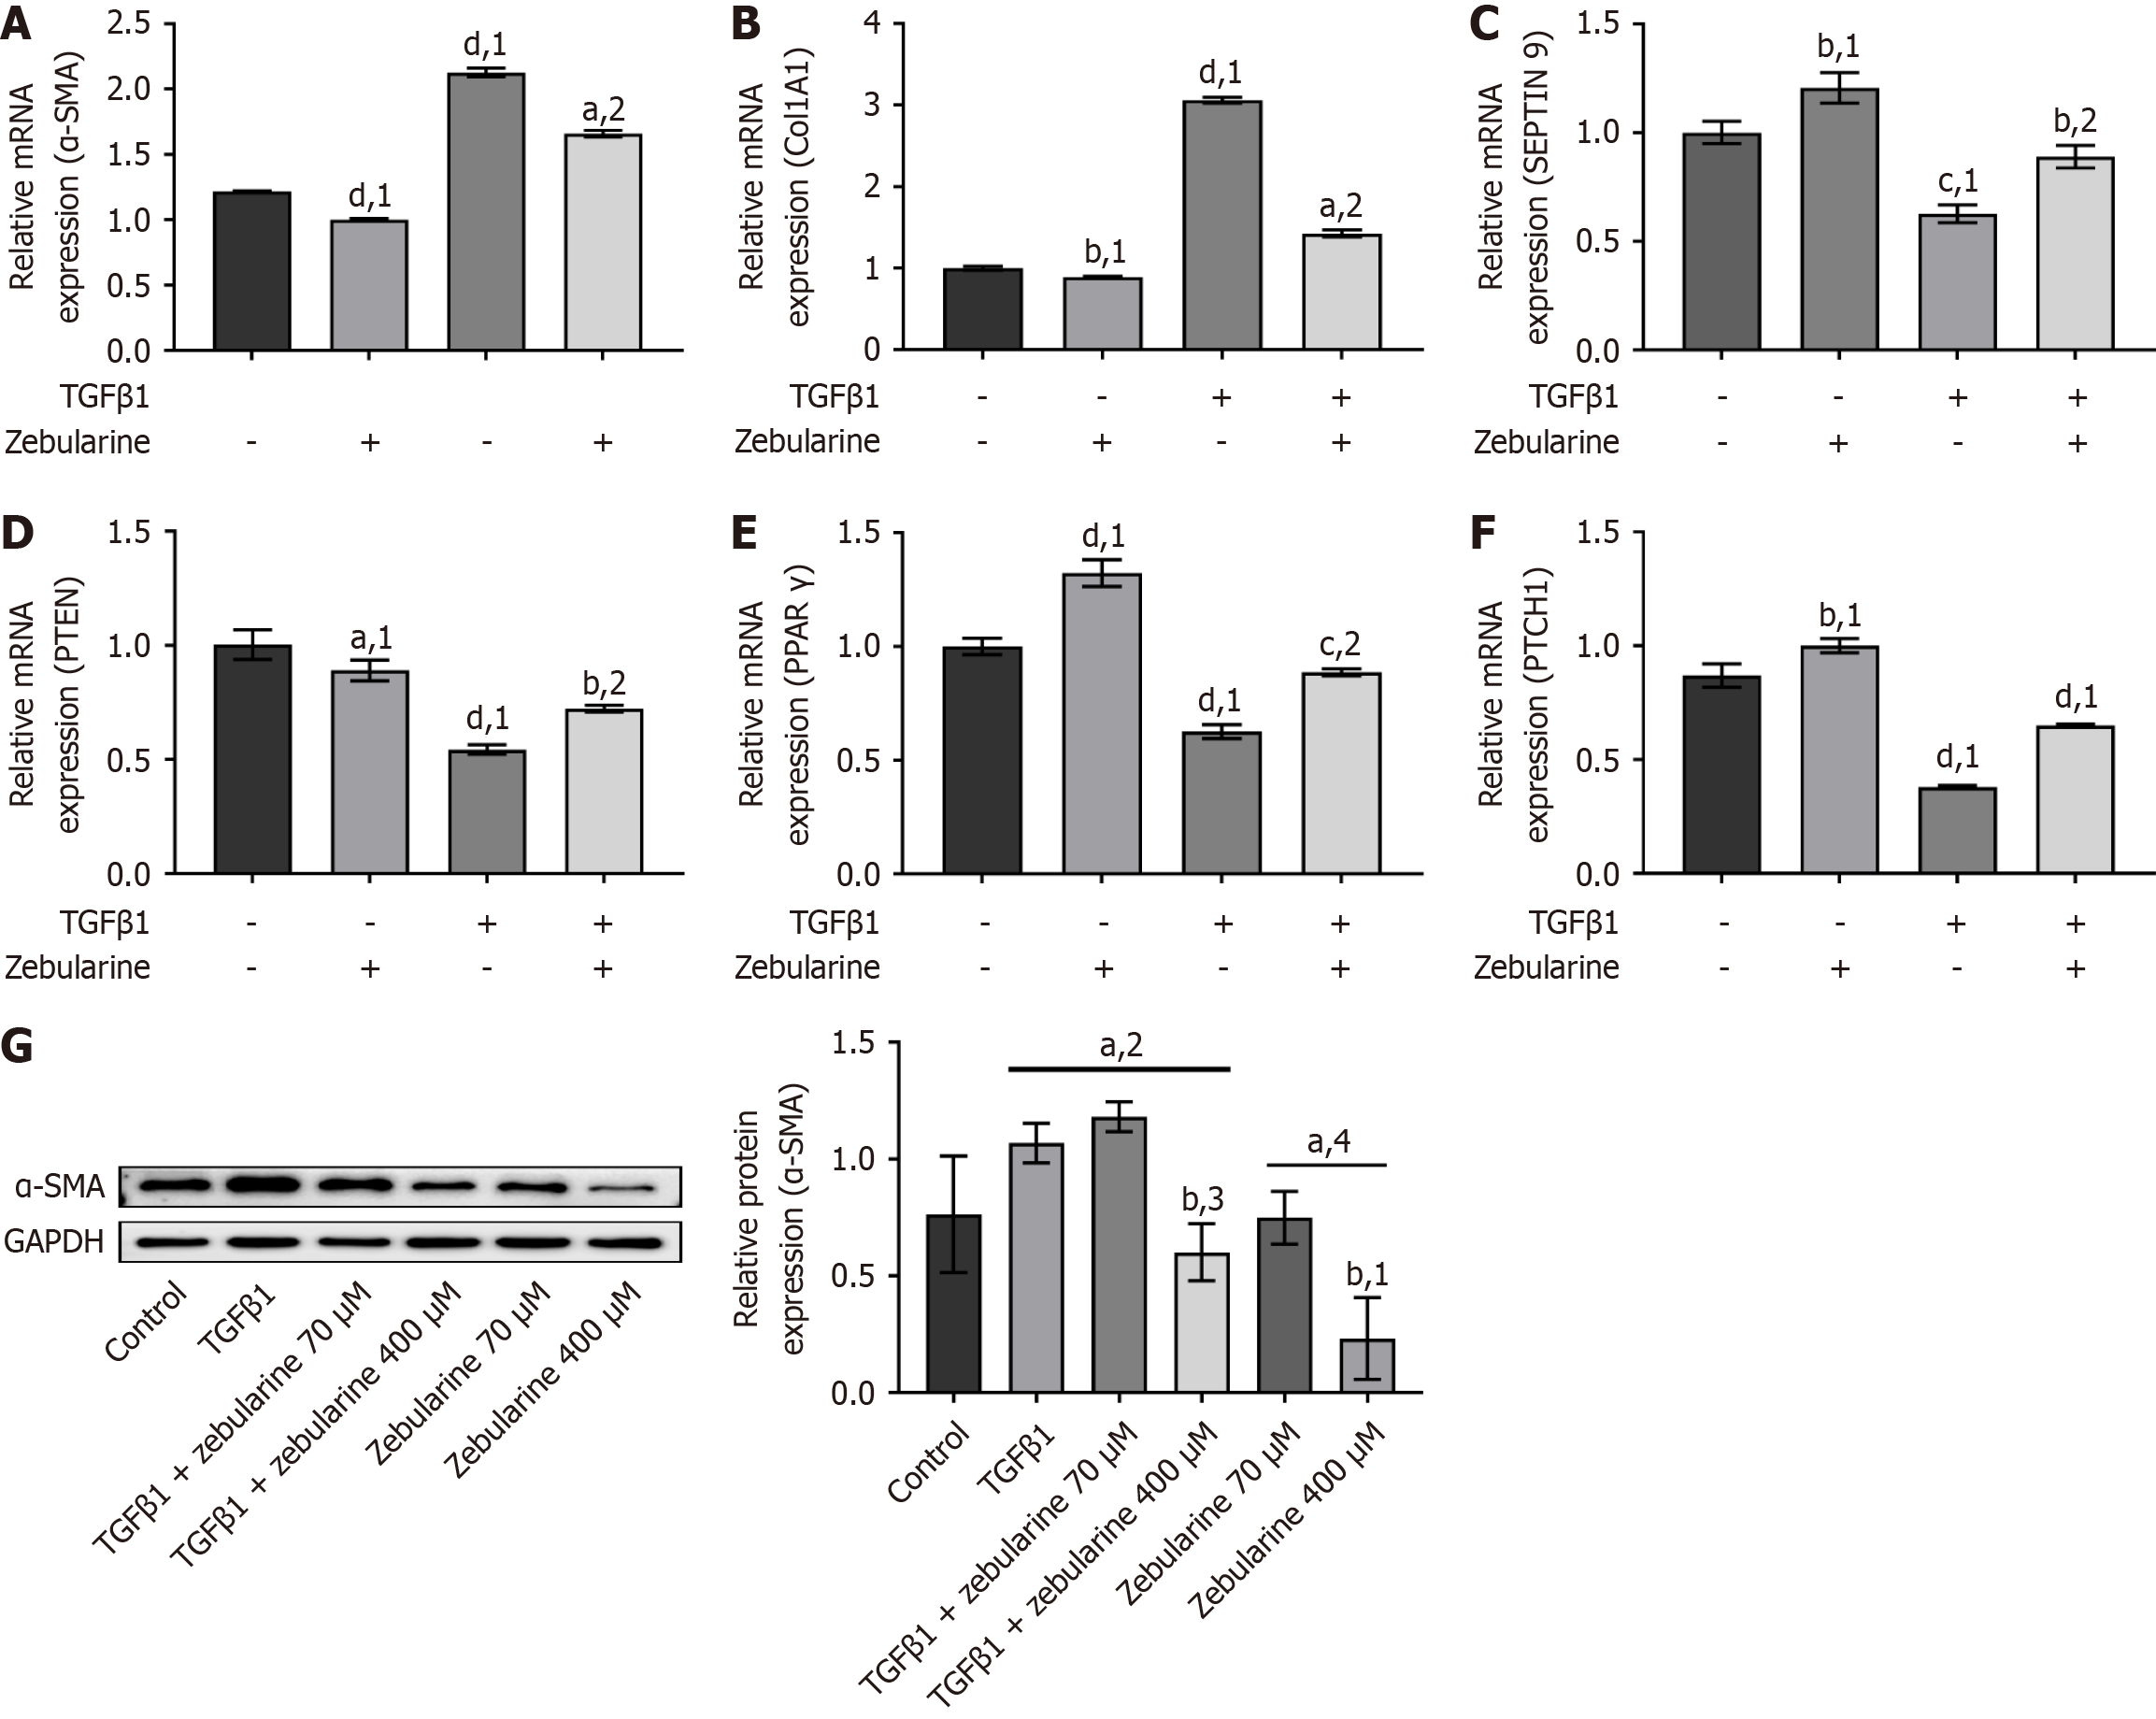
Compared to the TGF-β1 group, the massage RNA (mRNA) expression of α-SMA and CoL1a1 was significantly reduced in the TGF-β1 + zebularine group (P < 0.0001, Figure 5A and B). In contrast, when the concentration was 400 mM, the mRNA levels of anti-fibrotic genes in the TGF-β1 + zebularine group were significantly elevated (P < 0.01, Figure 5C-F), and the protein expression of α-SMA was reduced (P < 0.05, Figure 5G).
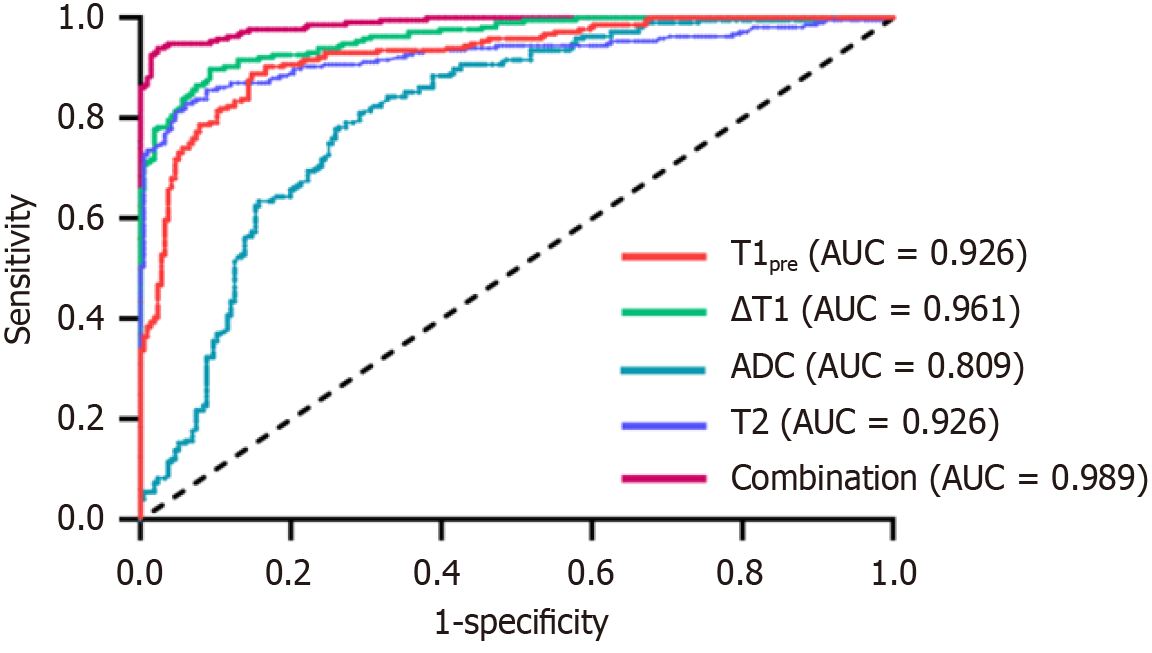
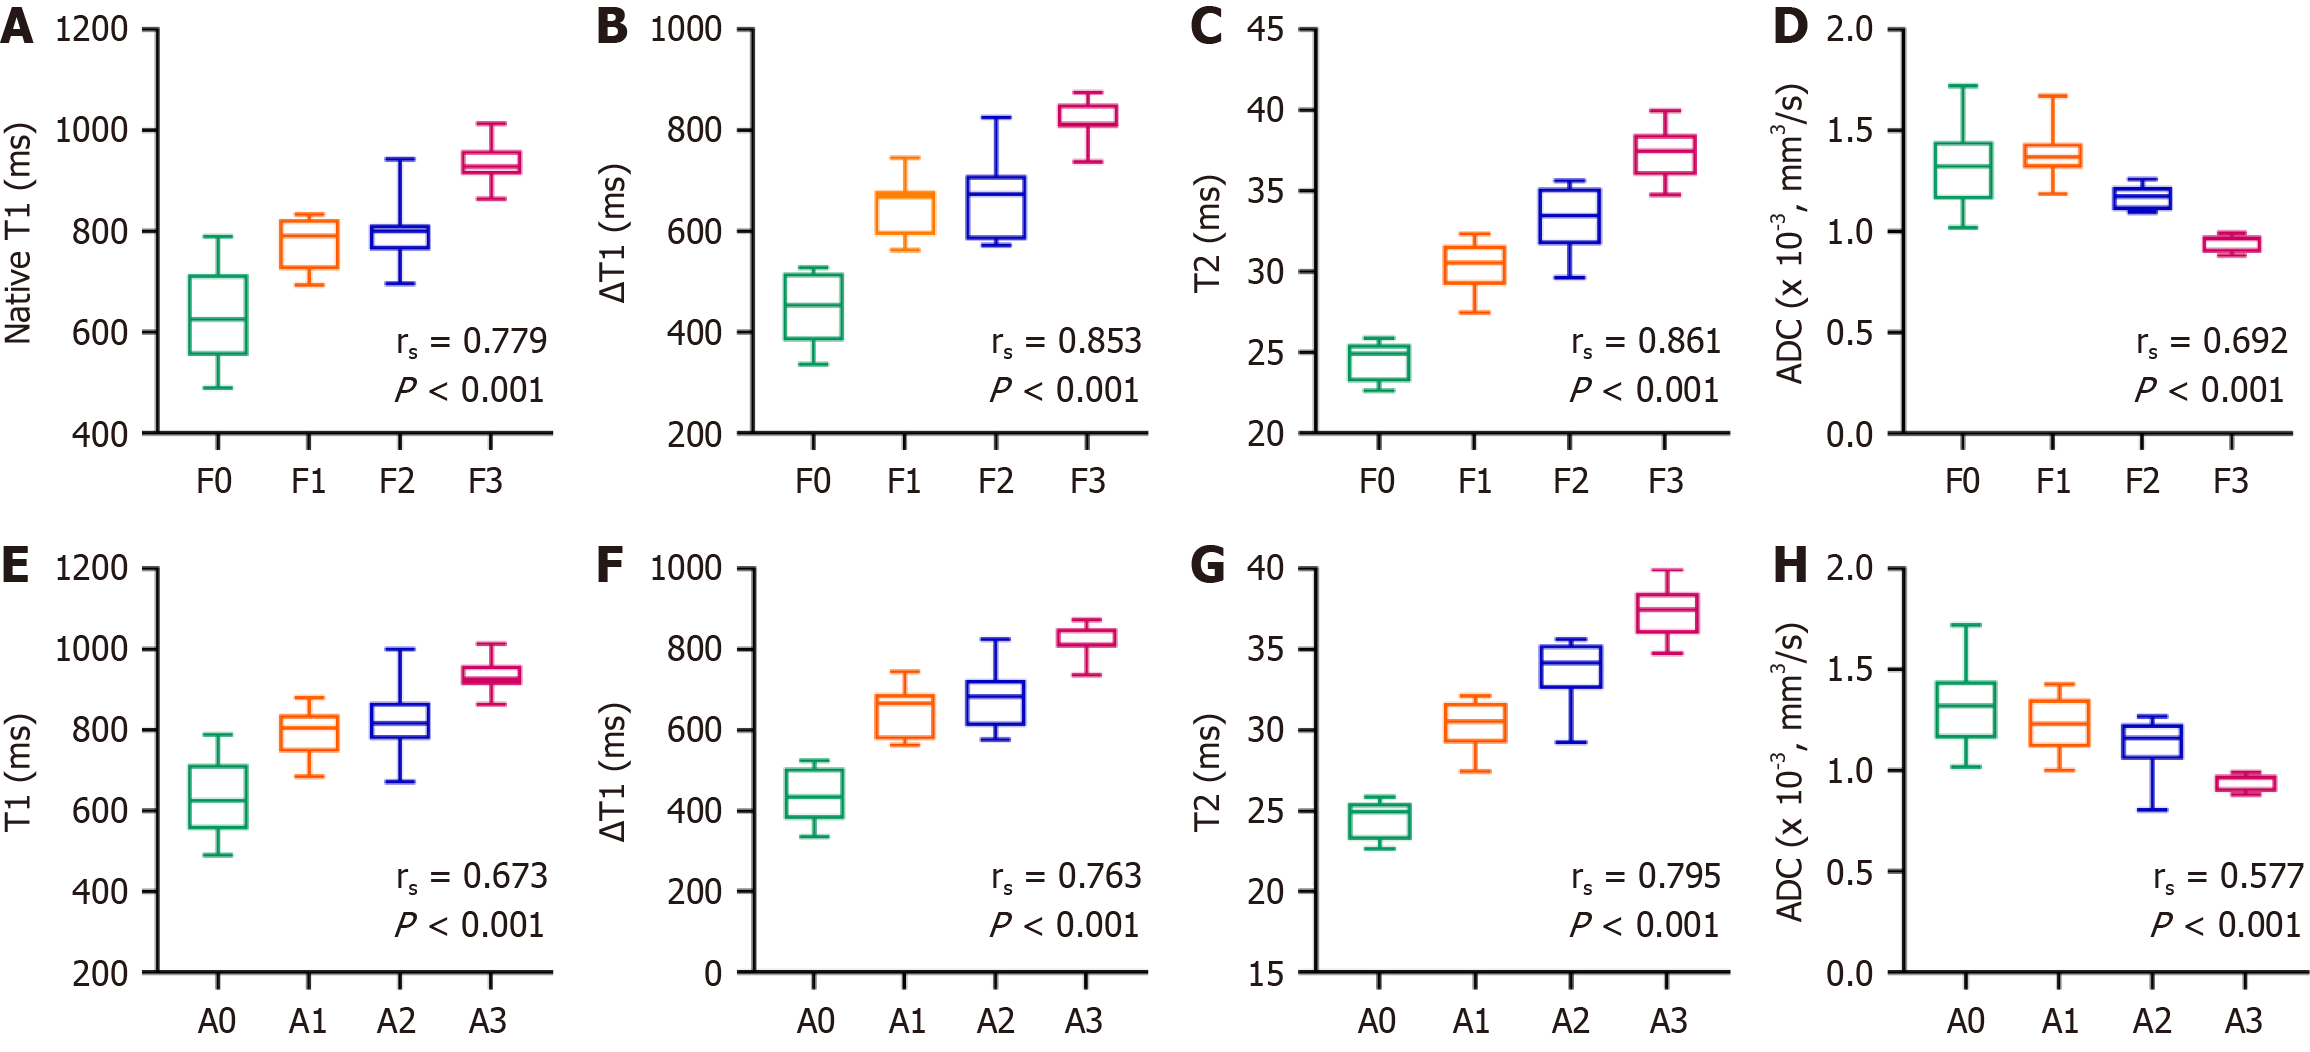
Receiver operating characteristics analyses were also performed. The single-parameter results indicated that the area under the curve (AUC) was highest for the ΔT1 value (0.961). Notably, the AUC for the combined parameters (0.989) exceeded that of any single parameter (Table 4 and Figure 6). Correlation analyses of each parameter with METAVIR fibrosis and inflammation scores were performed (Figure 7 and Table 5). Changes in T1, ∆T1, and T2 values were consistent with changes in liver fibrosis and inflammation, whereas ADC values were negatively correlated with these changes. The correlation of each parameter with fibrosis staging was higher than that with inflammation staging (P < 0.001).
| Parameters | T1pre (ms) | △T1 (ms) | ADC (× 10-3, mm2/second) | T2 | Combined diagnosis |
| AUC | 0.926 | 0.961 | 0.809 | 0.926 | 0.989 |
| 95%CI | 0.902-0.951 | 0.945-0.976 | 0.768-0.851 | 0.899-0.953 | 0.982-0.996 |
| P value | < 0.001 | < 0.001 | < 0.001 | < 0.001 | < 0.001 |
| Sensitivity | 0.889 | 0.898 | 0.810 | 0.829 | 0.940 |
| Specificity | 0.852 | 0.907 | 0.708 | 0.940 | 0.977 |
| Parameters | Fibrosis | Inflammation | ||
| rs | P value | rs | P value | |
| T2 | 0.861 | < 0.001 | 0.795 | < 0.001 |
| △T1 | 0.853 | < 0.001 | 0.763 | < 0.001 |
| T1pre T1 | 0.779 | < 0.001 | 0.673 | < 0.001 |
| ADC | -0.692 | < 0.001 | -0.577 | < 0.001 |
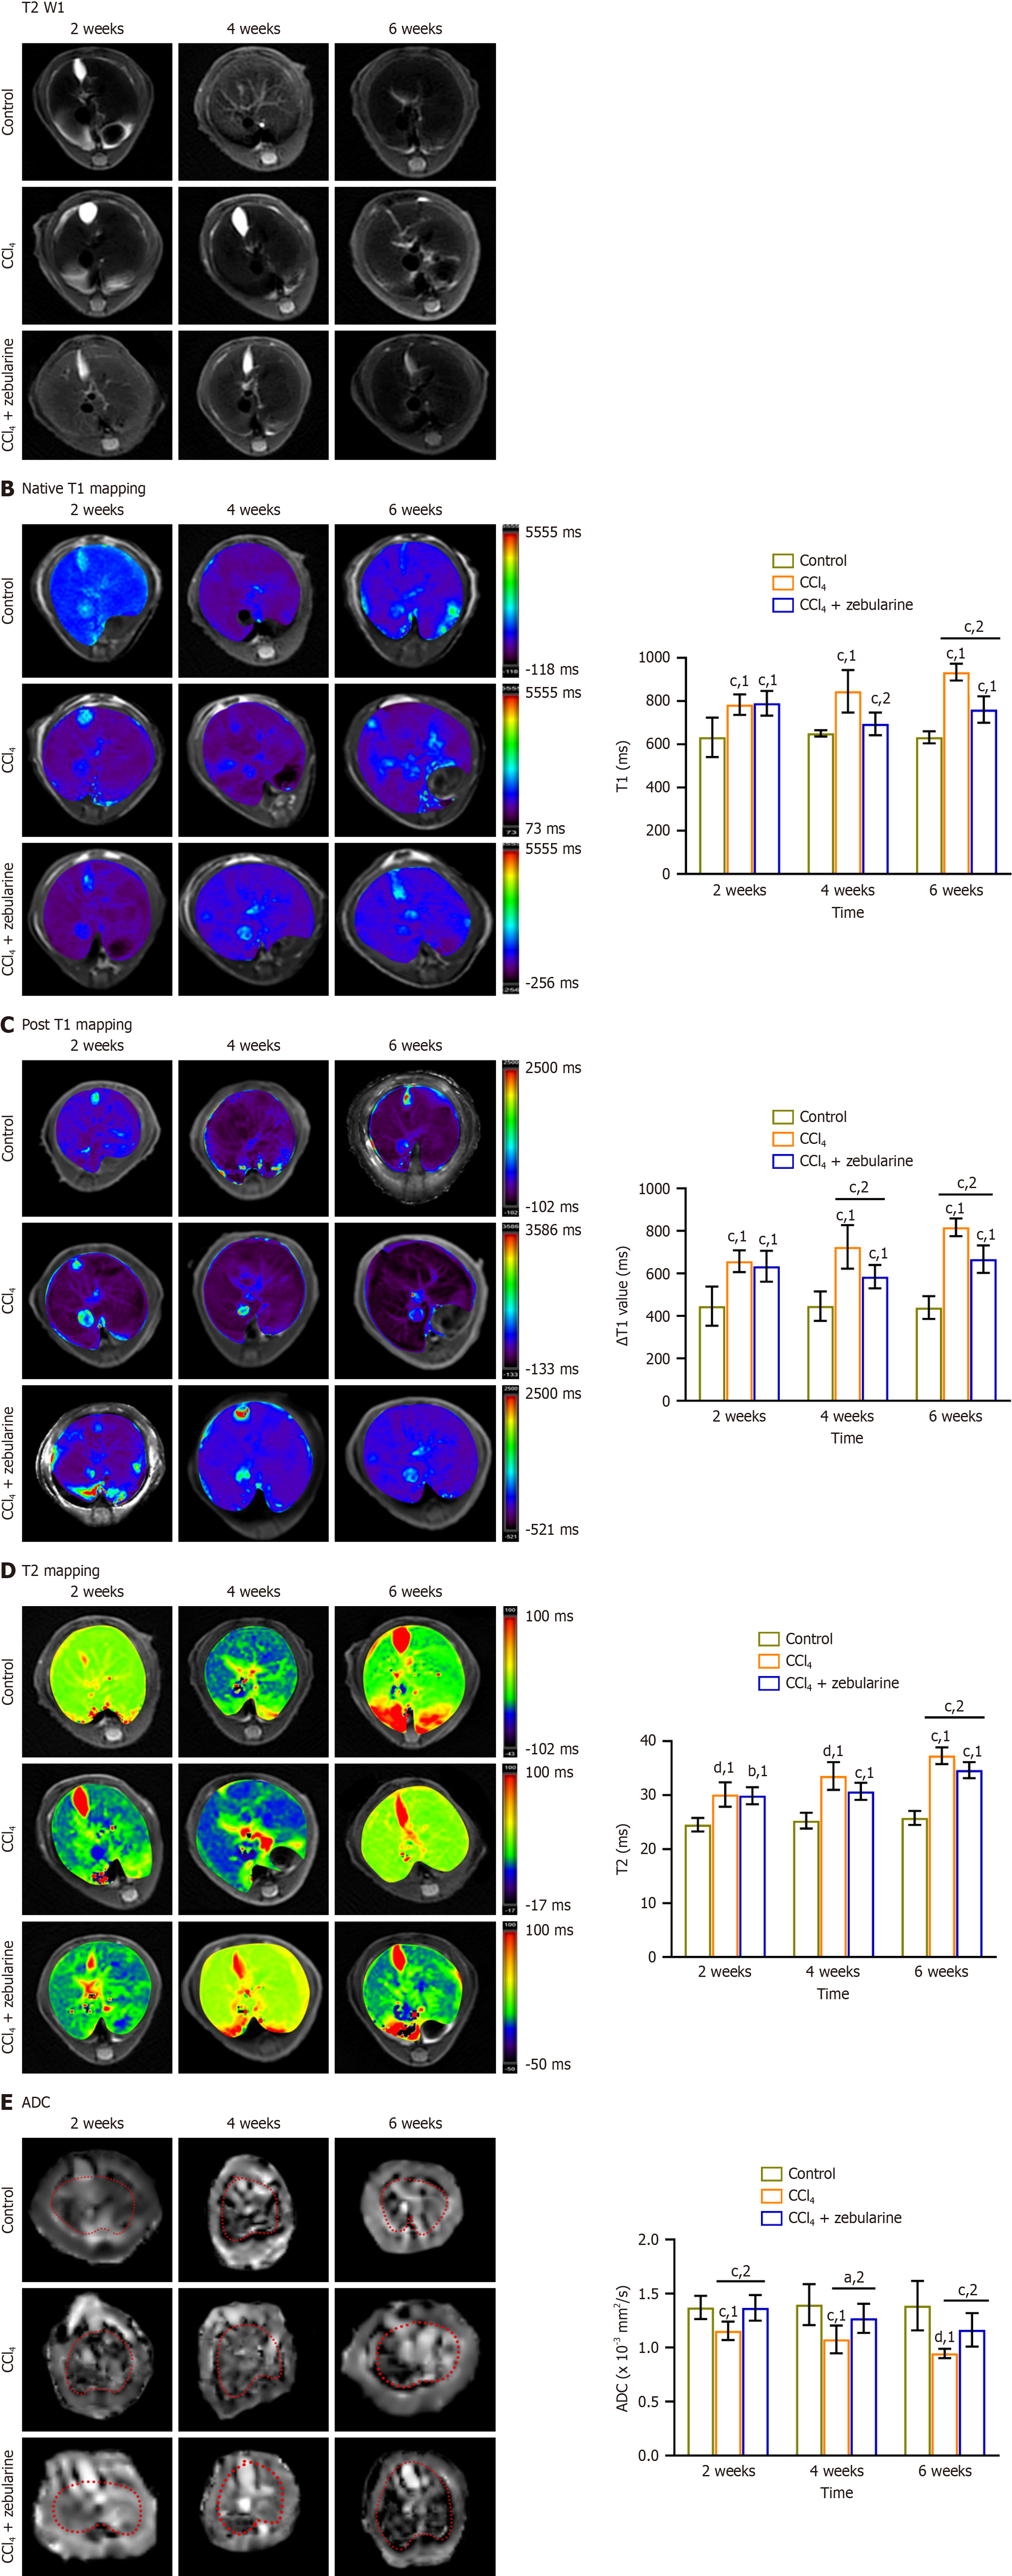
The liver lobe structure was more clearly observed in the T2-weighted imaging images (Figure 8A).
In the CCl4 group, the T1pre, ∆T1, and T2 values were significantly increased, whereas ADC values were notably reduced compared to the control group (all P < 0.001). In contrast, compared with the CCl4 group, the CCl4 + zebularine treatment group exhibited a decrease in T1pre, DT1 and T2 values, along with an increase in ADC values, with the change in ADC reaching statistical significance at 2 weeks. At 4 weeks, the T1pre, DT1, and ADC values were significantly different (P < 0.05), and at 6 weeks, all parameters showed significant differences (P < 0.01). Multi-parameter MRI effectively detected the therapeutic effects of zebularine in the liver fibrosis mouse model at week 6 (Table 6, Figure 8B-E).
| Parameters | 2 weeks | 4 weeks | 6 weeks | |||||||||
| Control | CCl4 | CCl4 + zebularine | P value | Control | CCl4 | CCl4 + zebularine | P value | Control | CCl4 | CCl4 + zebularine | P value | |
| T1pre (millisecond) | 632.554 ± 91.474 | 783.493 ± 47.454 | 790.09 ± 57.283 | 1.000 | 650.917 ± 14.543 | 845.448 ± 98.6 | 694.370 ± 52.447 | < 0.001 | 632.712 ± 27.834 | 934.073 ± 38.4291 | 760.6564 ± 61.1215 | < 0.001 |
| △T1 | 445.771 ± 91.877 | 657.431 ± 51.533 | 633.599 ± 72.49 | 1.000 | 445.996 ± 69.364 | 724.751 ± 102.433 | 584.67 ± 55.173 | < 0.001 | 439.015 ± 53.865 | 816.836 ± 41.547 | 666.994 ± 64.864 | < 0.001 |
| T2 (millisecond) | 24.54 ± 1.253 | 30.124 ± 2.269 | 29.9 ± 1.592 | 1.000 | 25.278 ± 1.473 | 33.544 ± 2.575 | 30.698 ± 1.582 | 0.12 | 25.777 ± 1.304 | 37.305 ± 1.547 | 34.641 ± 1.489 | < 0.001 |
| ADC (× 10-3, mm2/second) | 1.397 ± 0.190 | 1.076 ± 0.129 | 1.271 ± 0.135 | < 0.001 | 1.178 ± 0.099 | 1.028 ± 0.106 | 1.454 ± 0.147 | 0.012 | 1.388 ± 0.229 | 0.946 ± 0.043 | 1.164 ± 0.155 | 0.005 |
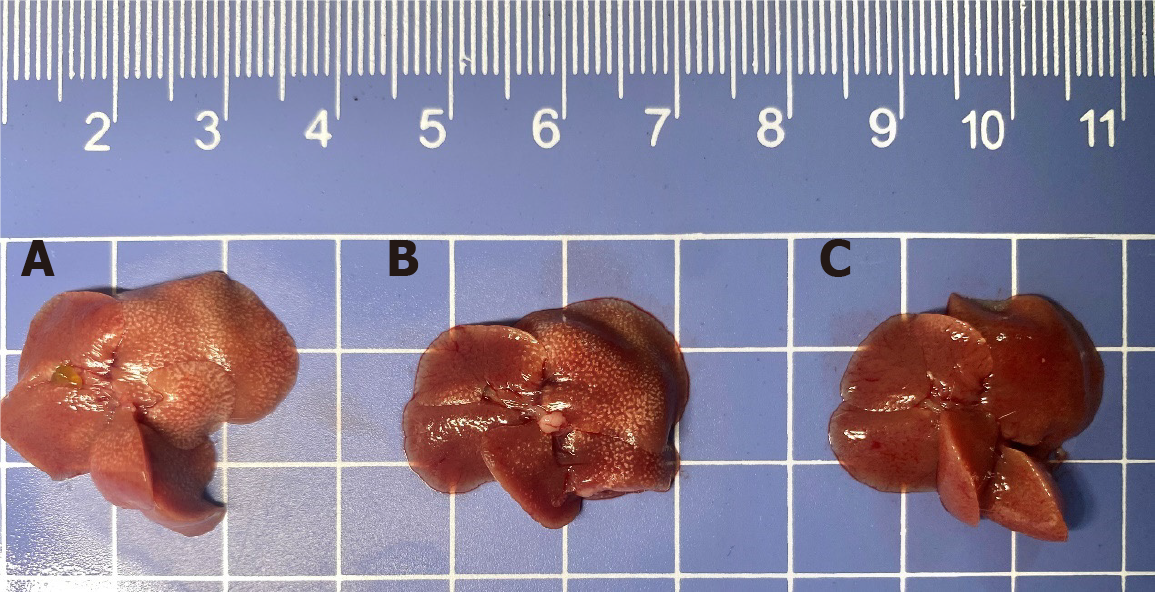
Liver volumes in the CCl4 group were visibly larger than those observed in the control and treatment groups (Figure 9). The average weight loss in the CCl4 group was 11% (P < 0.01) but only 3% in the CCl4 + zebularine group (P > 0.05) relative to that in the control group. Conversely, the CCl4 + zebularine group exhibited a weight gain of 8% compared with the group treated with CCl4 at 6 weeks (P < 0.05, Figure 10A). The mean liver mass was increased by 31% in the CCl4 group (P < 0.0001) and by 16% in the CCl4 + zebularine group (P < 0.01) compared to the control group. However, the 15% reduction in mean liver weight between the CCl4 + zebularine and the CCl4 group at 6 weeks did not reach statistical significance (P > 0.05, Figure 10B). Analysis of the HSI revealed that compared to the control group, the CCl4 group exhibited significantly higher HSI (P < 0.05). In contrast, The HSI of the CCl4 + zebularine group was lower than that of the CCl4 group, with statistically significant differences becoming evident at 4 weeks (P < 0.05). However, the HSI of the CCl4 + zebularine group remained elevated compared to that of the control group (Figure 10C).
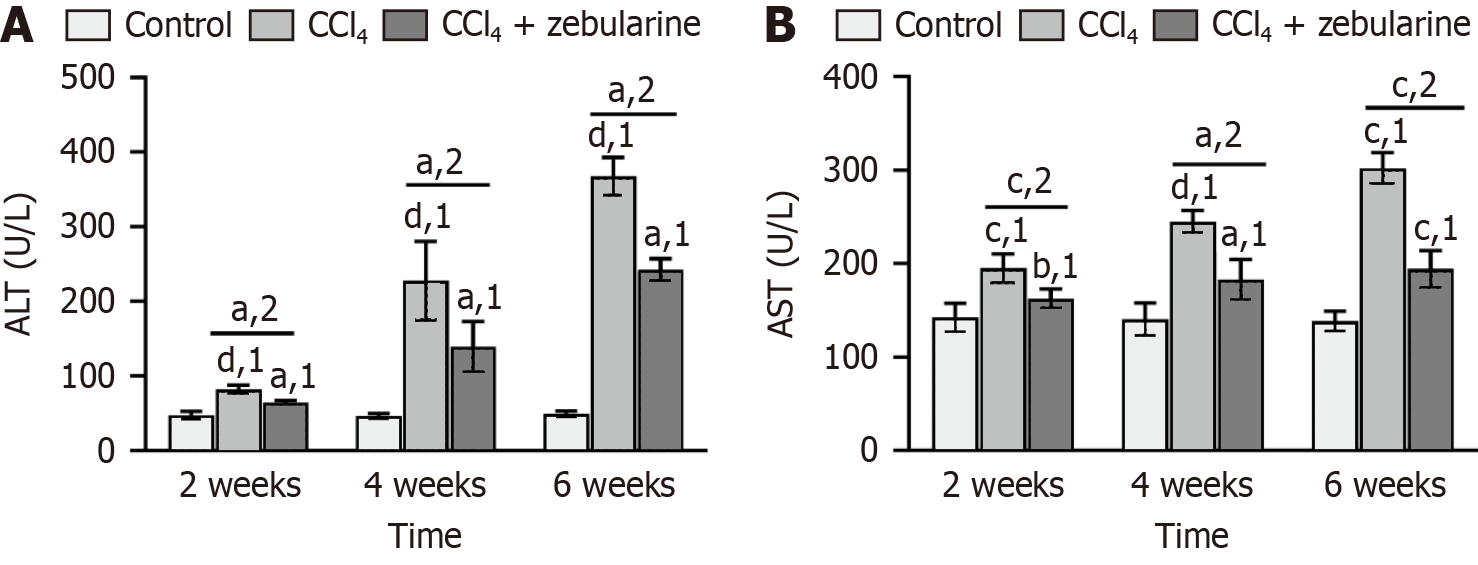
Serum ALT and AST levels were significantly elevated in the CCl4 group compared with the control group at each of the three time points (2 weeks, 4 weeks, and 6 weeks) (all P < 0.001). However, in the CCl4+zebularine group, serum ALT and AST levels were lower than those in the CCl4 group (all P < 0.05), although they remained higher than those in the control group. Intraperitoneal injection of CCl4 caused marked increases in ALT and AST levels, whereas zebularine treatment reduced these levels, although it did not restore them to normal levels (Figure 11).
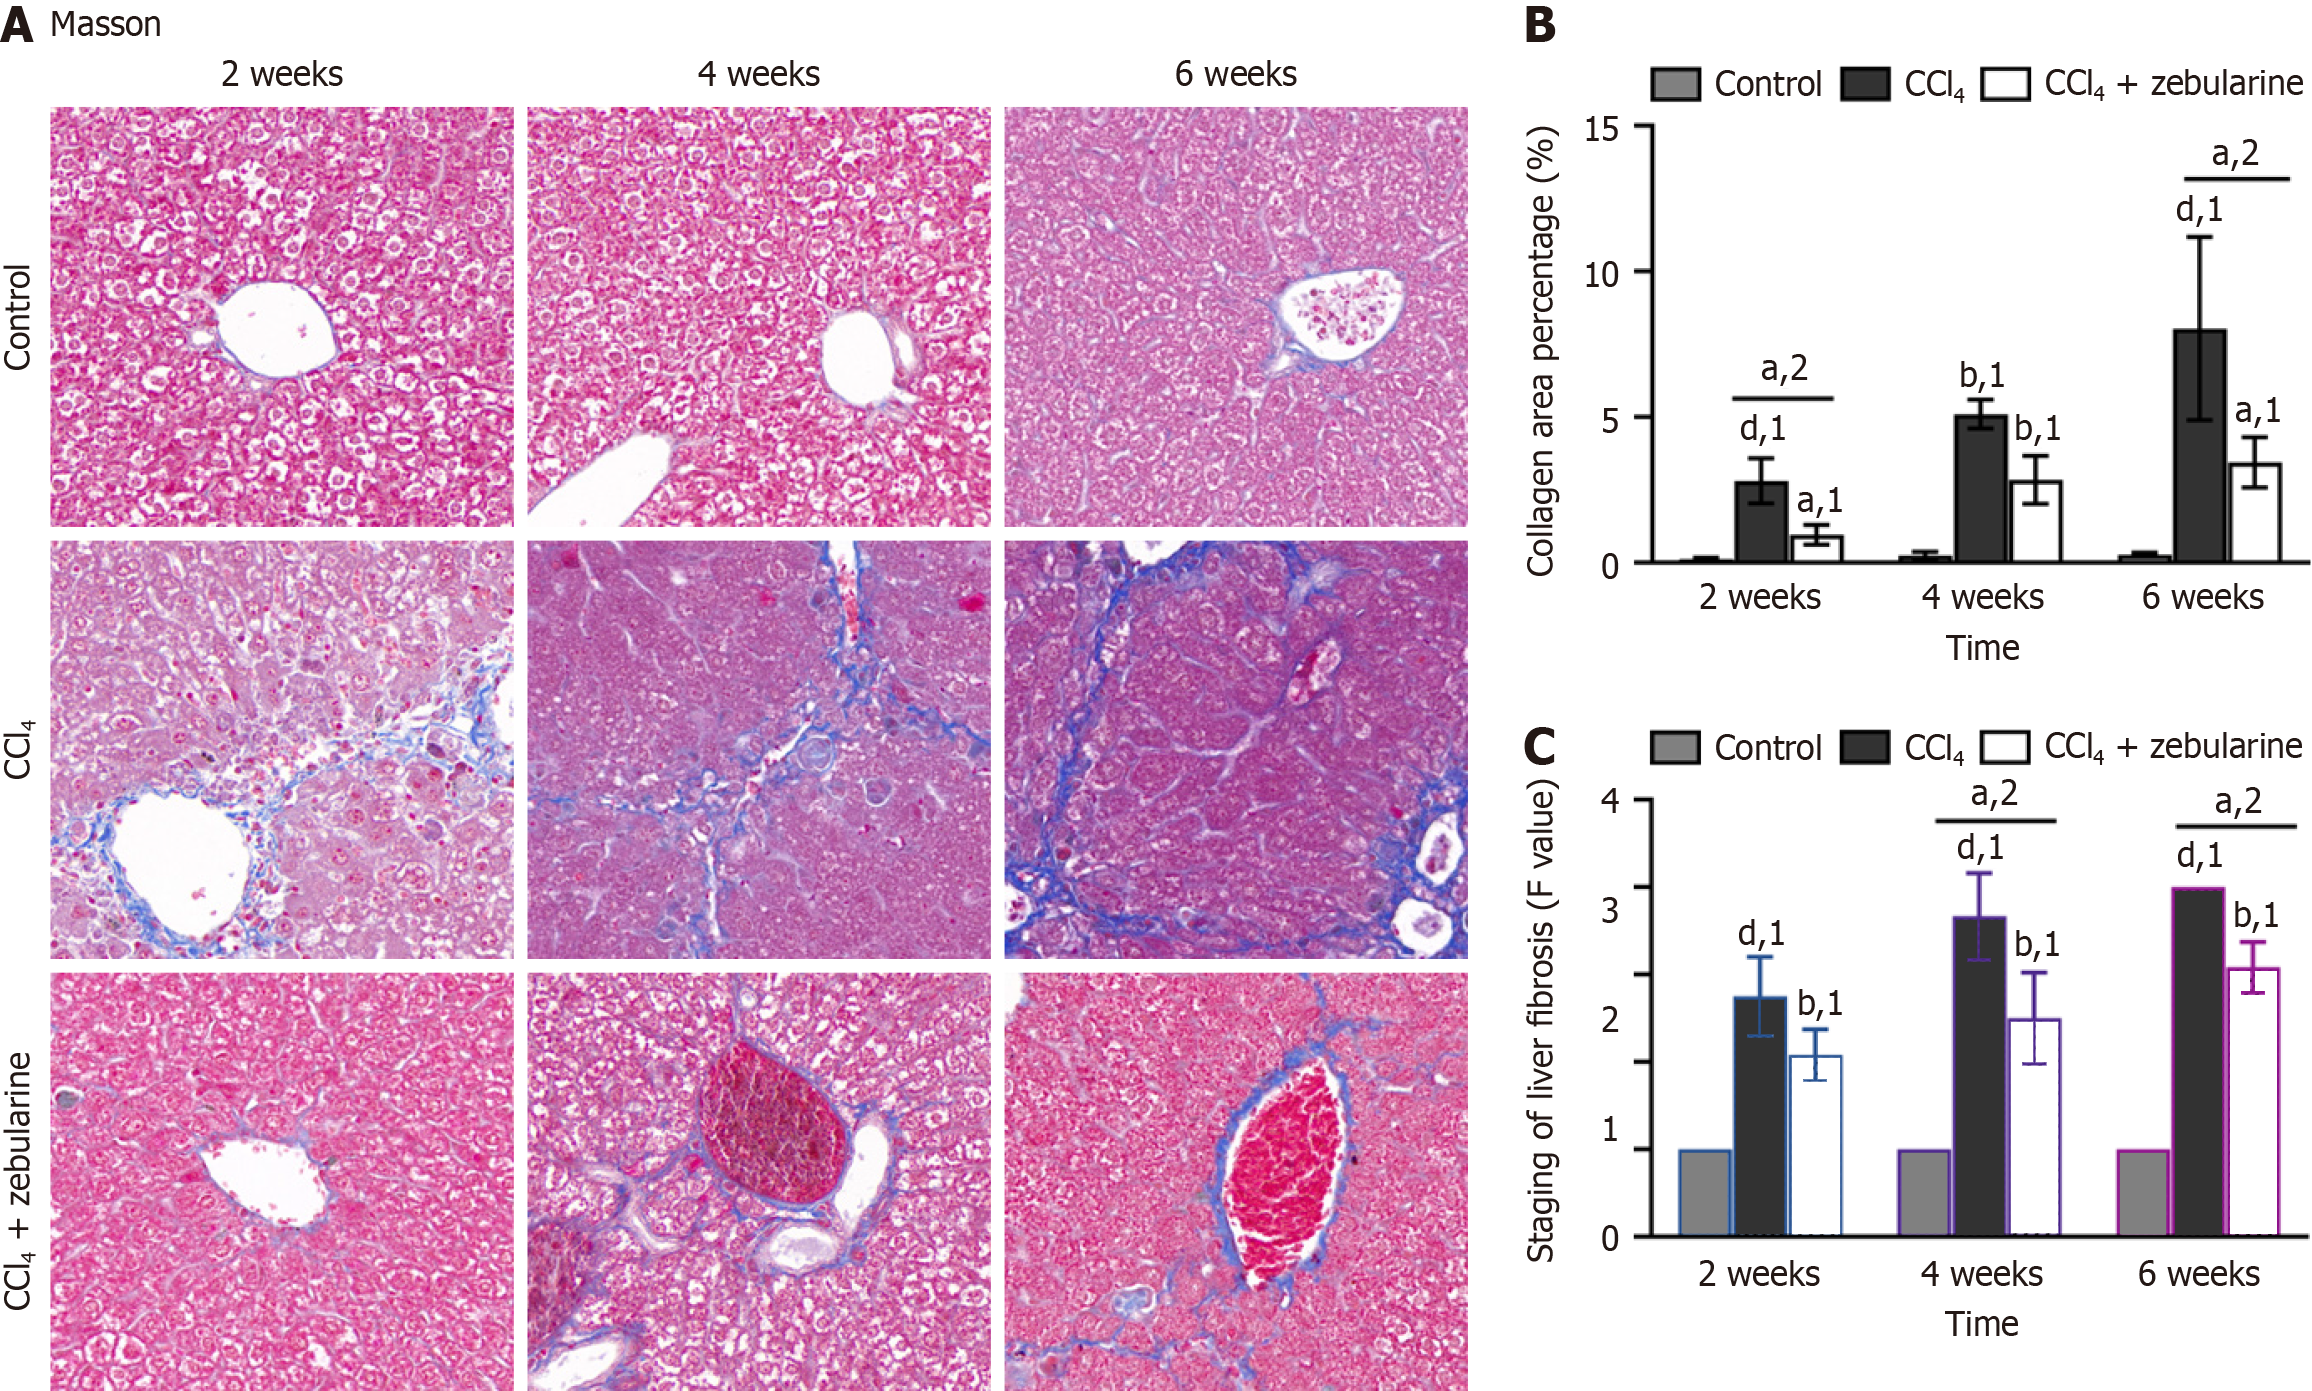
Masson’s trichrome staining revealed that the deposited collagen fibers were interconnected and formed pseudonodules in the liver parenchyma, disrupting liver structure and impairing function (Figure 12A). The proportion of collagen fibers was markedly elevated in the CCl4 group (P < 0.0001). In contrast, the fibrotic percentage in the CCl4+zebularine group was consistently lower than that in the CCl4 group at 2 weeks and 6 weeks (P < 0.05, Figure 12B), with a statistically significant difference in METAVIR fibrosis grading between the two groups becoming evident at 4 weeks (P < 0.05; Figure 12C). At 4 weeks, the percentage of fibrosis was consistently lower in the CCl4 group than in the CCl4 group (both P > 0.05, Figure 12B).
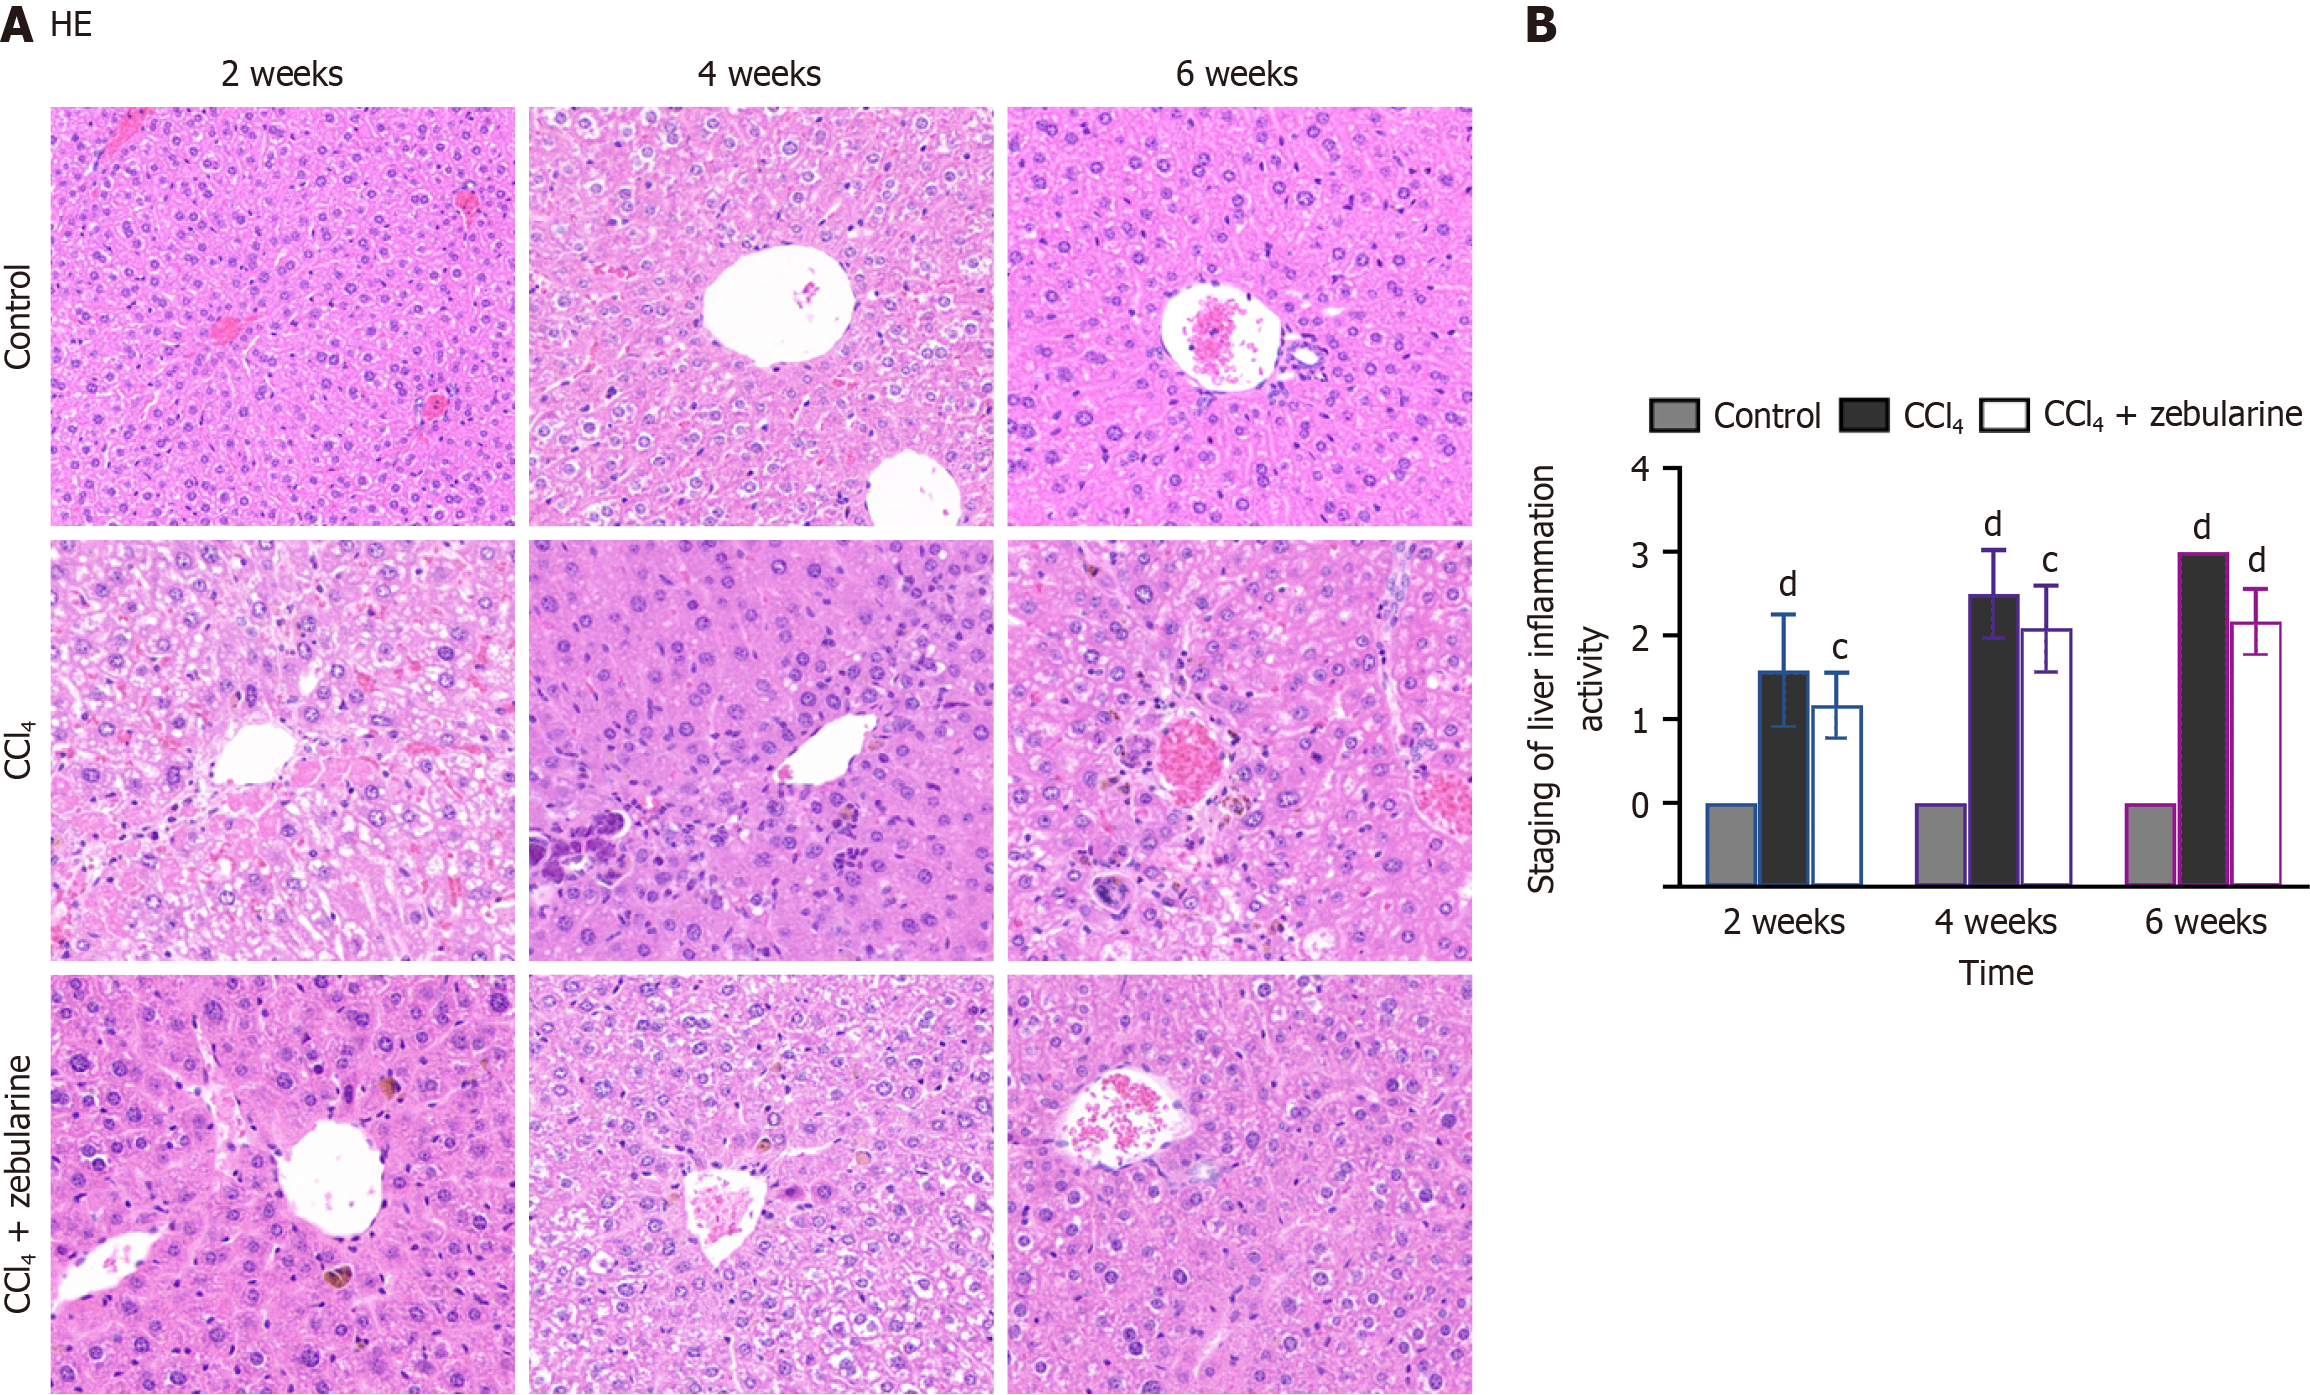
HE staining showed that hepatocyte cords became increasingly disorganized and inflammatory cell infiltration increased with time in the experimental liver injury models, reflecting progression toward more severe liver damage or fibrosis (Figure 13). Compared with the findings in the CCl4 group, the degree of liver tissue necrosis in the CCl4 + zebularine group was relatively mild (P > 0.05). Moreover, the inflammatory scores did not differ between the two groups.
Our study highlights the promising role of zebularine in the treatment of liver fibrosis. Zebularine appears to effectively upregulate RCAN1.4 and inhibit the CaN/NFAT3 signaling pathway, which reduces LX-2 cell activation and ECM deposition in vitro. In vivo, zebularine mitigated liver fibrosis and inflammation while showing consistent results across different MRI parameters (T1pre, DT1, T2, and ADC). By integrating molecular, cellular, and imaging data, we provide a comprehensive approach to evaluating the efficacy of zebularine.
HSC activation contributes to ECM remodeling and fibrosis[23]. Our results-demonstrating reduced α-SMA and CoL1a1 expression following zebularine treatment support the hypothesis that targeting epigenetic mechanisms can modulate HSC activation and ECM composition. Zebularine mitigates TGF-β1-induced activation injury in LX-2 cells by targeting human HSCs and promoting ECM degradation. Specifically, it functions via the RCAN1.4-CaN/NFAT3 signaling pathway.
CaN is an important factor in ECM accumulation, and the CaN/NFAT3 signaling pathway has been implicated in fibrosis across various cells[24]. In this study, zebularine inhibited the CaN/NFAT3 signaling pathway in activated LX-2 cells, a process closely related to the activation and fibrotic progression of HSCs[25]. Previous studies have shown that CaN inhibitors successfully prevent ECM overaccumulation[26-28], which is consistent with our findings. Furthermore, DNMT is upregulated in activated HSCs, resulting in reduced RCAN1.4 expression[10]. This suggests that low RCAN1.4 expression in activated LX-2 cells is associated with DNA methylation. Our study demonstrated that zebularine increased RCAN1.4 expression in activated LX-2 cells, in addition to upregulating the expression of the anti-fibrotic genes SEPTIN9, PTEN, PPAR-γ, and PTCH1, while inhibiting the expression of the fibrotic-related genes α-SMA and CoL1a1. This suggests that in activated LX-2 cells, zebularine upregulates RCAN1.4 and reverses the progression of TGF-β1-induced RCAN1.4-CaN/NFAT3 signaling in fibrosis. Demethylating agents may serve as a new therapeutic approach to inhibit fibrosis by maintaining the hypomethylated state of RCAN1.4, increasing its expression, and inhibiting the CaN/NFAT3 pathway.
However, some studies have reported that RCAN1.4 overexpression does not reduce fibrosis but instead increases fibronectin and CoL1a1 production in mouse glomerular mesangial cells, promoting renal fibrosis[29]. This paradox arises because RCAN1.4 not only acts on the CaN/NFAT3 pathway but also interacts with other proteins, such as regulating nuclear factor κB[30], acting on extracellular regulated protein kinases[31] and Raf[32], to co-regulate the fibrotic process. We propose that a dynamic equilibrium exists in the body, with RCAN1.4 potentially induced by other compounds that activate the CaN/NFAT3 signaling pathway, leading to a negative feedback loop that regulates the pathway. This suggests the presence of a self-regulatory mechanism in fibrosis that helps achieve effective tissue repair and prevents excessive fibrosis that could impair tissue function.
Although zebularine is approximately one-tenth as potent as 5-azacytidine as a demethylating agent, both compounds share similar inhibitory effects on DNMT when tested with small oligodeoxynucleotide fragments[8]. The IC50 values for zebularine were lower in other cells, likely due to differences in cell type, experimental conditions, and methodologies[33-35]. Zebularine is a noteworthy DNMT inhibitor with lower toxicity, better stability, and a stronger safety profile than 5-azacytidine[8]. In this study, we used a higher concentration of zebularine to increase DNA incorporation and improve metabolic activation efficiency, thereby inhibiting HSC activation.
A robust correlation between MRI parameters (T1pre, DT1, and T2) and the severity of liver fibrosis has been well-documented in the literature[36,37]. In the CCl4-induced mouse model of liver fibrosis, differences in the parameters were gradually revealed on MRI after prolonged zebularine treatment. Consistent with previous studies, T1 relaxation time reflects protein and ECM accumulation due to liver fibrosis[38,39]. Our results corroborate these findings, showing both an increase in the extent of fibrosis and a corresponding prolongation of the T1 relaxation time. This is attributable to the sensitivity of T1 mapping to low-frequency movements and static processes, making it a reliable indicator of the presence of macromolecules in an organism[40]. T2 mapping, which is used to quantitatively analyze lesions in chronic liver disease, reflects subtle changes in water molecules in tissues[41]. In this study, as liver fibrosis progressed, T2 relaxation time increased, corresponding to worsening liver fibrosis and inflammation. Additionally, as liver fibrosis aggravated, the DWI increased while ADC values decreased, likely due to the proliferation of collagen fibers limiting molecular movement[42]. ADC values, which reflect the diffusion limitation of molecular movement between tissues, are useful for assessing the stage of liver fibrosis in patients[43]. However, ADC values are not a common indicator of cirrhosis[44]. Therefore, the ability of ADC values to diagnose mild liver fibrosis is not as accurate as ΔT1, T1pre, and T2[45], which aligns with our experimental findings.
Gadoxetate disodium is a paramagnetic contrast agent used for T1-weighted imaging that specifically accumulates in hepatocytes and plays a key role in detecting mild to severe liver fibrosis[46]. Liver fibrosis leads to a decrease in the number of normal cells, which in turn affects the balance between the uptake and excretion of gadoxetate disodium[47], resulting in reduced contrast enhancement of the liver parenchyma in the hepatocyte phase. Our results revealed significant differences in T1 values between the zebularine treatment group and the CCl4 model group beginning at week 4. This suggests that prolonged zebularine administration gradually alleviated fibrosis. Recent MRI scans in a mouse liver fibrosis model showed an increase in ΔT1 value with worsening fibrosis[36], which aligns with our findings. However, in our study, image acquisition was performed immediately after the tail vein injection of the contrast agent, during which the vast majority of the contrast agent remained in the liver. Although opinions differ, a strong correlation between liver fibrosis and ΔT1 has been consistently observed[17]. The statistically significant differences observed at weeks 4 and 6 suggest that longitudinal studies and longer treatment periods may be required to detect the measurable effects of zebularine treatment on MRI parameters related to liver fibrosis.
Animal organ weights and organ-to-body ratios are commonly used in drug safety evaluation[48]. Early hepatic fibrosis leads to ECM and collagen fiber proliferation, which increases liver weight and HSI[36]. This suggests that CCl4 increases liver mass but decreases body weight in mice, whereas zebularine treatment alleviates disease progression. These findings suggest that zebularine holds promise as a therapeutic agent for liver fibrosis and underscores its role in reducing collagen deposition.
In LX-2 cells stimulated with TGF-β1, zebularine exerted its antifibrotic effects through gene demethylation, parti
This study has some limitations. First, the exact molecular mechanism of zebularine in the regulation of other signaling pathways involved in liver fibrosis remains unclear and requires further investigation. Second, although multiparametric MRI was effective in assessing fibrosis, the results were based on a preclinical mouse model, and translation to human studies is yet to be validated. Additionally, the long-term safety and efficacy of zebularine in the treatment of liver fibrosis require further exploration through larger, more extended clinical studies.
Zebularine demonstrated a multifaceted antifibrotic effect, primarily through its effects on the regulation of gene ex
| 1. | Chen L, Wu T, Fan R, Qian YS, Liu JF, Bai J, Zheng B, Liu XL, Zheng D, Du LT, Jiang GQ, Wang YC, Fan XT, Deng GH, Wang CY, Shen F, Hu HP, Zhang QZ, Ye YN, Zhang J, Gao YH, Xia J, Yan HD, Liang MF, Yu YL, Sun FM, Gao YJ, Sun J, Zhong CX, Wang Y, Wang H, Kong F, Chen JM, Wen H, Wu BM, Wang CX, Wu L, Hou JL, Wang HY. Cell-free DNA testing for early hepatocellular carcinoma surveillance. EBioMedicine. 2024;100:104962. [RCA] [PubMed] [DOI] [Full Text] [Full Text (PDF)] [Cited by in Crossref: 8] [Cited by in RCA: 11] [Article Influence: 11.0] [Reference Citation Analysis (0)] |
| 2. | Meurer SK, Karsdal MA, Weiskirchen R. Advances in the clinical use of collagen as biomarker of liver fibrosis. Expert Rev Mol Diagn. 2020;20:947-969. [RCA] [PubMed] [DOI] [Full Text] [Cited by in Crossref: 6] [Cited by in RCA: 13] [Article Influence: 2.6] [Reference Citation Analysis (0)] |
| 3. | Chinese Society of Hepatology; Chinese Medical Association; Chinese Society of Gastroenterology, Chinese Medical Association; Chinese Society of Infectious Diseases, Chinese Medical Association. Consensus on the diagnosis and treatment of hepatic fibrosis (2019). J Dig Dis. 2020;21:127-138. [RCA] [PubMed] [DOI] [Full Text] [Cited by in Crossref: 7] [Cited by in RCA: 22] [Article Influence: 4.4] [Reference Citation Analysis (0)] |
| 4. | Gao J, Wei B, de Assuncao TM, Liu Z, Hu X, Ibrahim S, Cooper SA, Cao S, Shah VH, Kostallari E. Hepatic stellate cell autophagy inhibits extracellular vesicle release to attenuate liver fibrosis. J Hepatol. 2020;73:1144-1154. [RCA] [PubMed] [DOI] [Full Text] [Cited by in Crossref: 99] [Cited by in RCA: 216] [Article Influence: 43.2] [Reference Citation Analysis (0)] |
| 5. | Dewidar B, Meyer C, Dooley S, Meindl-Beinker AN. TGF-β in Hepatic Stellate Cell Activation and Liver Fibrogenesis-Updated 2019. Cells. 2019;8. [RCA] [PubMed] [DOI] [Full Text] [Full Text (PDF)] [Cited by in Crossref: 214] [Cited by in RCA: 539] [Article Influence: 89.8] [Reference Citation Analysis (0)] |
| 6. | Koyama Y, Brenner DA. Liver inflammation and fibrosis. J Clin Invest. 2017;127:55-64. [RCA] [PubMed] [DOI] [Full Text] [Cited by in Crossref: 548] [Cited by in RCA: 903] [Article Influence: 112.9] [Reference Citation Analysis (0)] |
| 7. | Moran-Salvador E, Garcia-Macia M, Sivaharan A, Sabater L, Zaki MYW, Oakley F, Knox A, Page A, Luli S, Mann J, Mann DA. Fibrogenic Activity of MECP2 Is Regulated by Phosphorylation in Hepatic Stellate Cells. Gastroenterology. 2019;157:1398-1412.e9. [RCA] [PubMed] [DOI] [Full Text] [Cited by in Crossref: 20] [Cited by in RCA: 34] [Article Influence: 5.7] [Reference Citation Analysis (0)] |
| 8. | Lyu SY, Xiao W, Cui GZ, Yu C, Liu H, Lyu M, Kuang QY, Xiao EH, Luo YH. Role and mechanism of DNA methylation and its inhibitors in hepatic fibrosis. Front Genet. 2023;14:1124330. [RCA] [PubMed] [DOI] [Full Text] [Cited by in Crossref: 1] [Reference Citation Analysis (0)] |
| 9. | Kong D, Zhang Z, Chen L, Huang W, Zhang F, Wang L, Wang Y, Cao P, Zheng S. Curcumin blunts epithelial-mesenchymal transition of hepatocytes to alleviate hepatic fibrosis through regulating oxidative stress and autophagy. Redox Biol. 2020;36:101600. [RCA] [PubMed] [DOI] [Full Text] [Full Text (PDF)] [Cited by in Crossref: 64] [Cited by in RCA: 170] [Article Influence: 34.0] [Reference Citation Analysis (0)] |
| 10. | Pan XY, You HM, Wang L, Bi YH, Yang Y, Meng HW, Meng XM, Ma TT, Huang C, Li J. Methylation of RCAN1.4 mediated by DNMT1 and DNMT3b enhances hepatic stellate cell activation and liver fibrogenesis through Calcineurin/NFAT3 signaling. Theranostics. 2019;9:4308-4323. [RCA] [PubMed] [DOI] [Full Text] [Full Text (PDF)] [Cited by in Crossref: 34] [Cited by in RCA: 44] [Article Influence: 7.3] [Reference Citation Analysis (0)] |
| 11. | Asada K, Kaji K, Sato S, Seki K, Shimozato N, Kawaratani H, Takaya H, Sawada Y, Nakanishi K, Furukawa M, Kitade M, Moriya K, Namisaki T, Noguchi R, Akahane T, Yoshiji H. Hydralazine Sensitizes to the Antifibrotic Effect of 5-Aza-2'-deoxycytidine in Hepatic Stellate Cells. Biology (Basel). 2020;9. [RCA] [PubMed] [DOI] [Full Text] [Full Text (PDF)] [Cited by in Crossref: 4] [Reference Citation Analysis (0)] |
| 12. | Zhang Z, Chen XX, Dong RK, Dong YF. [The effect of zebularine on p16 mRNA expression in SGC-7901 cell line]. Zhongguo Putong Waike Zazhi. 2015;24:889-891. [DOI] [Full Text] |
| 13. | Koh ES, Kim S, Son M, Park JY, Pyo J, Kim WY, Kim M, Chung S, Park CW, Kim HS, Shin SJ. The Protective Effect of Zebularine, an Inhibitor of DNA Methyltransferase, on Renal Tubulointerstitial Inflammation and Fibrosis. Int J Mol Sci. 2022;23. [RCA] [PubMed] [DOI] [Full Text] [Cited by in RCA: 5] [Reference Citation Analysis (0)] |
| 14. | Huang SK, Fisher AS, Scruggs AM, White ES, Hogaboam CM, Richardson BC, Peters-Golden M. Hypermethylation of PTGER2 confers prostaglandin E2 resistance in fibrotic fibroblasts from humans and mice. Am J Pathol. 2010;177:2245-2255. [RCA] [PubMed] [DOI] [Full Text] [Cited by in Crossref: 111] [Cited by in RCA: 117] [Article Influence: 7.8] [Reference Citation Analysis (0)] |
| 15. | Kisseleva T, Brenner D. Molecular and cellular mechanisms of liver fibrosis and its regression. Nat Rev Gastroenterol Hepatol. 2021;18:151-166. [RCA] [PubMed] [DOI] [Full Text] [Cited by in Crossref: 274] [Cited by in RCA: 1167] [Article Influence: 291.8] [Reference Citation Analysis (0)] |
| 16. | Yamamoto A, Nagao M, Inoue A, Nakao R, Sakai R, Nishina Y, Morita S, Sakai A, Kogiso T, Kaneko K, Tokushige K, Inai K, Sakai S, Yamaguchi J. Prediction of hepatocellular carcinoma in patients with Fontan-associated liver disease using gadolinium ethoxybenzyl diethylenetriamine pentaacetic acid magnetic resonance imaging. Hepatol Res. 2024. [PubMed] [DOI] [Full Text] |
| 17. | Liu JY, Ding ZY, Zhou ZY, Dai SZ, Zhang J, Li H, Du Q, Cai YY, Shang QL, Luo YH, Xiao EH. Multiparameter magnetic resonance imaging of liver fibrosis in a bile duct ligation mouse model. World J Gastroenterol. 2021;27:8156-8165. [RCA] [PubMed] [DOI] [Full Text] [Full Text (PDF)] [Cited by in CrossRef: 2] [Cited by in RCA: 4] [Article Influence: 1.0] [Reference Citation Analysis (0)] |
| 18. | Liu JY, Cai YY, Ding ZY, Zhou ZY, Lv M, Liu H, Zheng LY, Li L, Luo YH, Xiao EH. Characterizing Fibrosis and Inflammation in a Partial Bile Duct Ligation Mouse Model by Multiparametric Magnetic Resonance Imaging. J Magn Reson Imaging. 2022;55:1864-1874. [RCA] [PubMed] [DOI] [Full Text] [Full Text (PDF)] [Cited by in RCA: 8] [Reference Citation Analysis (0)] |
| 19. | Gao Y, Li X, Gao Q, Fan L, Jin H, Guo Y. Differential effects of olive oil, soybean oil, corn oil and lard oil on carbon tetrachloride-induced liver fibrosis in mice. Biosci Rep. 2019;39. [RCA] [PubMed] [DOI] [Full Text] [Full Text (PDF)] [Cited by in Crossref: 4] [Cited by in RCA: 10] [Article Influence: 2.0] [Reference Citation Analysis (0)] |
| 20. | Bedossa P, Patel K. Biopsy and Noninvasive Methods to Assess Progression of Nonalcoholic Fatty Liver Disease. Gastroenterology. 2016;150:1811-1822.e4. [RCA] [PubMed] [DOI] [Full Text] [Cited by in Crossref: 71] [Cited by in RCA: 90] [Article Influence: 10.0] [Reference Citation Analysis (0)] |
| 21. | Bedossa P, Poitou C, Veyrie N, Bouillot JL, Basdevant A, Paradis V, Tordjman J, Clement K. Histopathological algorithm and scoring system for evaluation of liver lesions in morbidly obese patients. Hepatology. 2012;56:1751-1759. [RCA] [PubMed] [DOI] [Full Text] [Cited by in Crossref: 526] [Cited by in RCA: 648] [Article Influence: 49.8] [Reference Citation Analysis (0)] |
| 22. | Wang C, Zheng L, Li Y, Xia S, Lv J, Hu X, Zhan W, Yan F, Li R, Ren X. Noninvasive Assessment of Liver Fibrosis and Inflammation in Chronic Hepatitis B: A Dual-task Convolutional Neural Network (DtCNN) Model Based on Ultrasound Shear Wave Elastography. J Clin Transl Hepatol. 2022;10:1077-1085. [RCA] [PubMed] [DOI] [Full Text] [Full Text (PDF)] [Cited by in RCA: 1] [Reference Citation Analysis (1)] |
| 23. | Li X, Li Y, Zhang W, Jiang F, Lin L, Wang Y, Wu L, Zeng H, Zheng J. The IGF2BP3/Notch/Jag1 pathway: A key regulator of hepatic stellate cell ferroptosis in liver fibrosis. Clin Transl Med. 2024;14:e1793. [RCA] [PubMed] [DOI] [Full Text] [Reference Citation Analysis (0)] |
| 24. | Zhang J, Chen H, Weng X, Liu H, Chen Z, Huang Q, Wang L, Liu X. RCAN1.4 attenuates renal fibrosis through inhibiting calcineurin-mediated nuclear translocation of NFAT2. Cell Death Discov. 2021;7:317. [RCA] [PubMed] [DOI] [Full Text] [Full Text (PDF)] [Cited by in Crossref: 1] [Cited by in RCA: 1] [Article Influence: 0.3] [Reference Citation Analysis (0)] |
| 25. | Lin Y, Song Y, Zhang Y, Shi M, Hou A, Han S. NFAT signaling dysregulation in cancer: Emerging roles in cancer stem cells. Biomed Pharmacother. 2023;165:115167. [RCA] [PubMed] [DOI] [Full Text] [Cited by in RCA: 13] [Reference Citation Analysis (0)] |
| 26. | Gooch JL, Tang Y, Ricono JM, Abboud HE. Insulin-like growth factor-I induces renal cell hypertrophy via a calcineurin-dependent mechanism. J Biol Chem. 2001;276:42492-42500. [RCA] [PubMed] [DOI] [Full Text] [Cited by in Crossref: 55] [Cited by in RCA: 59] [Article Influence: 2.5] [Reference Citation Analysis (0)] |
| 27. | Lim HW, De Windt LJ, Steinberg L, Taigen T, Witt SA, Kimball TR, Molkentin JD. Calcineurin expression, activation, and function in cardiac pressure-overload hypertrophy. Circulation. 2000;101:2431-2437. [RCA] [PubMed] [DOI] [Full Text] [Cited by in Crossref: 98] [Cited by in RCA: 103] [Article Influence: 4.1] [Reference Citation Analysis (0)] |
| 28. | Murat A, Pellieux C, Brunner HR, Pedrazzini T. Calcineurin blockade prevents cardiac mitogen-activated protein kinase activation and hypertrophy in renovascular hypertension. J Biol Chem. 2000;275:40867-40873. [RCA] [PubMed] [DOI] [Full Text] [Cited by in Crossref: 44] [Cited by in RCA: 47] [Article Influence: 1.9] [Reference Citation Analysis (0)] |
| 29. | Jang C, Lim JH, Park CW, Cho YJ. Regulator of Calcineurin 1 Isoform 4 (RCAN1.4) Is Overexpressed in the Glomeruli of Diabetic Mice. Korean J Physiol Pharmacol. 2011;15:299-305. [RCA] [PubMed] [DOI] [Full Text] [Cited by in Crossref: 17] [Cited by in RCA: 19] [Article Influence: 1.4] [Reference Citation Analysis (0)] |
| 30. | Bao M, Hua X, Mo H, Sun Z, Xu B, Chen X, Xu M, Xu X, Song J. N-Acetylcysteine, an ROS Inhibitor, Alleviates the Pathophysiology of Hyperthyroidism-Induced Cardiomyopathy via the ROS/Ca(2+) Pathway. Biomolecules. 2022;12. [RCA] [PubMed] [DOI] [Full Text] [Full Text (PDF)] [Cited by in RCA: 7] [Reference Citation Analysis (0)] |
| 31. | Kim SS, Lee EH, Shin JH, Seo SR. MAP kinase/ERK kinase 1 (MEK1) phosphorylates regulator of calcineurin 1 (RCAN1) to regulate neuronal differentiation. J Cell Physiol. 2022;237:1406-1417. [RCA] [PubMed] [DOI] [Full Text] [Reference Citation Analysis (0)] |
| 32. | Serrano-Candelas E, Alemán-Muench G, Solé-Sánchez S, Aubareda A, Martínez-Høyer S, Adán J, Aranguren-Ibáñez Á, Pritchard MA, Soldevila G, Pérez-Riba M. RCAN 1 and 3 proteins regulate thymic positive selection. Biochem Biophys Res Commun. 2015;460:295-301. [RCA] [PubMed] [DOI] [Full Text] [Cited by in Crossref: 3] [Cited by in RCA: 3] [Article Influence: 0.3] [Reference Citation Analysis (0)] |
| 33. | Wei TT, Lin YT, Tang SP, Luo CK, Tsai CT, Shun CT, Chen CC. Metabolic targeting of HIF-1α potentiates the therapeutic efficacy of oxaliplatin in colorectal cancer. Oncogene. 2020;39:414-427. [RCA] [PubMed] [DOI] [Full Text] [Cited by in Crossref: 22] [Cited by in RCA: 47] [Article Influence: 7.8] [Reference Citation Analysis (0)] |
| 34. | Jin X, Li Y, Guo Y, Jia Y, Qu H, Lu Y, Song P, Zhang X, Shao Y, Qi D, Xu W, Quan C. ERα is required for suppressing OCT4-induced proliferation of breast cancer cells via DNMT1/ISL1/ERK axis. Cell Prolif. 2019;52:e12612. [RCA] [PubMed] [DOI] [Full Text] [Full Text (PDF)] [Cited by in Crossref: 15] [Cited by in RCA: 27] [Article Influence: 4.5] [Reference Citation Analysis (0)] |
| 35. | Luo YH, Chen J, Xiao EH, Li QY, Luo YM. Zebularine Promotes Hepatic Differentiation of Rabbit Bone Marrow Mesenchymal Stem Cells by Interfering with p38 MAPK Signaling. Stem Cells Int. 2018;2018:9612512. [RCA] [PubMed] [DOI] [Full Text] [Full Text (PDF)] [Cited by in Crossref: 2] [Cited by in RCA: 2] [Article Influence: 0.3] [Reference Citation Analysis (0)] |
| 36. | Qiuling L, Qilin Y, Cheng Y, Minping Z, Kangning W, Enhua X. The application of a novel platform of multiparametric magnetic resonance imaging in a bioenvironmental toxic carbon tetrachloride-induced mouse model of liver fibrosis. Environ Res. 2023;238:117130. [RCA] [PubMed] [DOI] [Full Text] [Reference Citation Analysis (0)] |
| 37. | Lu Y, Wang Q, Zhang T, Li J, Liu H, Yao D, Hou L, Tu B, Wang D. Staging Liver Fibrosis: Comparison of Native T1 Mapping, T2 Mapping, and T1ρ: An Experimental Study in Rats With Bile Duct Ligation and Carbon Tetrachloride at 11.7 T MRI. J Magn Reson Imaging. 2022;55:507-517. [RCA] [PubMed] [DOI] [Full Text] [Cited by in RCA: 7] [Reference Citation Analysis (0)] |
| 38. | Allkemper T, Sagmeister F, Cicinnati V, Beckebaum S, Kooijman H, Kanthak C, Stehling C, Heindel W. Evaluation of fibrotic liver disease with whole-liver T1ρ MR imaging: a feasibility study at 1.5 T. Radiology. 2014;271:408-415. [RCA] [PubMed] [DOI] [Full Text] [Cited by in Crossref: 69] [Cited by in RCA: 100] [Article Influence: 8.3] [Reference Citation Analysis (0)] |
| 39. | Jiang J, Huang B, Bin G, Chen S, Feng F, Zou L. An experimental study on the assessment of rabbit hepatic fibrosis by using magnetic resonance T1ρ imaging. Magn Reson Imaging. 2016;34:308-311. [RCA] [PubMed] [DOI] [Full Text] [Cited by in Crossref: 7] [Cited by in RCA: 5] [Article Influence: 0.6] [Reference Citation Analysis (0)] |
| 40. | Nauffal V, Klarqvist MDR, Hill MC, Pace DF, Di Achille P, Choi SH, Rämö JT, Pirruccello JP, Singh P, Kany S, Hou C, Ng K, Philippakis AA, Batra P, Lubitz SA, Ellinor PT. Noninvasive assessment of organ-specific and shared pathways in multi-organ fibrosis using T1 mapping. Nat Med. 2024;30:1749-1760. [RCA] [PubMed] [DOI] [Full Text] [Cited by in Crossref: 2] [Reference Citation Analysis (0)] |
| 41. | Wang XP, Yang DW, Yang ZH. [Research Progress in Quantitative Assessment of Pathological Changes of Chronic Liver Disease via MRI]. Zhongguo Yixue Yingxiangxue Zazhi. 2022;30:172-178. [DOI] [Full Text] |
| 42. | Bakan AA, Inci E, Bakan S, Gokturk S, Cimilli T. Utility of diffusion-weighted imaging in the evaluation of liver fibrosis. Eur Radiol. 2012;22:682-687. [RCA] [PubMed] [DOI] [Full Text] [Cited by in Crossref: 56] [Cited by in RCA: 57] [Article Influence: 4.1] [Reference Citation Analysis (0)] |
| 43. | Hu G, Zhang X, Liang W, Zhong X, Chan Q, Lin X, Lin T, Li Y, Quan X. Assessment of liver fibrosis in rats by MRI with apparent diffusion coefficient and T1 relaxation time in the rotating frame. J Magn Reson Imaging. 2016;43:1082-1089. [RCA] [PubMed] [DOI] [Full Text] [Cited by in Crossref: 20] [Cited by in RCA: 21] [Article Influence: 2.1] [Reference Citation Analysis (0)] |
| 44. | Yang ZH, Xie JY, Hu BF, Zhang YW, Zhou C. [Evaluation of Liver Cirrhosis with Diffusion-weighted MR Imaging: An Experimental Study]. Zhongguo Yixue Yingxiang Jishu. 2002;18:849-851. [DOI] [Full Text] |
| 45. | Zhang H, Yang Q, Yu T, Chen X, Huang J, Tan C, Liang B, Guo H. Comparison of T2, T1rho, and diffusion metrics in assessment of liver fibrosis in rats. J Magn Reson Imaging. 2017;45:741-750. [RCA] [PubMed] [DOI] [Full Text] [Cited by in Crossref: 28] [Cited by in RCA: 30] [Article Influence: 3.3] [Reference Citation Analysis (0)] |
| 46. | Xie S, Sun Y, Wang L, Yang Z, Luo J, Wang W. Assessment of liver function and liver fibrosis with dynamic Gd-EOB-DTPA-enhanced MRI. Acad Radiol. 2015;22:460-466. [RCA] [PubMed] [DOI] [Full Text] [Cited by in Crossref: 11] [Cited by in RCA: 15] [Article Influence: 1.5] [Reference Citation Analysis (0)] |
| 47. | Zhou ZP, Long LL, Qiu WJ, Cheng G, Huang LJ, Yang TF, Huang ZK. Comparison of 10- and 20-min hepatobiliary phase images on Gd-EOB-DTPA-enhanced MRI T1 mapping for liver function assessment in clinic. Abdom Radiol (NY). 2017;42:2272-2278. [RCA] [PubMed] [DOI] [Full Text] [Cited by in Crossref: 12] [Cited by in RCA: 15] [Article Influence: 1.9] [Reference Citation Analysis (1)] |
| 48. | Cline H, Wei Z, Groeneveld DJ, Hix JML, Xu X, Flick MJ, Palumbo JS, Poole LG, Dockendorff C, Griffin JH, Luyendyk JP. Hepatocyte-independent PAR1-biased signaling controls liver pathology in experimental obesity. J Thromb Haemost. 2024;22:3191-3198. [RCA] [PubMed] [DOI] [Full Text] [Full Text (PDF)] [Cited by in Crossref: 1] [Reference Citation Analysis (0)] |


