Copyright
©The Author(s) 2025.
World J Gastroenterol. May 28, 2025; 31(20): 105554
Published online May 28, 2025. doi: 10.3748/wjg.v31.i20.105554
Published online May 28, 2025. doi: 10.3748/wjg.v31.i20.105554
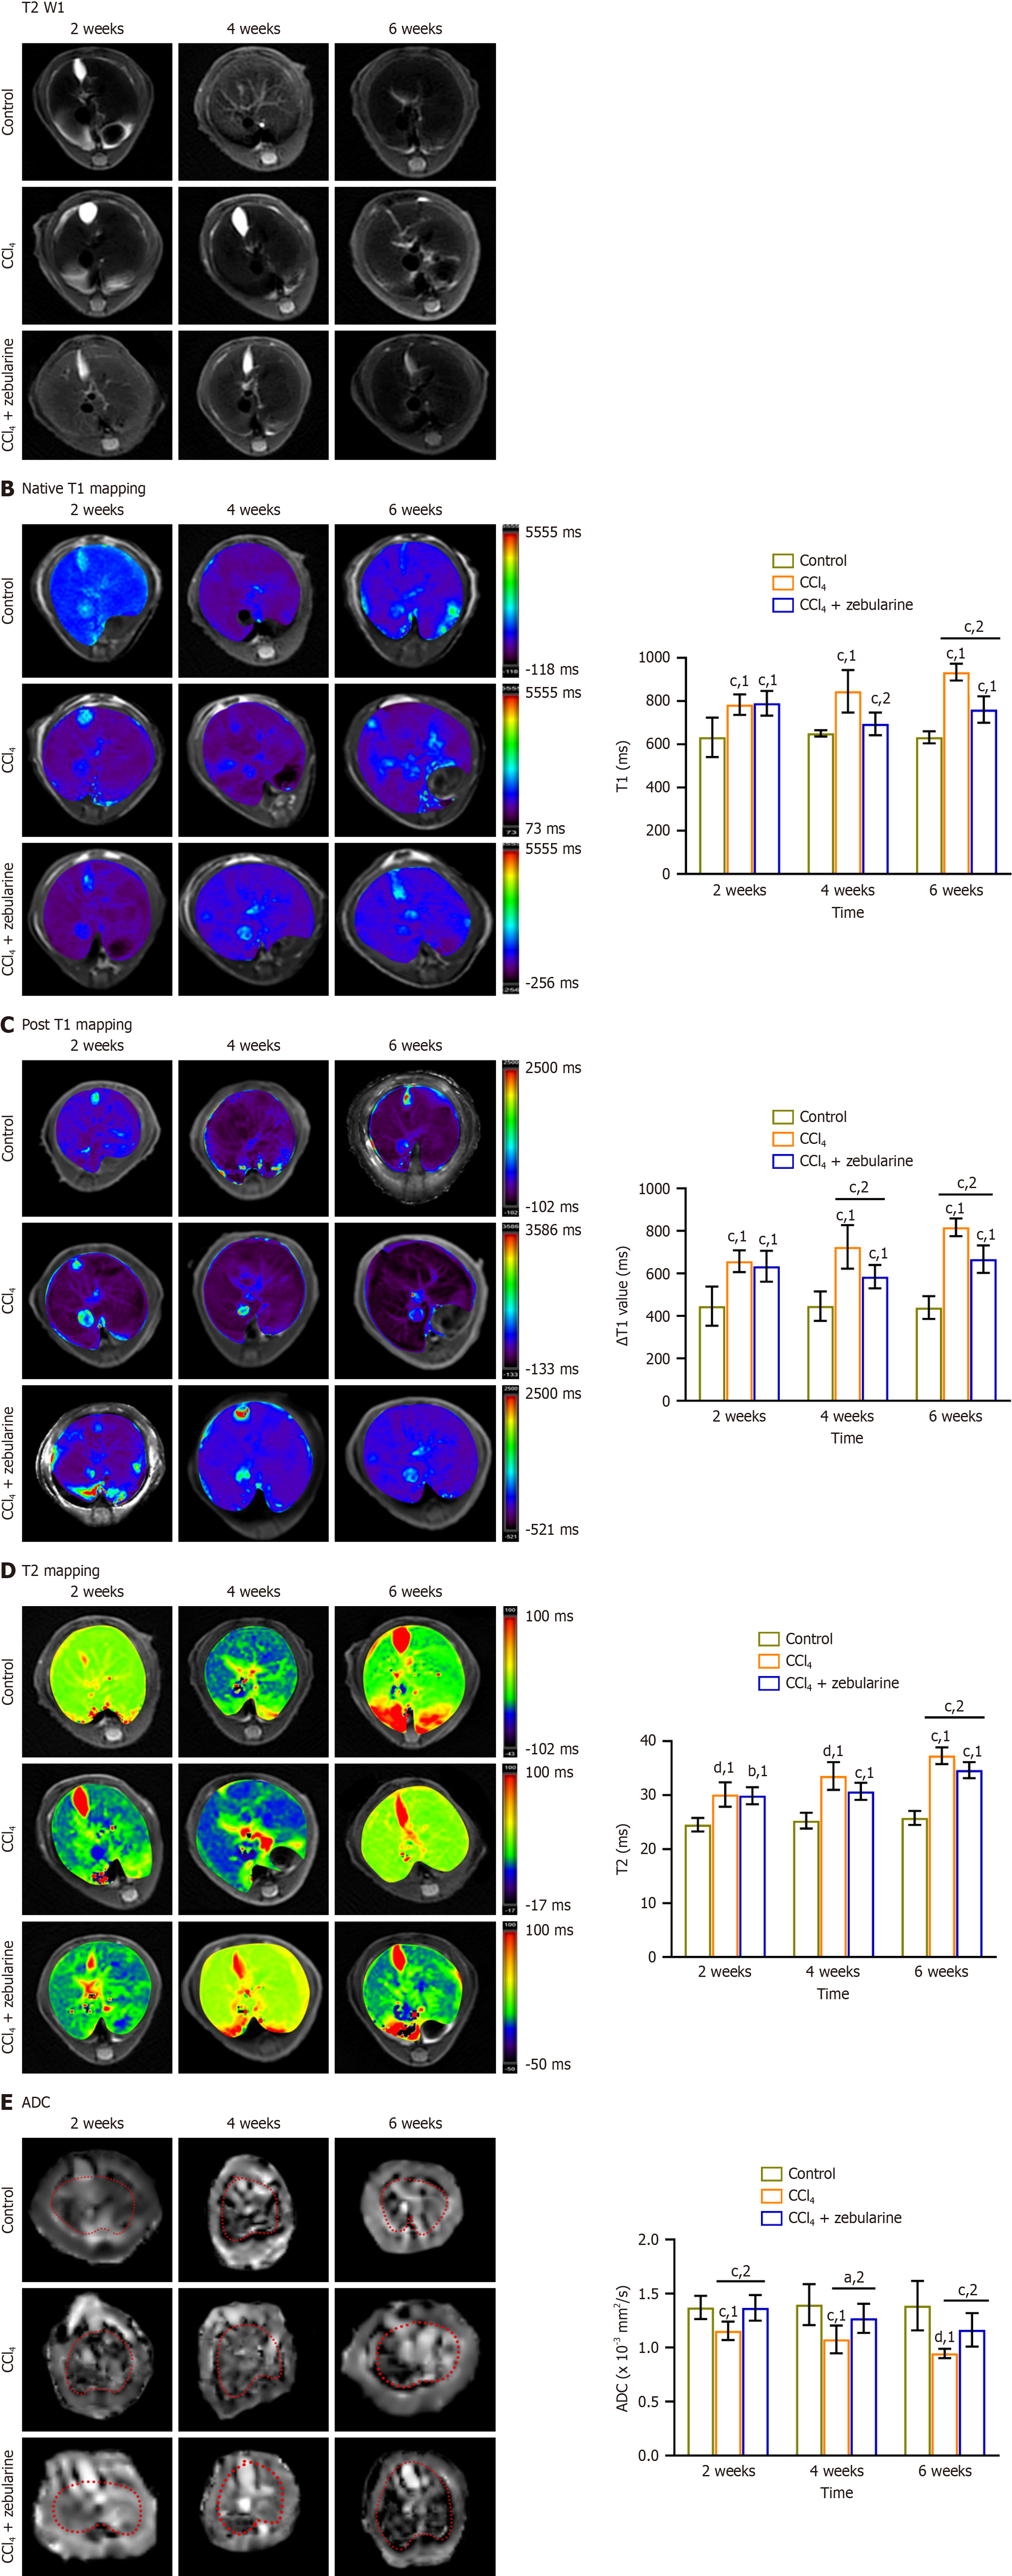
Figure 8 Changes in magnetic resonance parameters in the control, carbon tetrachloride, and carbon tetrachloride + zebularine groups.
Red dotted lines indicate the entire liver border in: A: T2-weighted images; B: Pre-contrast T1 maps; C: Post-contrast T1 maps; D: T2 maps; E: Apparent diffusion coefficient maps. aP < 0.05. bP < 0.01. cP < 0.001. dP < 0.0001. 1P vs control. 2P vs carbon tetrachloride. T2WI: T2-weighted imaging; CCl4: Carbon tetrachloride; ADC: Apparent diffusion coefficient.
- Citation: Lyu SY, Xiao W, Chen YJ, Liao QL, Cai YY, Yu C, Liu JY, Liu H, Zhang MP, Ren YL, Yu QL, Qi YM, Xiao EH, Luo YH. Multi-parameter magnetic resonance imaging of zebularine in liver fibrosis treatment and calcineurin/NFAT3 mechanism. World J Gastroenterol 2025; 31(20): 105554
- URL: https://www.wjgnet.com/1007-9327/full/v31/i20/105554.htm
- DOI: https://dx.doi.org/10.3748/wjg.v31.i20.105554


