
















Copyright: ©Author(s) 2026.
World J Gastroenterol. Nov 28, 2026; 32(44): 117819
Published online Nov 28, 2026. doi: 10.3748/wjg.117819
Published online Nov 28, 2026. doi: 10.3748/wjg.117819
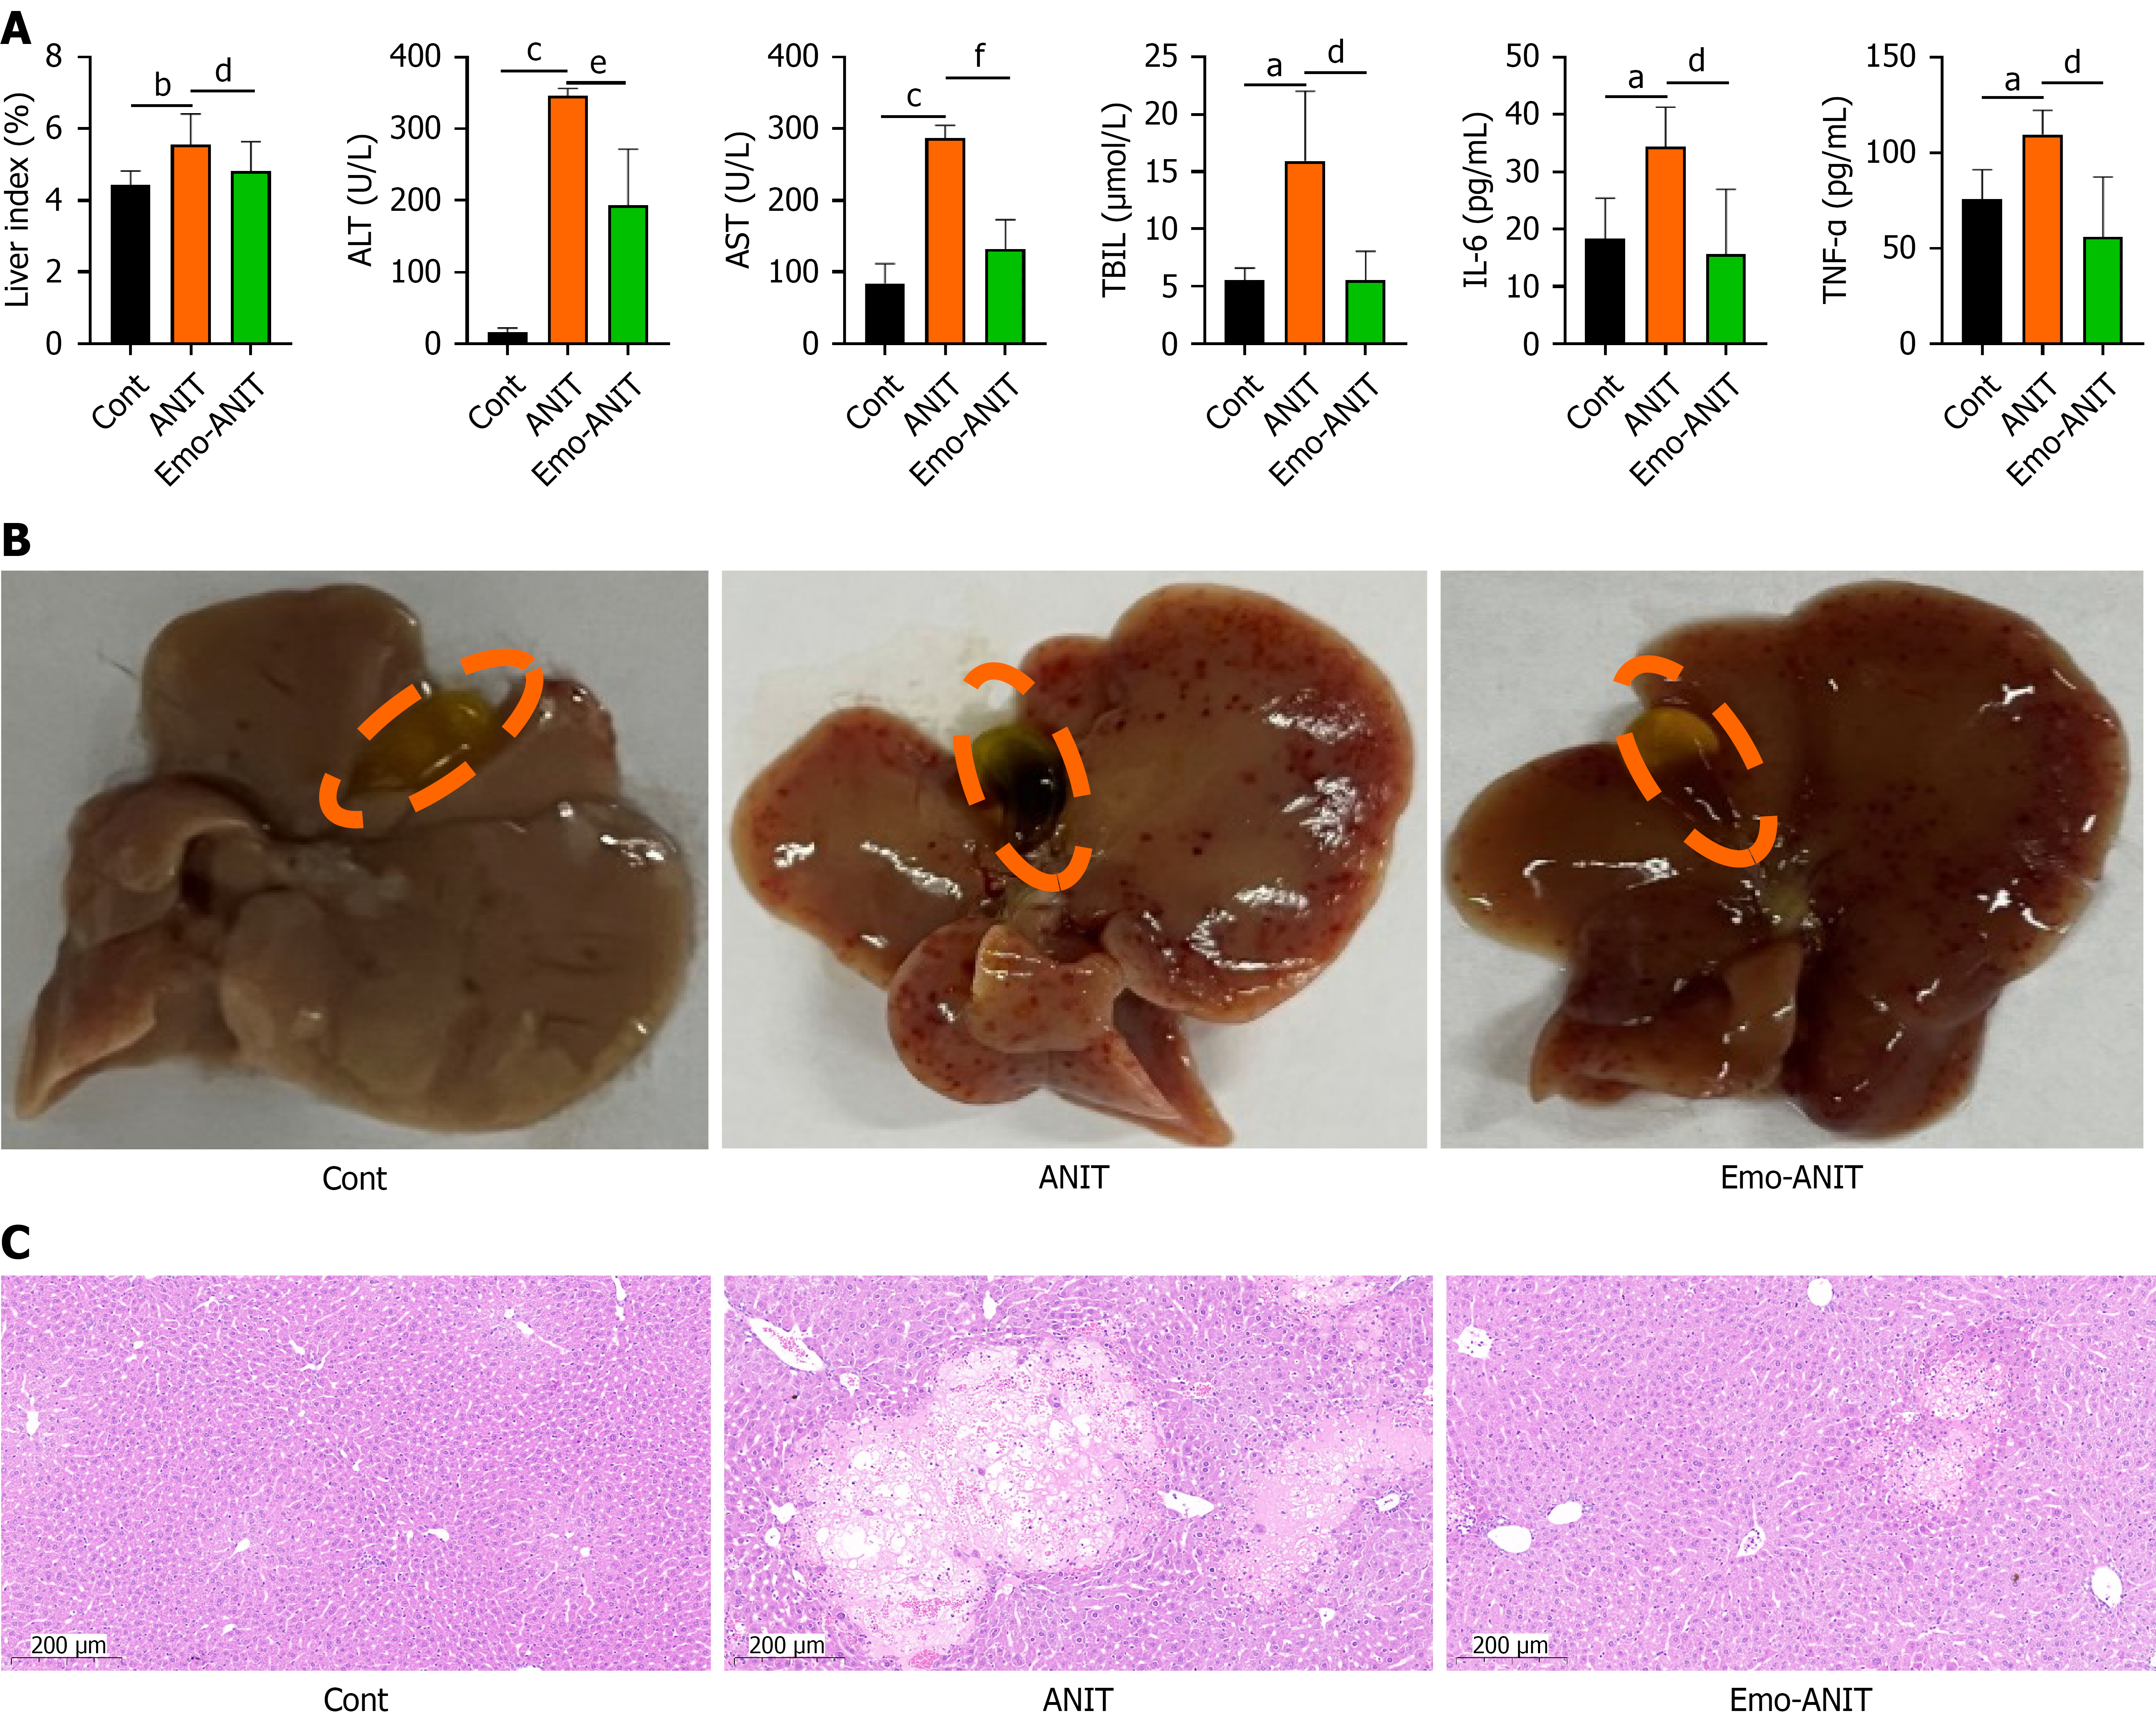
Figure 1 Emodin ameliorated α-naphthylisothiocyanate-induced cholestasis in mice.
A: Liver index and serum biochemical analysis; B: Morphology observation of mice liver and gallbladder; C: Histopathological examination by hematoxylin and eosin staining in mice liver sections, magnification 200 ×, n = 3 (scale bar: 200 μm). Data were analyzed via two-tailed Student’s t-test. n = 6. aP < 0.05 vs control group, bP < 0.01 vs control group, cP < 0.001 vs control group, dP < 0.05 vs α-naphthylisothiocyanate group, eP < 0.01 vs α-naphthylisothiocyanate group, and fP < 0.001 vs α-naphthylisothiocyanate group. Cont: Control; Emo: Emodin; ANIT: Α-naphthylisothiocyanate; ALT: Alanine transaminase; AST: Aspartate aminotransferase; TBIL: Total bilirubin; IL-6: Interleukin-6; TNF-α: Tumor necrosis factor α.
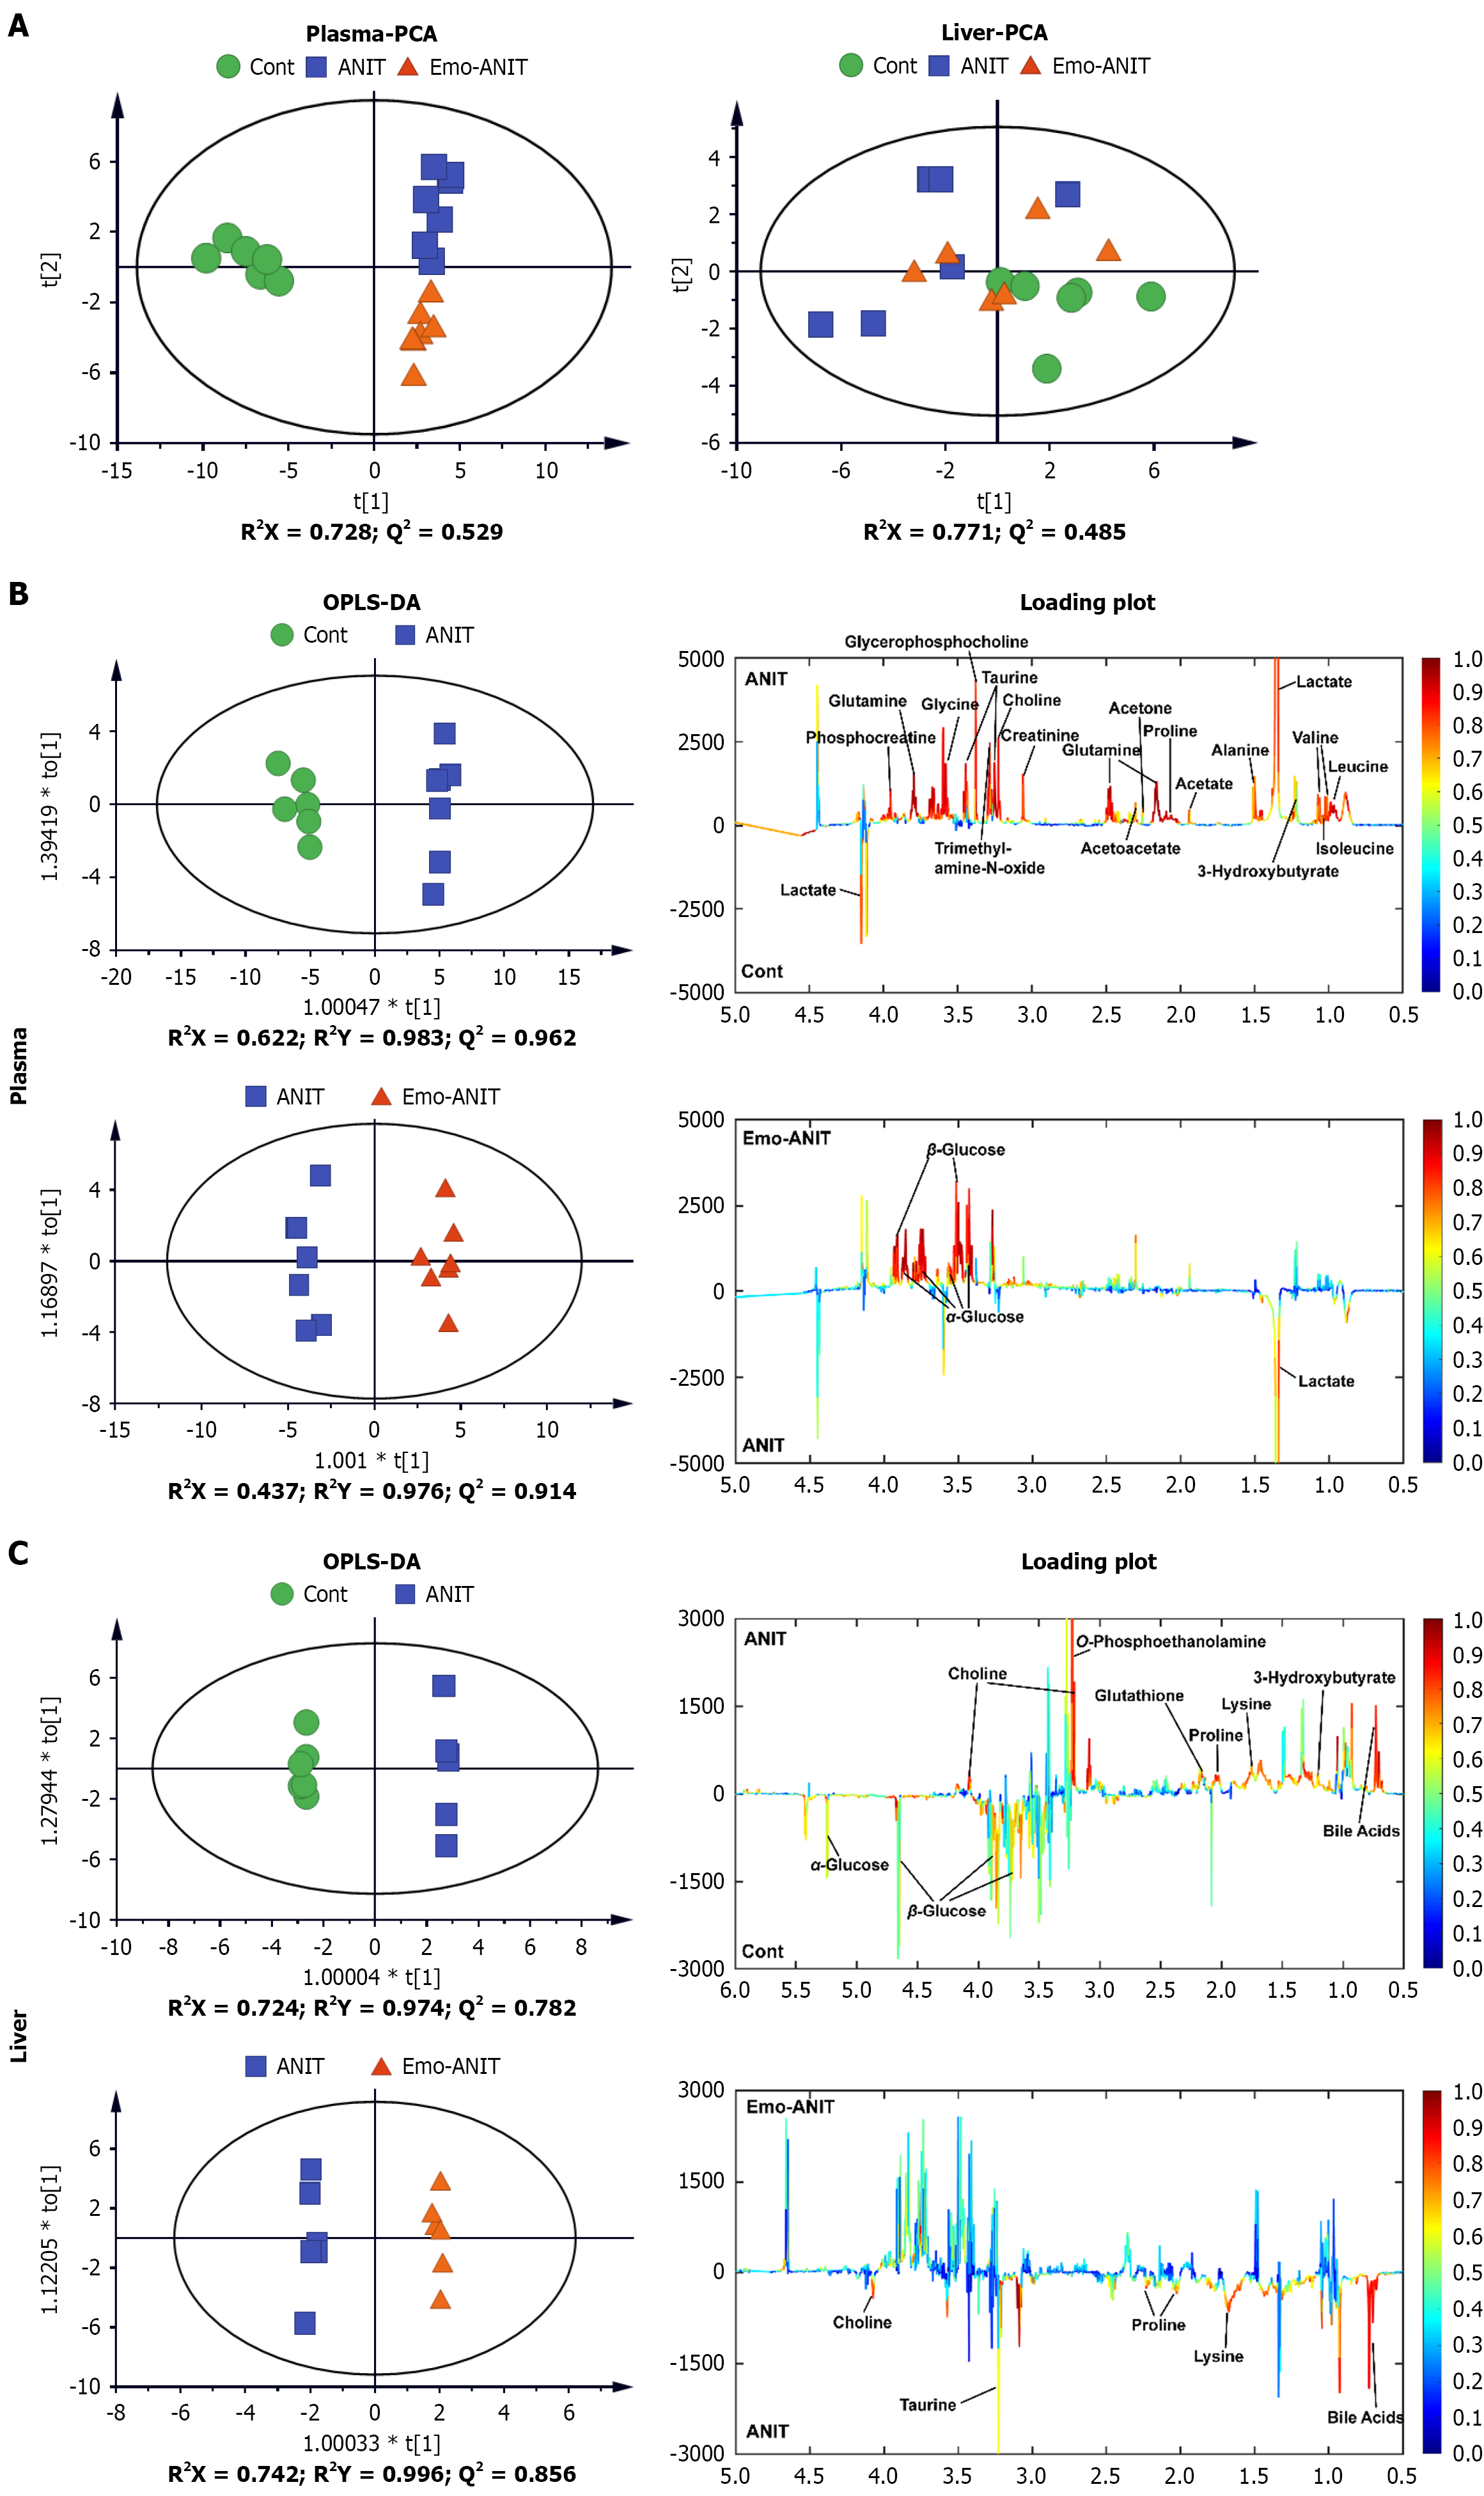
Figure 2 Analyses of differential metabolites in plasma and liver by nuclear magnetic resonance-based metabolomics.
A: Principal component analysis score plots; B: Orthogonal partial least square discriminate analysis score plot and loading plot of plasma; C: Orthogonal partial least square discriminate analysis score plot and loading plot of liver. Cont: Control; Emo: Emodin; ANIT: Α-naphthylisothiocyanate; PCA: Principal component analysis; OPLS-DA: Orthogonal partial least square discriminate analysis.
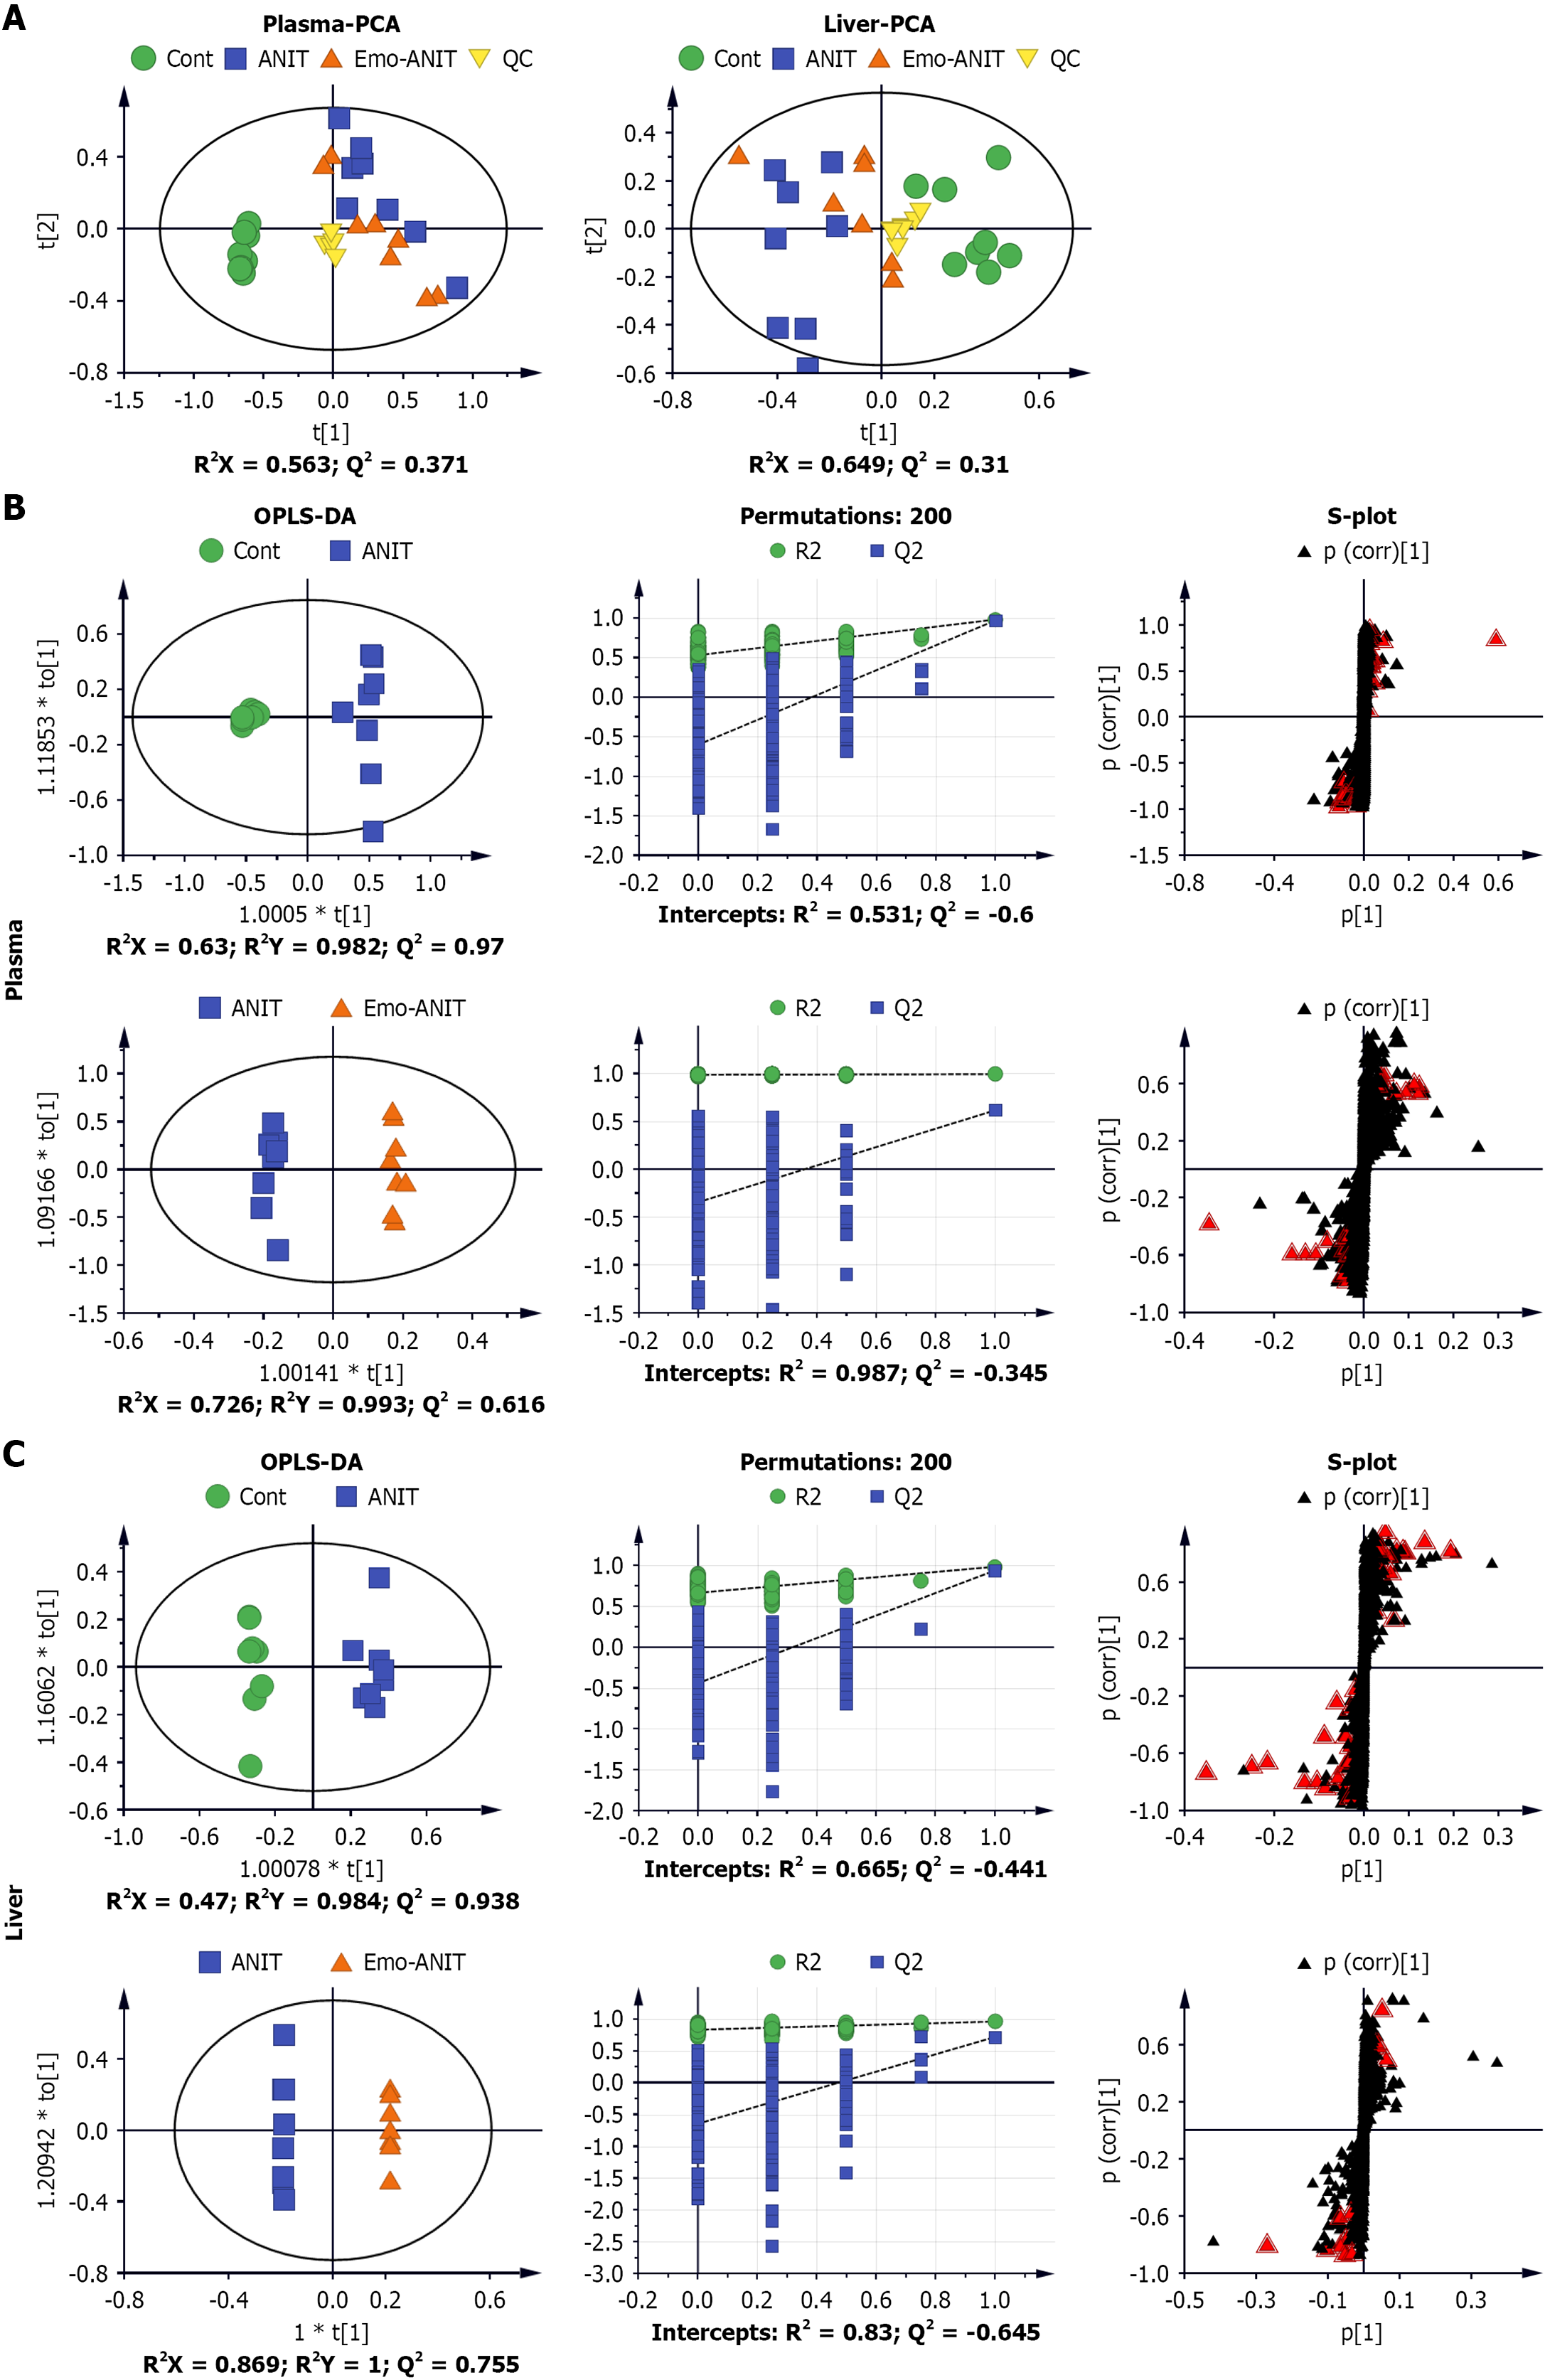
Figure 3 Analyses of differential metabolites in plasma and liver by ultra-high-performance liquid chromatography/quadrupole-Orbitrap-mass spectrometry-based metabolomics.
A: Principal component analysis score plots; B: Orthogonal partial least square discriminate analysis, permutation test and S-plot of plasma; C: Orthogonal partial least square discriminate analysis, permutation test and S-plot of liver. Cont: Control; Emo: Emodin; ANIT: Α-naphthylisothiocyanate; PCA: Principal component analysis; OPLS-DA: Orthogonal partial least square discriminate analysis; QC: Quality control.
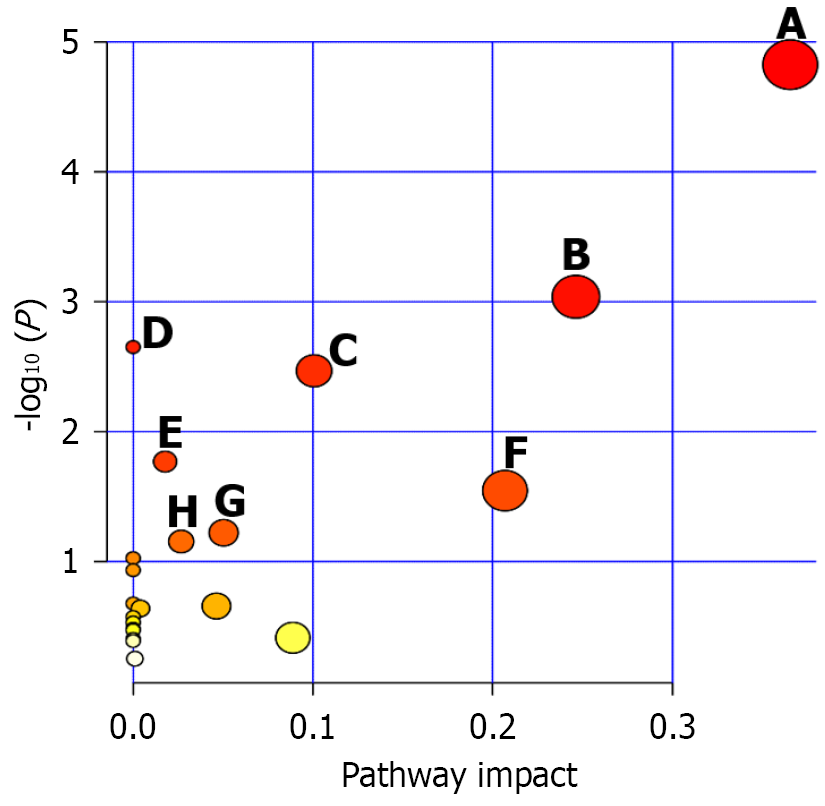
Figure 4 Bubble plot of metabolic pathways associated with the differential metabolites.
A: Arginine biosynthesis; B: Arginine and proline metabolism; C: Aminoacyl-tRNA biosynthesis; D: Glycolysis/gluconeogenesis; E: Primary bile acid biosynthesis; F: Pyruvate metabolism; G: Glycine, serine and threonine metabolism; H: Glycerophospholipid metabolism.
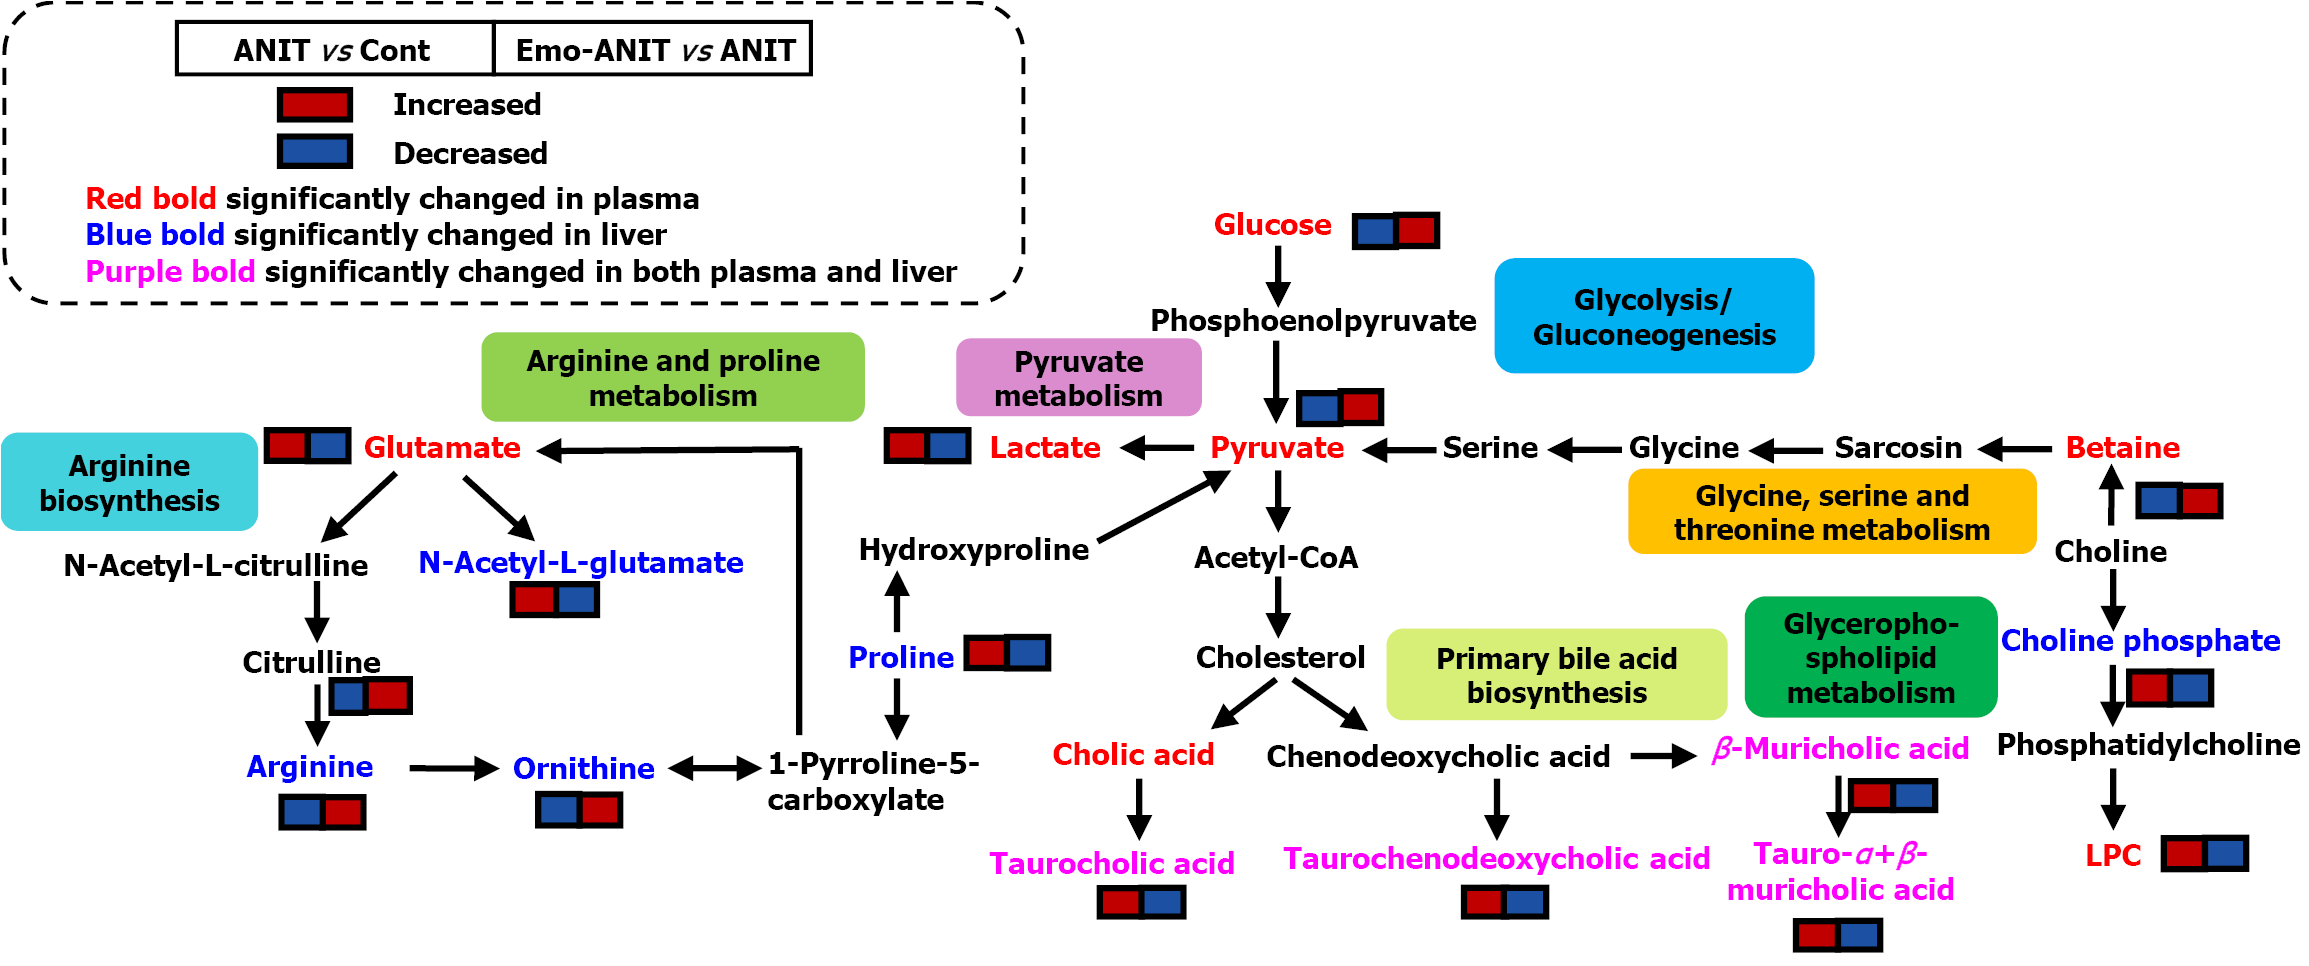
Figure 5 The most predominant disturbed metabolic pathways and the biochemical linkages among the biomarker metabolites.
Cont: Control; Emo: Emodin; ANIT: Α-naphthylisothiocyanate; GI: Gluconeogenesis; LPC: Lysophosphatidylcholine.
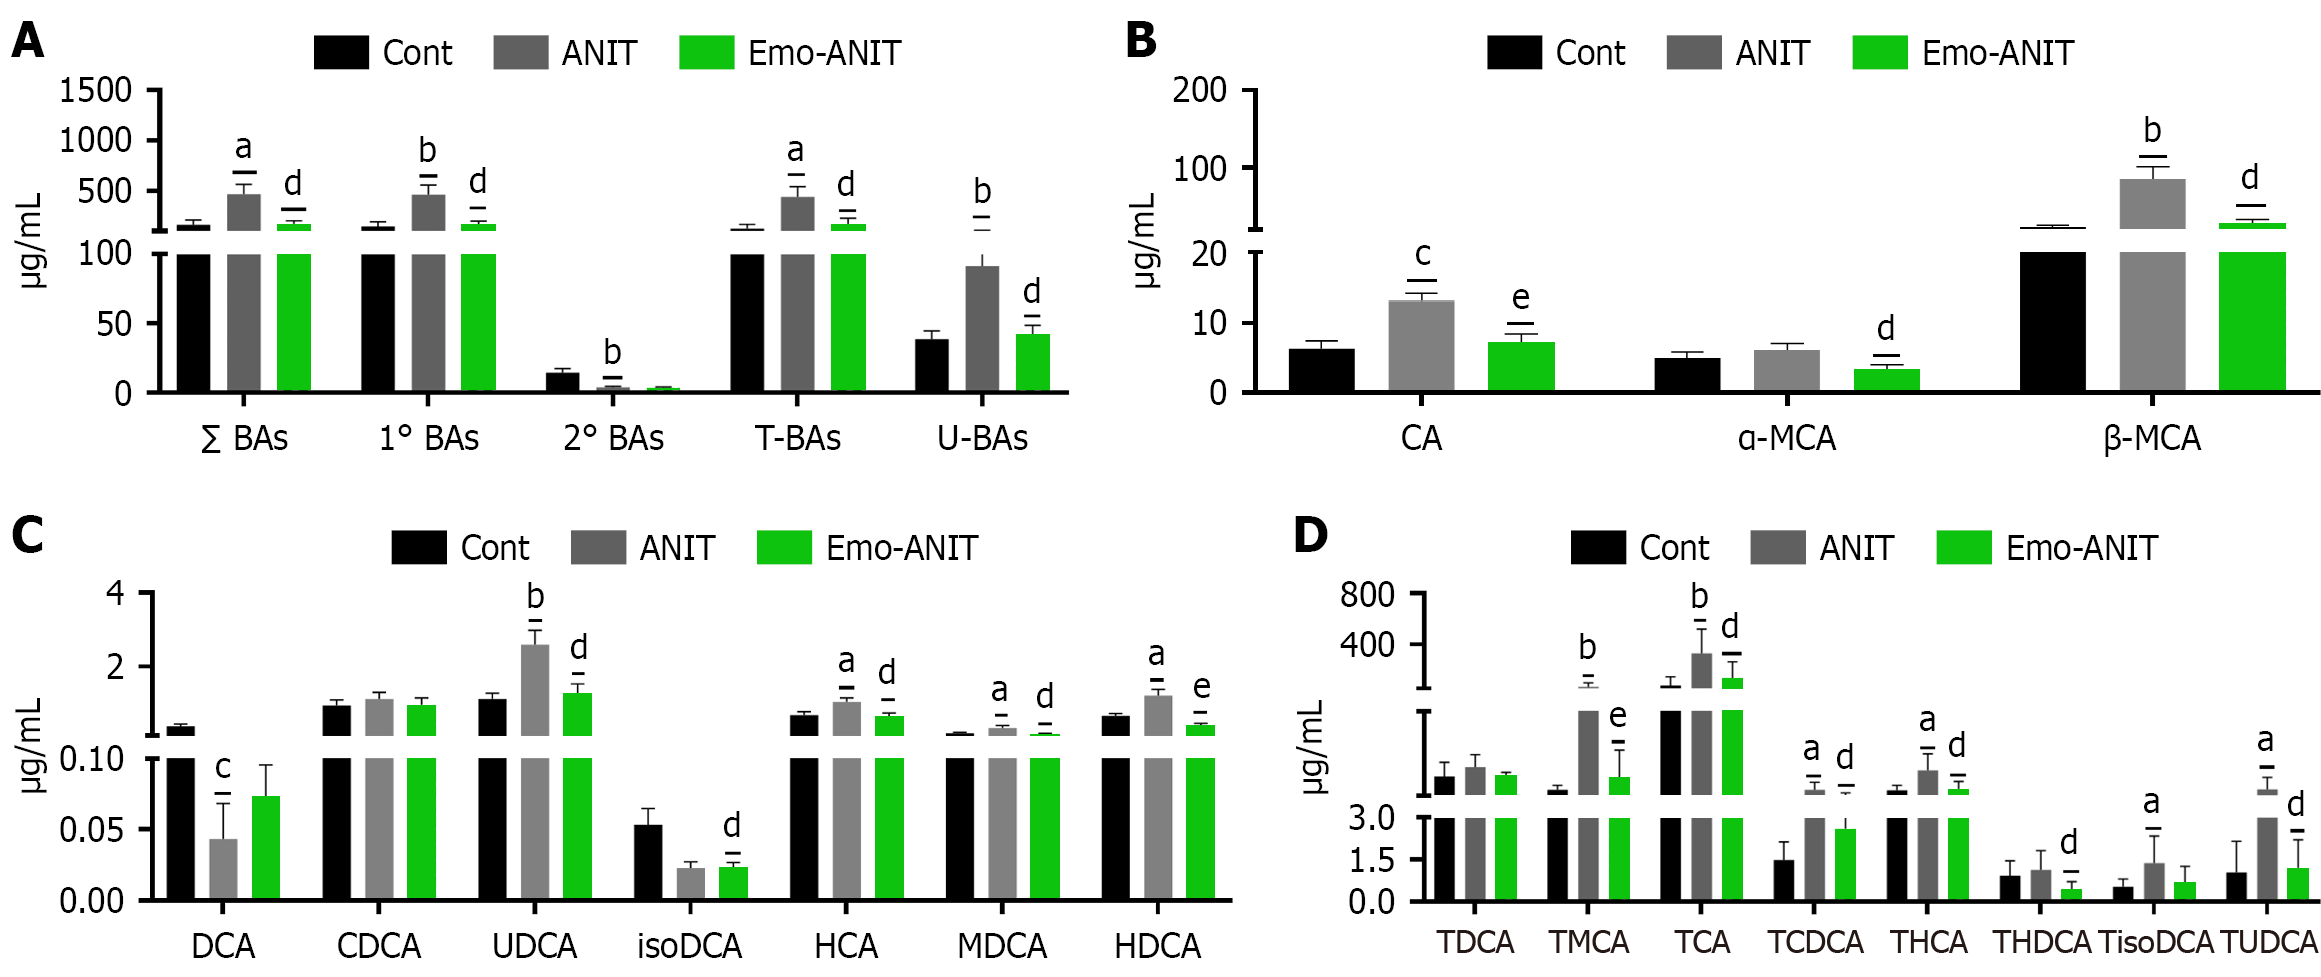
Figure 6 Effect of emodin on liver bile acids in mice with α-naphthylisothiocyanate-induced cholestatic liver injury.
A: Changes of total bile acids (BAs), primary BAs, secondary BAs, taurine-conjugated BAs and unconjugated BAs (U-BAs); B: Changes of U-BAs with high content; C: Changes of U-BAs with low content; D: Changes of taurine-conjugated BAs. Data were analyzed via two-tailed Student’s t-test, n = 8. aP < 0.05 vs control group, bP < 0.01 vs control group, cP < 0.001 vs control group, dP < 0.05 vs α-naphthylisothiocyanate group, and eP < 0.01 vs α-naphthylisothiocyanate group. Cont: Control; Emo: Emodin; ANIT: Α-naphthylisothiocyanate; Σ BAs: Total bile acids; 1° BAs: Primary bile acids; 2° BAs: Secondary bile acids; T-BAs: Taurine-conjugated bile acids; U-BAs: Unconjugated bile acids; CA: Cholic acid; MCA: Muricholic acid; DCA: Deoxycholic acid; CDCA: Chenodeoxycholic acid; UDCA: Ursodeoxycholic acid; HCA: Hyocholic acid; MDCA: Murideoxycholic acid; HDCA: Hyodesoxycholic acid; TDCA: Taurodeoxycholic acid; TMCA: Tauro-β-muricholic acid; TCA: Taurocholic acid; TCDCA: Taurochenodeoxycholic acid; THCA: Taurohyocholic acid; THDCA: Taurochenodeoxycholic acid; TUDCA: Tauroursodeoxycholic acid.
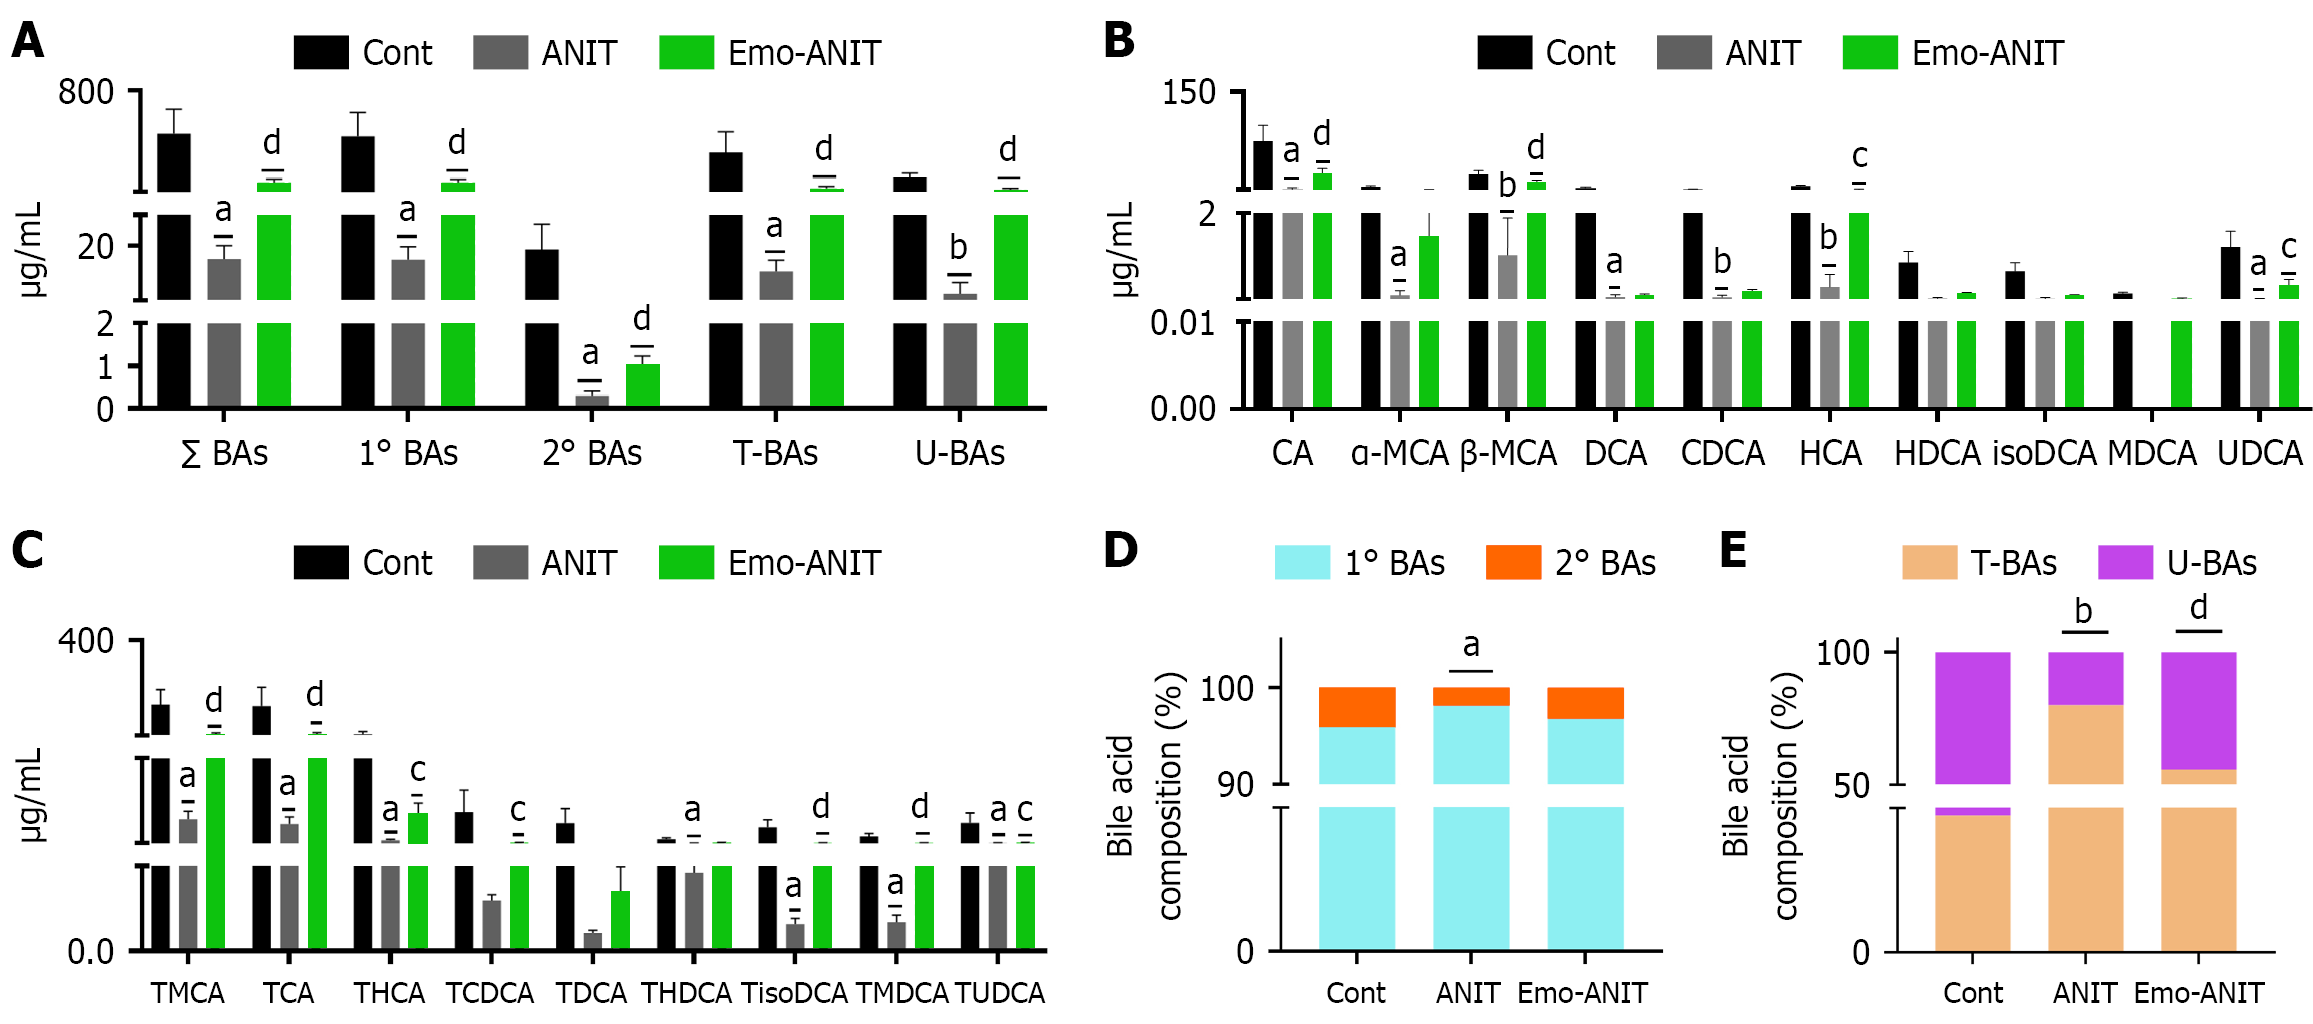
Figure 7 Effect of emodin on distal ileum bile acids in mice with α-naphthylisothiocyanate-induced cholestasis liver injury.
A: Changes of total bile acids (BAs), primary BAs, secondary BAs, taurine-conjugated BAs (T-BAs) and unconjugated BAs (U-BAs); B: Changes of U-BAs; C: Changes of T-BAs; D: Ratio of primary BAs to secondary BAs in the ileum; E: Ratio of T-BAs to U-BAs in the ileum. Data were analyzed via two-tailed Student’s t-test, n = 8. aP < 0.05 vs control group, bP < 0.01 vs control group, cP < 0.05 vs α-naphthylisothiocyanate group, and dP < 0.01 vs α-naphthylisothiocyanate group. Cont: Control; Emo: Emodin; ANIT: Α-naphthylisothiocyanate; Σ BAs: Total bile acids; 1° BAs: Primary bile acids; 2° BAs: Secondary bile acids; T-BAs: Taurine-conjugated bile acids; U-BAs: Unconjugated bile acids; CA: Cholic acid; MCA: Muricholic acid; DCA: Deoxycholic acid; CDCA: Chenodeoxycholic acid; HCA: Hyocholic acid; HDCA: Hyodesoxycholic acid; UDCA: Ursodeoxycholic acid; MDCA: Murideoxycholic acid; TMCA: Tauro-β-muricholic acid; TCA: Taurocholic acid; TCDCA: Taurochenodeoxycholic acid; THCA: Taurohyocholic acid; TMDCA: Tauromurideoxycholic acid; TUDCA: Tauroursodeoxycholic acid; TDCA: Taurodeoxycholic acid; THDCA: Taurochenodeoxycholic acid.
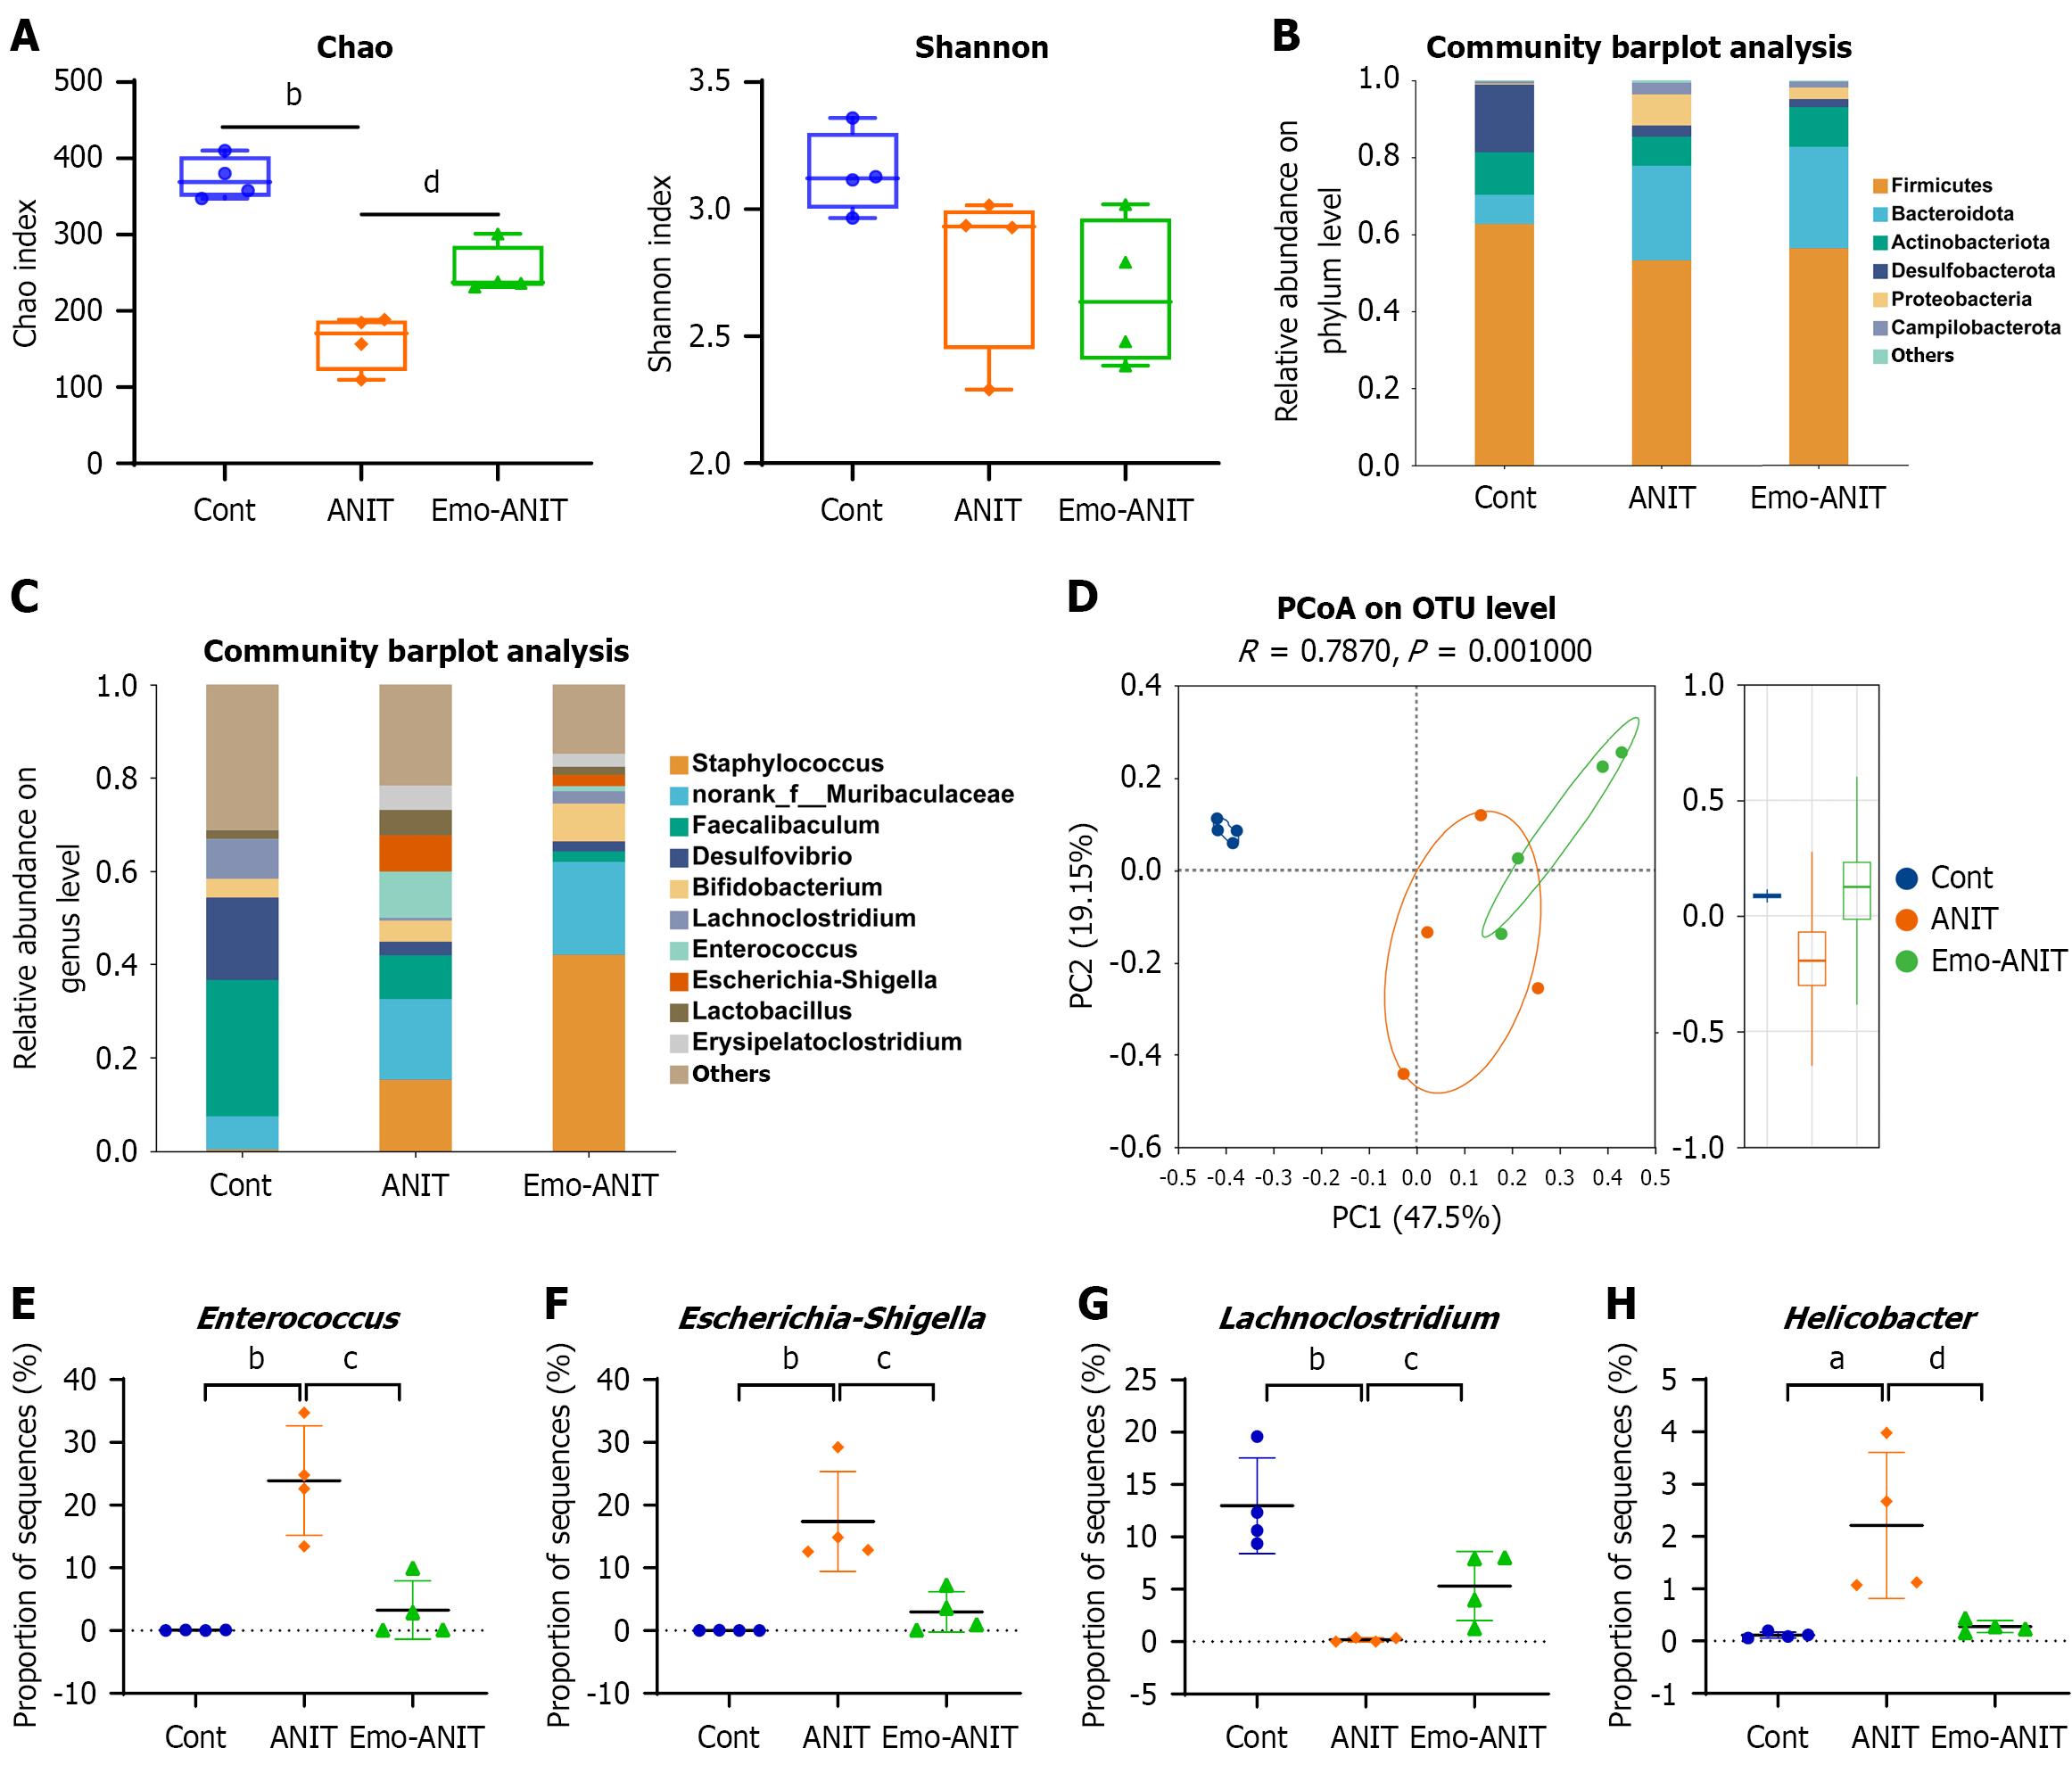
Figure 8 Effect of emodin on gut microbiota in mice with α-naphthylisothiocyanate-induced cholestasis liver injury.
A: Alpha diversity (Chao and Shannon indices) of bacteria in control, α-naphthylisothiocyanate-treated and emodin-treated mice; B: Community distribution at the phylum level; C: Community distribution at the genus level; D: Principal co-ordinates analysis of different groups at the genus level; E-H: Proportion of differential microbiota. Data were analyzed via the Wilcoxon rank-sum test. aP < 0.01 vs control group, bP < 0.001 vs control group, cP < 0.05 vs α-naphthylisothiocyanate group, and dP < 0.01 vs α-naphthylisothiocyanate group. Cont: Control; Emo: Emodin; ANIT: Α-naphthylisothiocyanate; PCoA: Principal co-ordinates analysis.
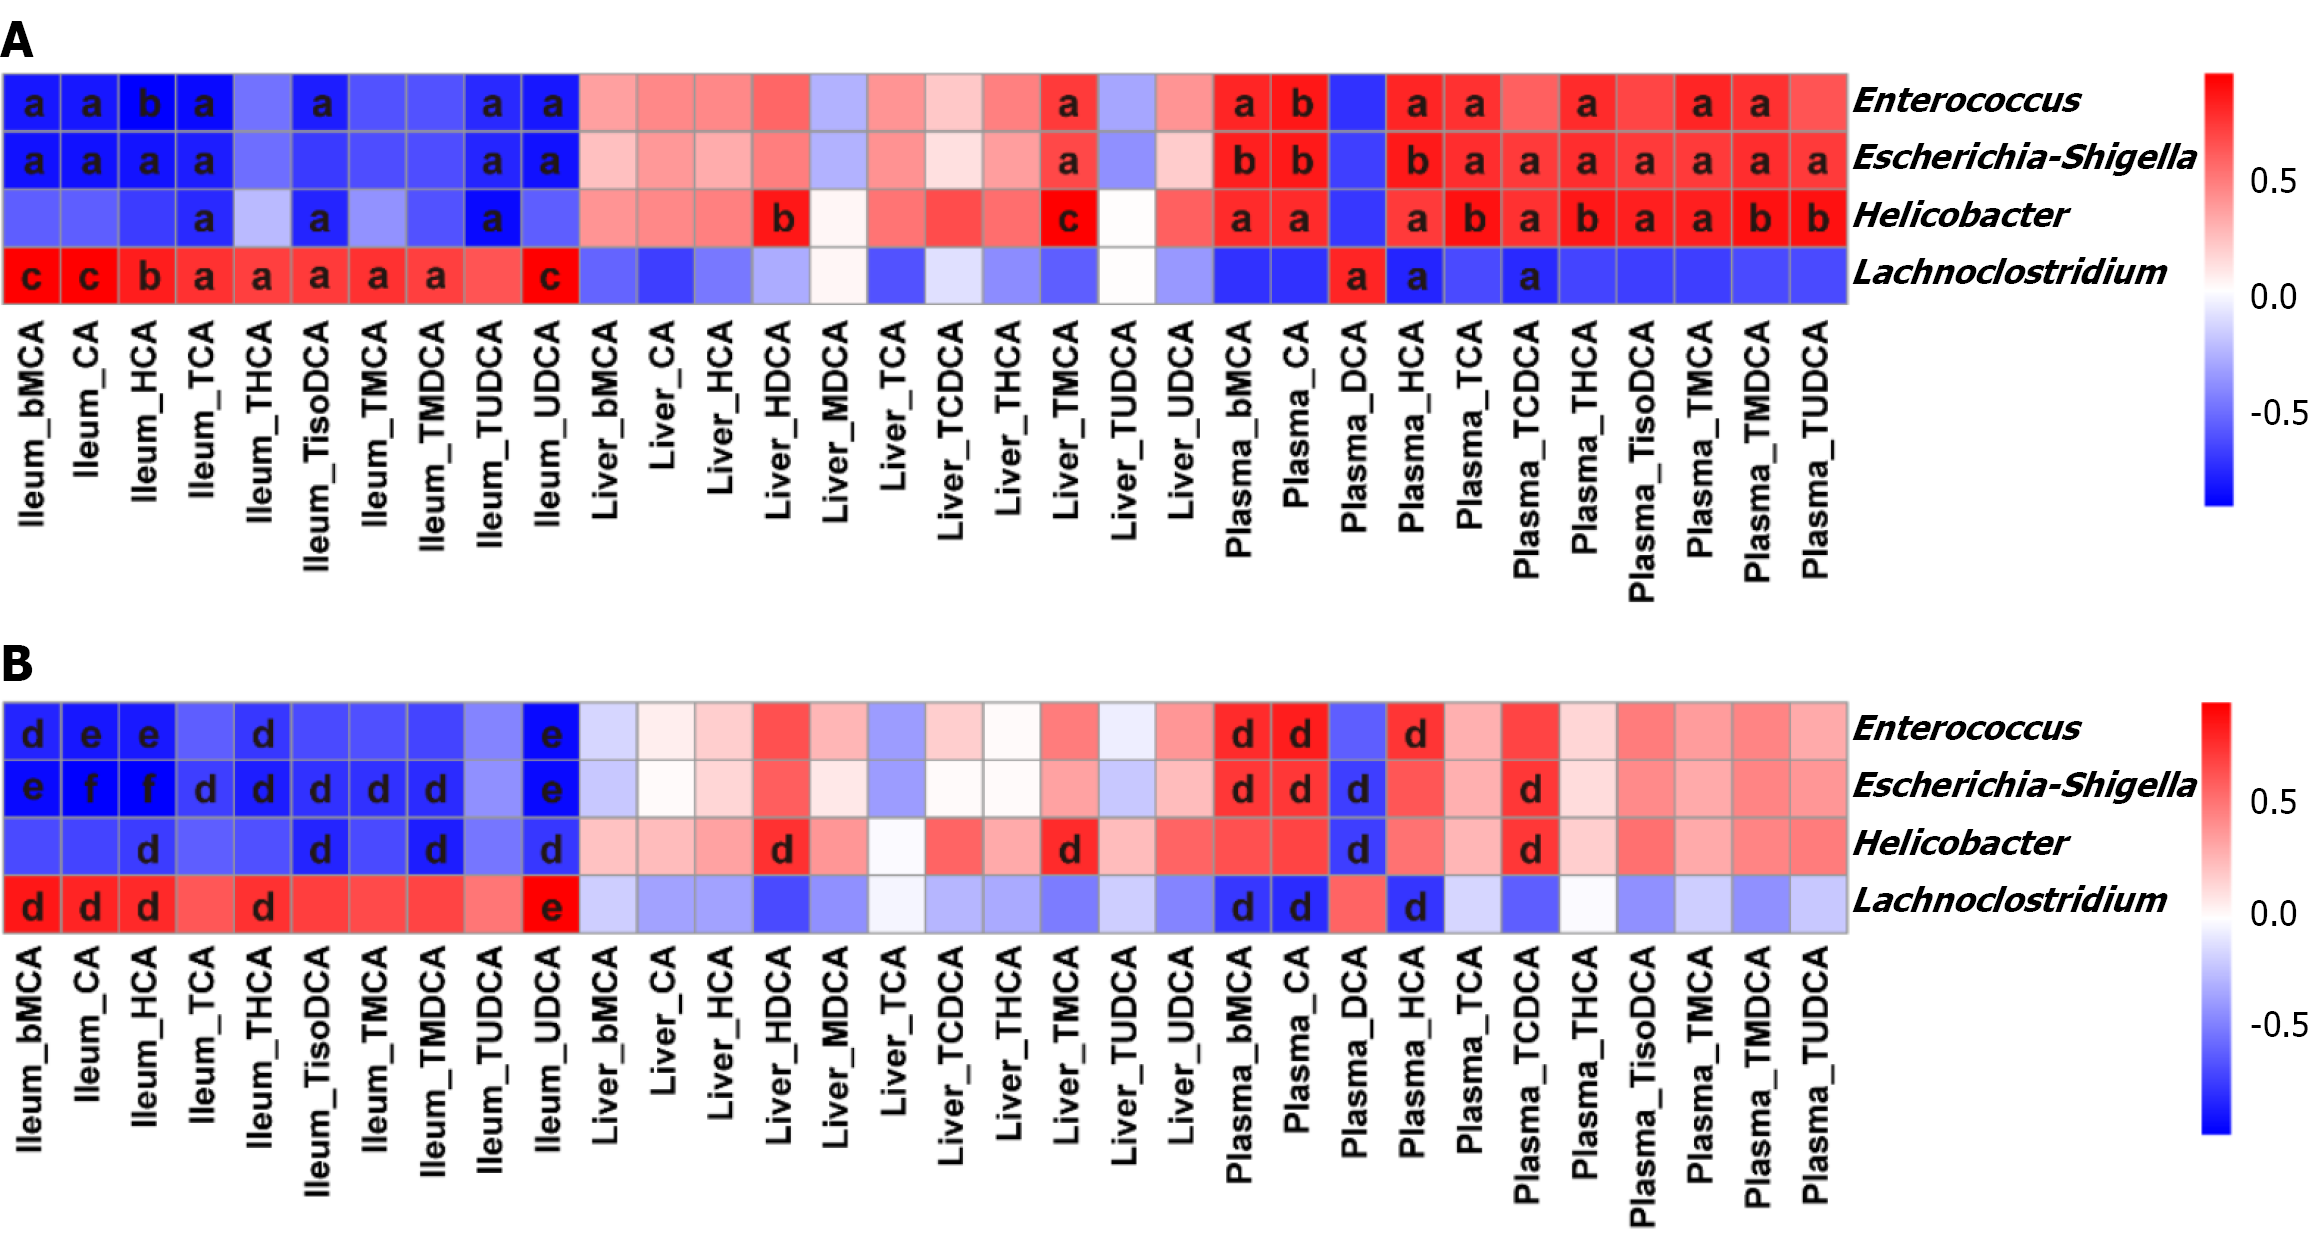
Figure 9 Spearman’s correlation analyses between the relative abundance of gut microbiota at the genus level and bile acids.
A: The correlations between gut microbiota and bile acids between the control and α-naphthylisothiocyanate (ANIT) group; B: The correlations between gut microbiota and bile acids between the ANIT and emodin-ANIT group. Data were analyzed via two-tailed test of significance. aP < 0.05 vs control group, bP < 0.01 vs control group, cP < 0.001 vs control group, dP < 0.05 vs α-naphthylisothiocyanate group, eP < 0.01 vs α-naphthylisothiocyanate group, and fP < 0.001 vs α-naphthylisothiocyanate group.
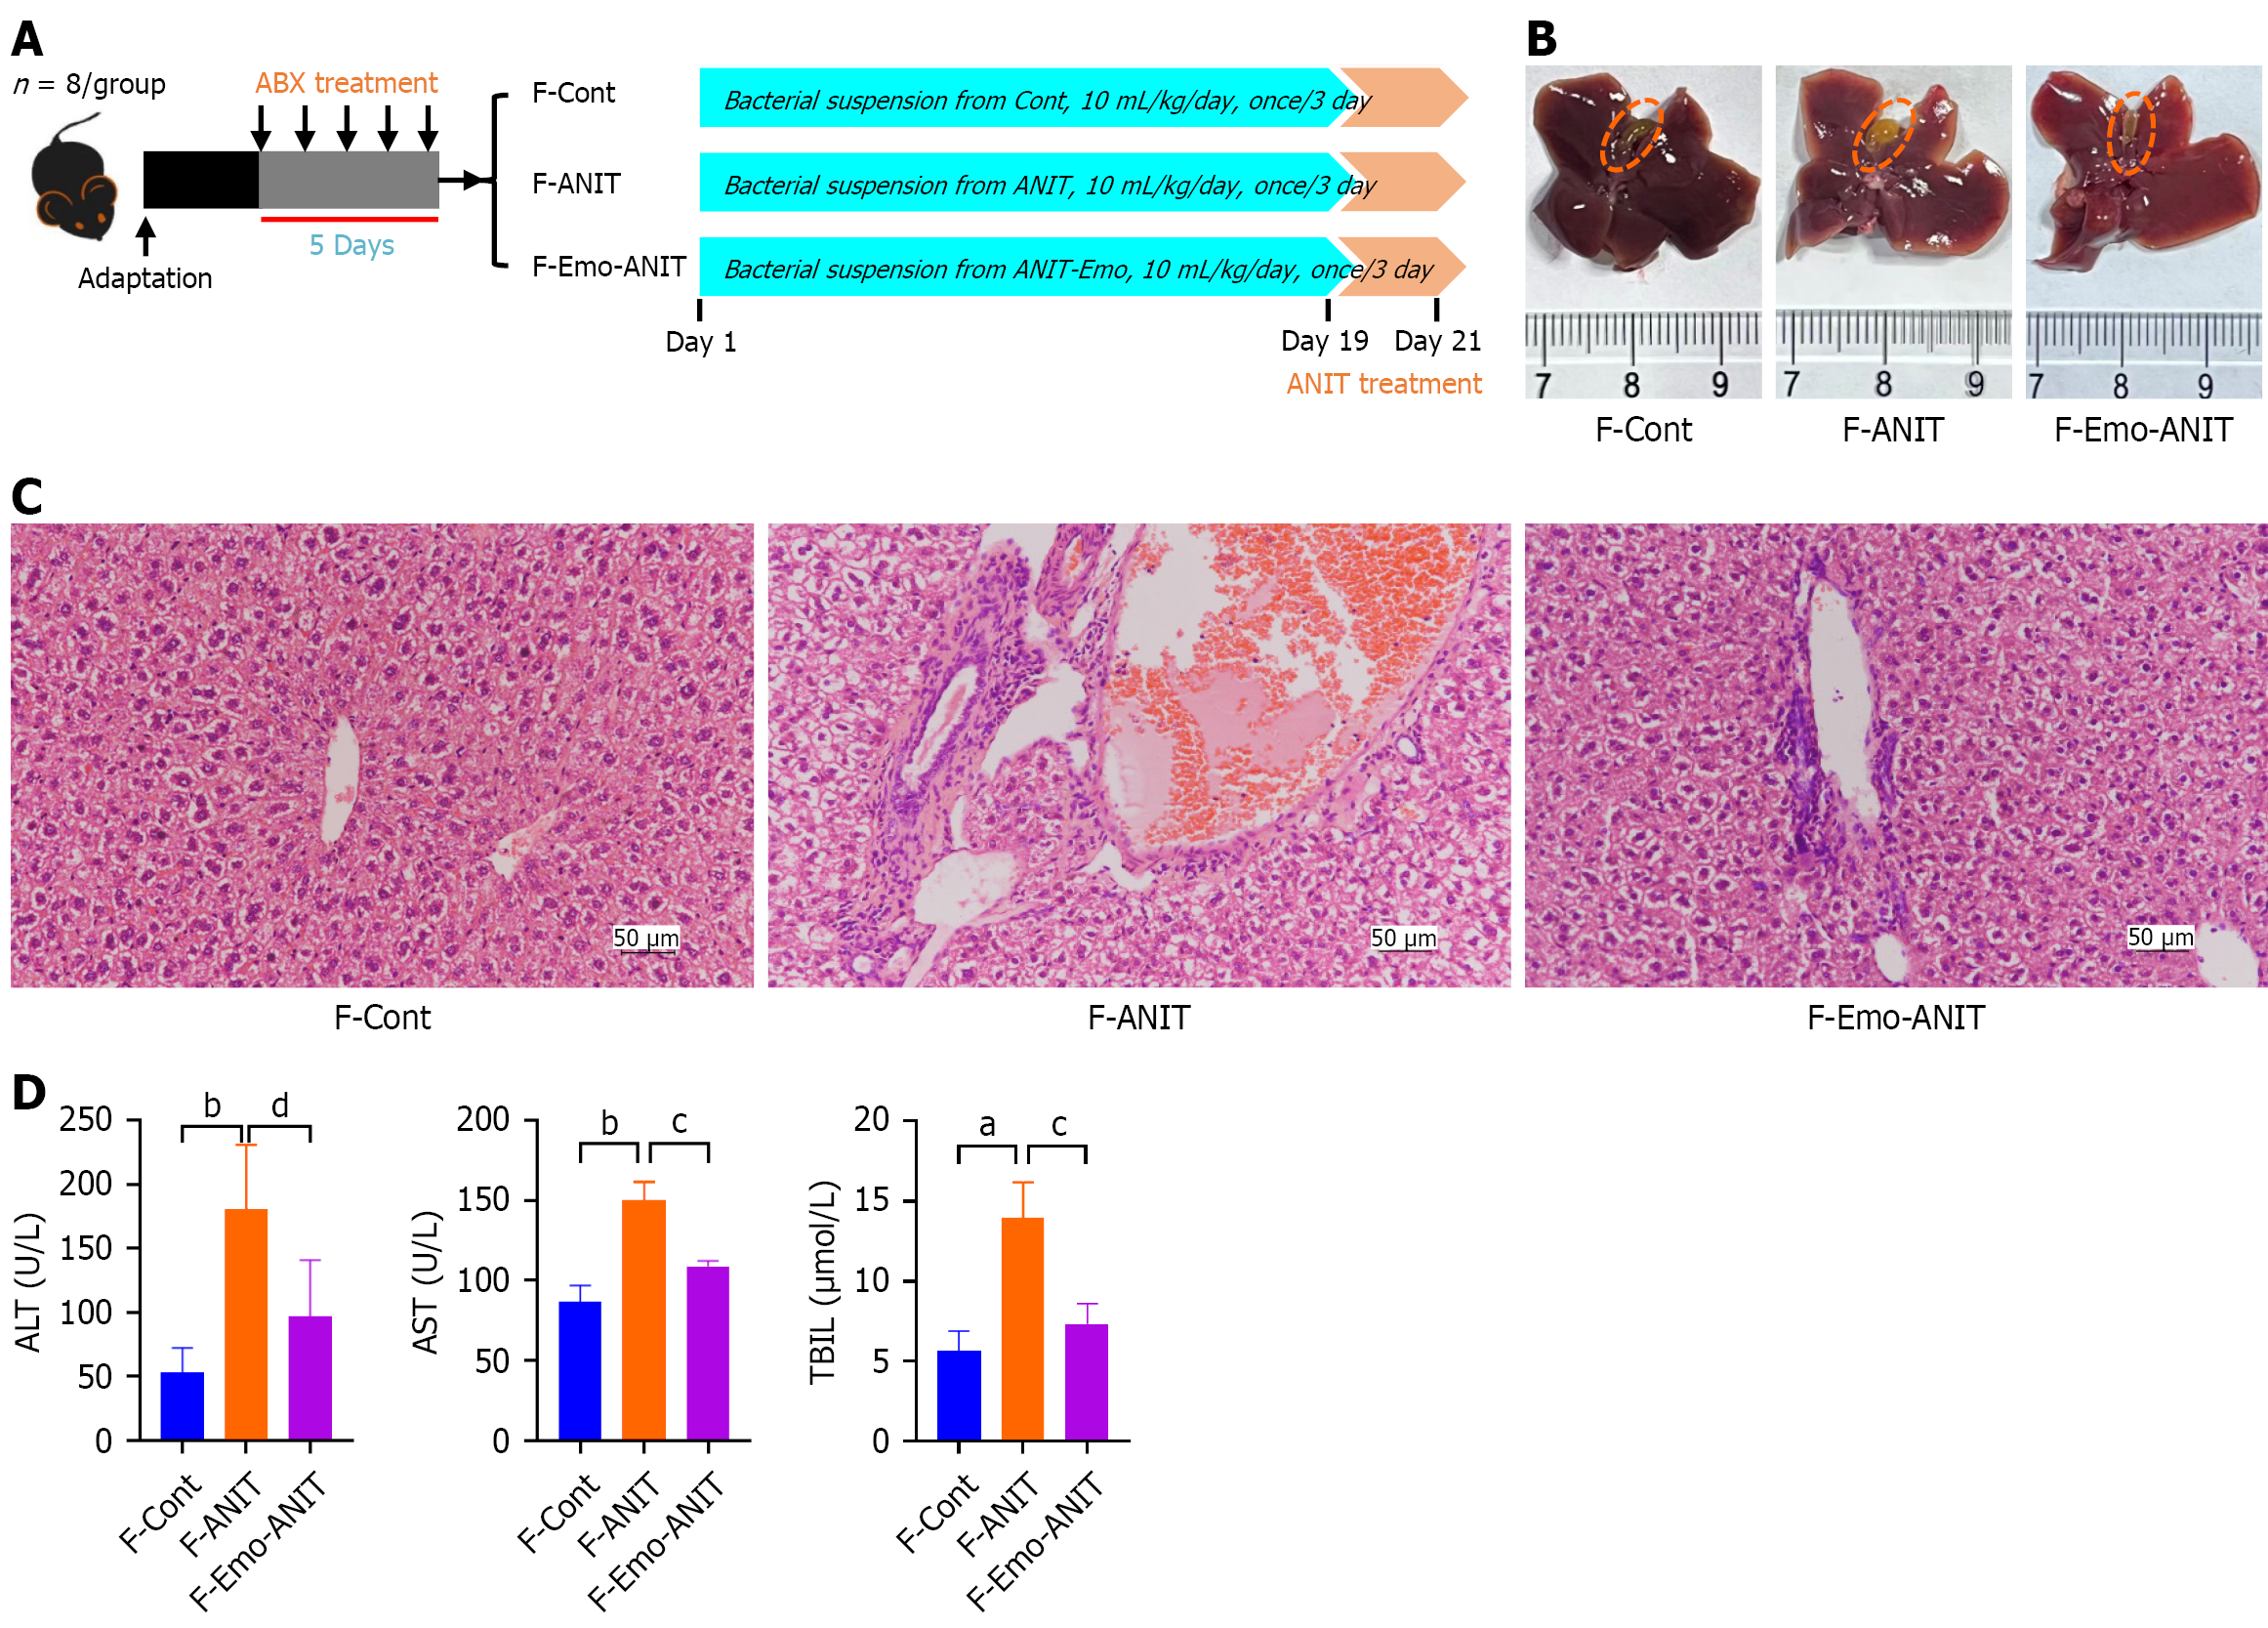
Figure 10 Microbial communities from emodin-treated mice could ameliorate α-naphthylisothiocyanate-induced cholestatic liver injury.
A: Experimental design scheme; B: Observation of liver and gallbladder tissue morphology; C: Representative images of hematoxylin and eosin staining liver sections, magnification 200 ×, n = 3 (scale bar: 50 μm); D: Serum alanine transaminase, aspartate aminotransferase and total bilirubin levels. Data were analyzed via two-tailed Student’s t-test, n = 6. aP < 0.01 vs control group, bP < 0.001 vs control group, cP < 0.05 vs α-naphthylisothiocyanate group, and dP < 0.01 vs α-naphthylisothiocyanate group. ALT: Alanine transaminase; AST: Aspartate aminotransferase; TBIL: Total bilirubin; Cont: Control; Emo: Emodin; ANIT: Α-naphthylisothiocyanate; ABX: Antibiotics.
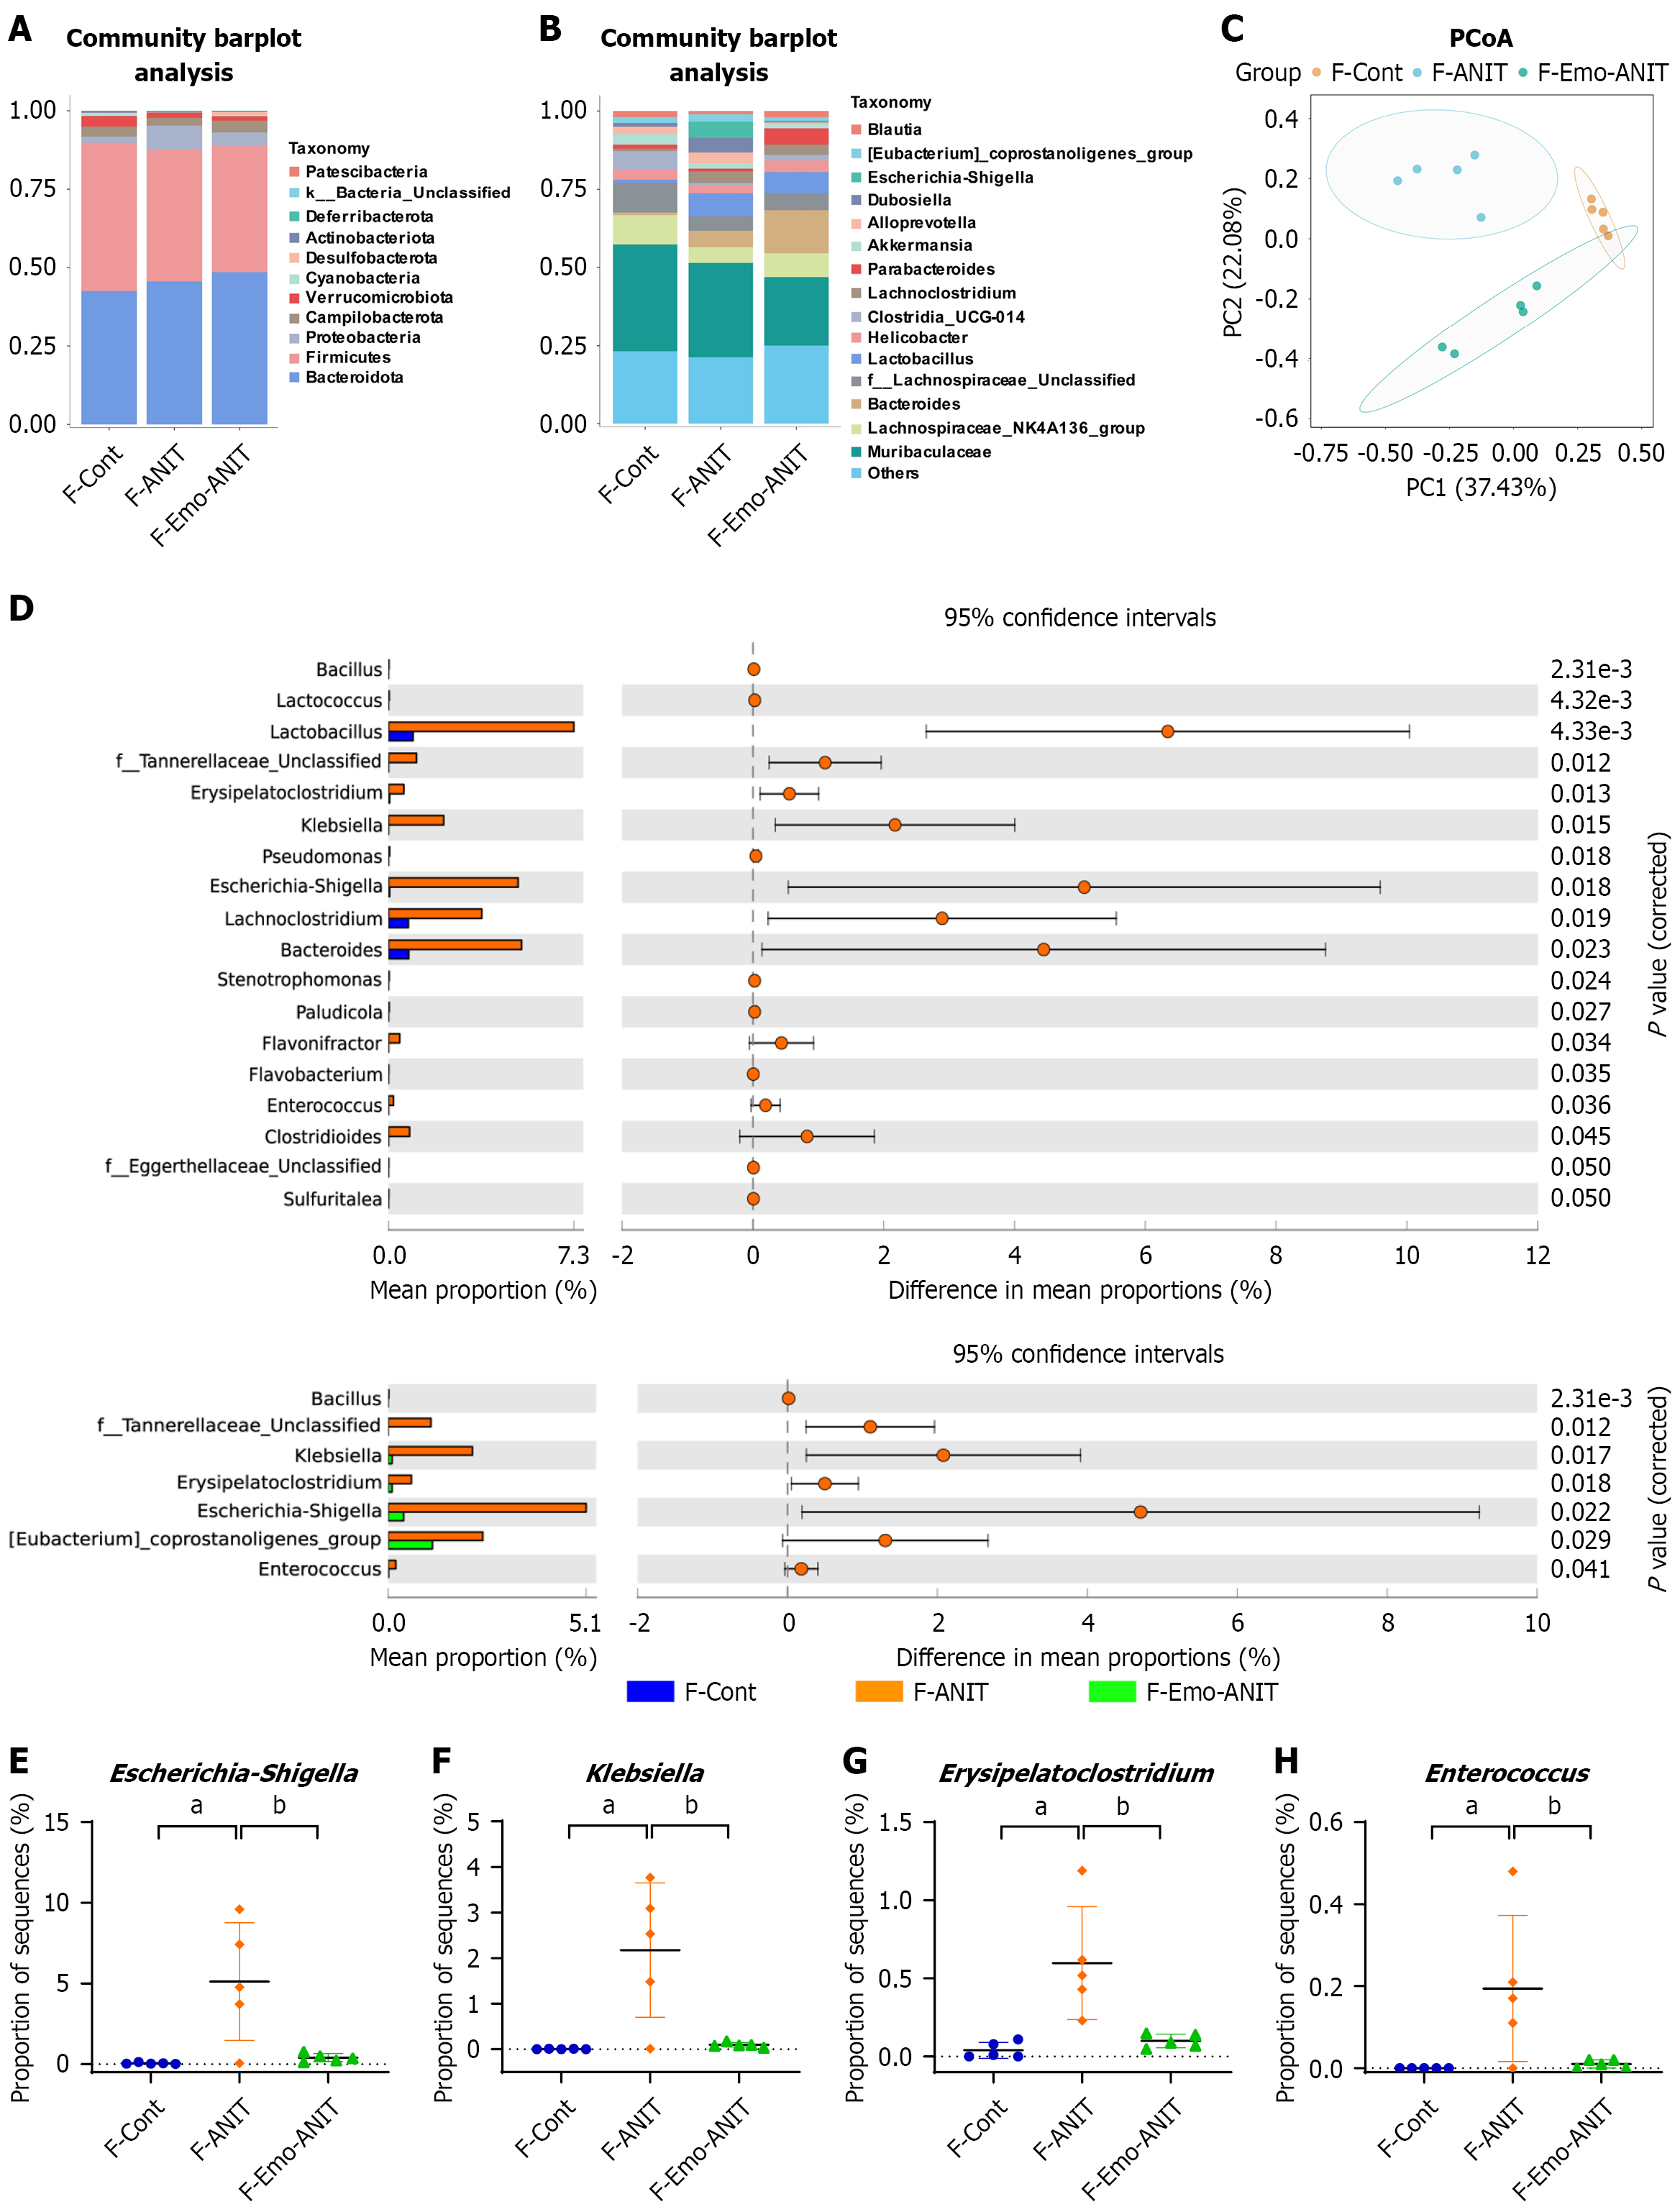
Figure 11 Fecal microbiota transplantation of emodin-fed mice modulated gut microbiota.
A: Bacterial community composition at the phylum level; B: Bacterial community composition at the genus level; C: Principal co-ordinates analysis of the gut microbiota in each group at the genus level; D: STAMP analysis uncovered the differences between F-control and F-α-naphthylisothiocyanate (ANIT) groups, F-ANIT and F-emodin-ANIT groups (the P value < 0.05 for declaring significance); E-H: Relative abundance of differential microbiota. Data were analyzed via two-sided Welch’s t-test, n = 5. aP < 0.05 vs control group, bP < 0.05 vs α-naphthylisothiocyanate group. Cont: Control; Emo: Emodin; ANIT: Α-naphthylisothiocyanate; PCoA: Principal co-ordinates analysis.
- Citation: Wang CX, Wang LM, Fu ZF, Zhao X, Han LF, Lou YF. Emodin ameliorates cholestatic liver injury by regulating bile acid metabolism and gut microbiota in mice. World J Gastroenterol 2026; 32(44): 117819
- URL: https://www.wjgnet.com/1007-9327/full/v32/i44/117819.htm
- DOI: https://dx.doi.org/10.3748/wjg.117819