
















Copyright: ©Author(s) 2026.
World J Gastroenterol. Nov 28, 2026; 32(44): 117819
Published online Nov 28, 2026. doi: 10.3748/wjg.117819
Published online Nov 28, 2026. doi: 10.3748/wjg.117819
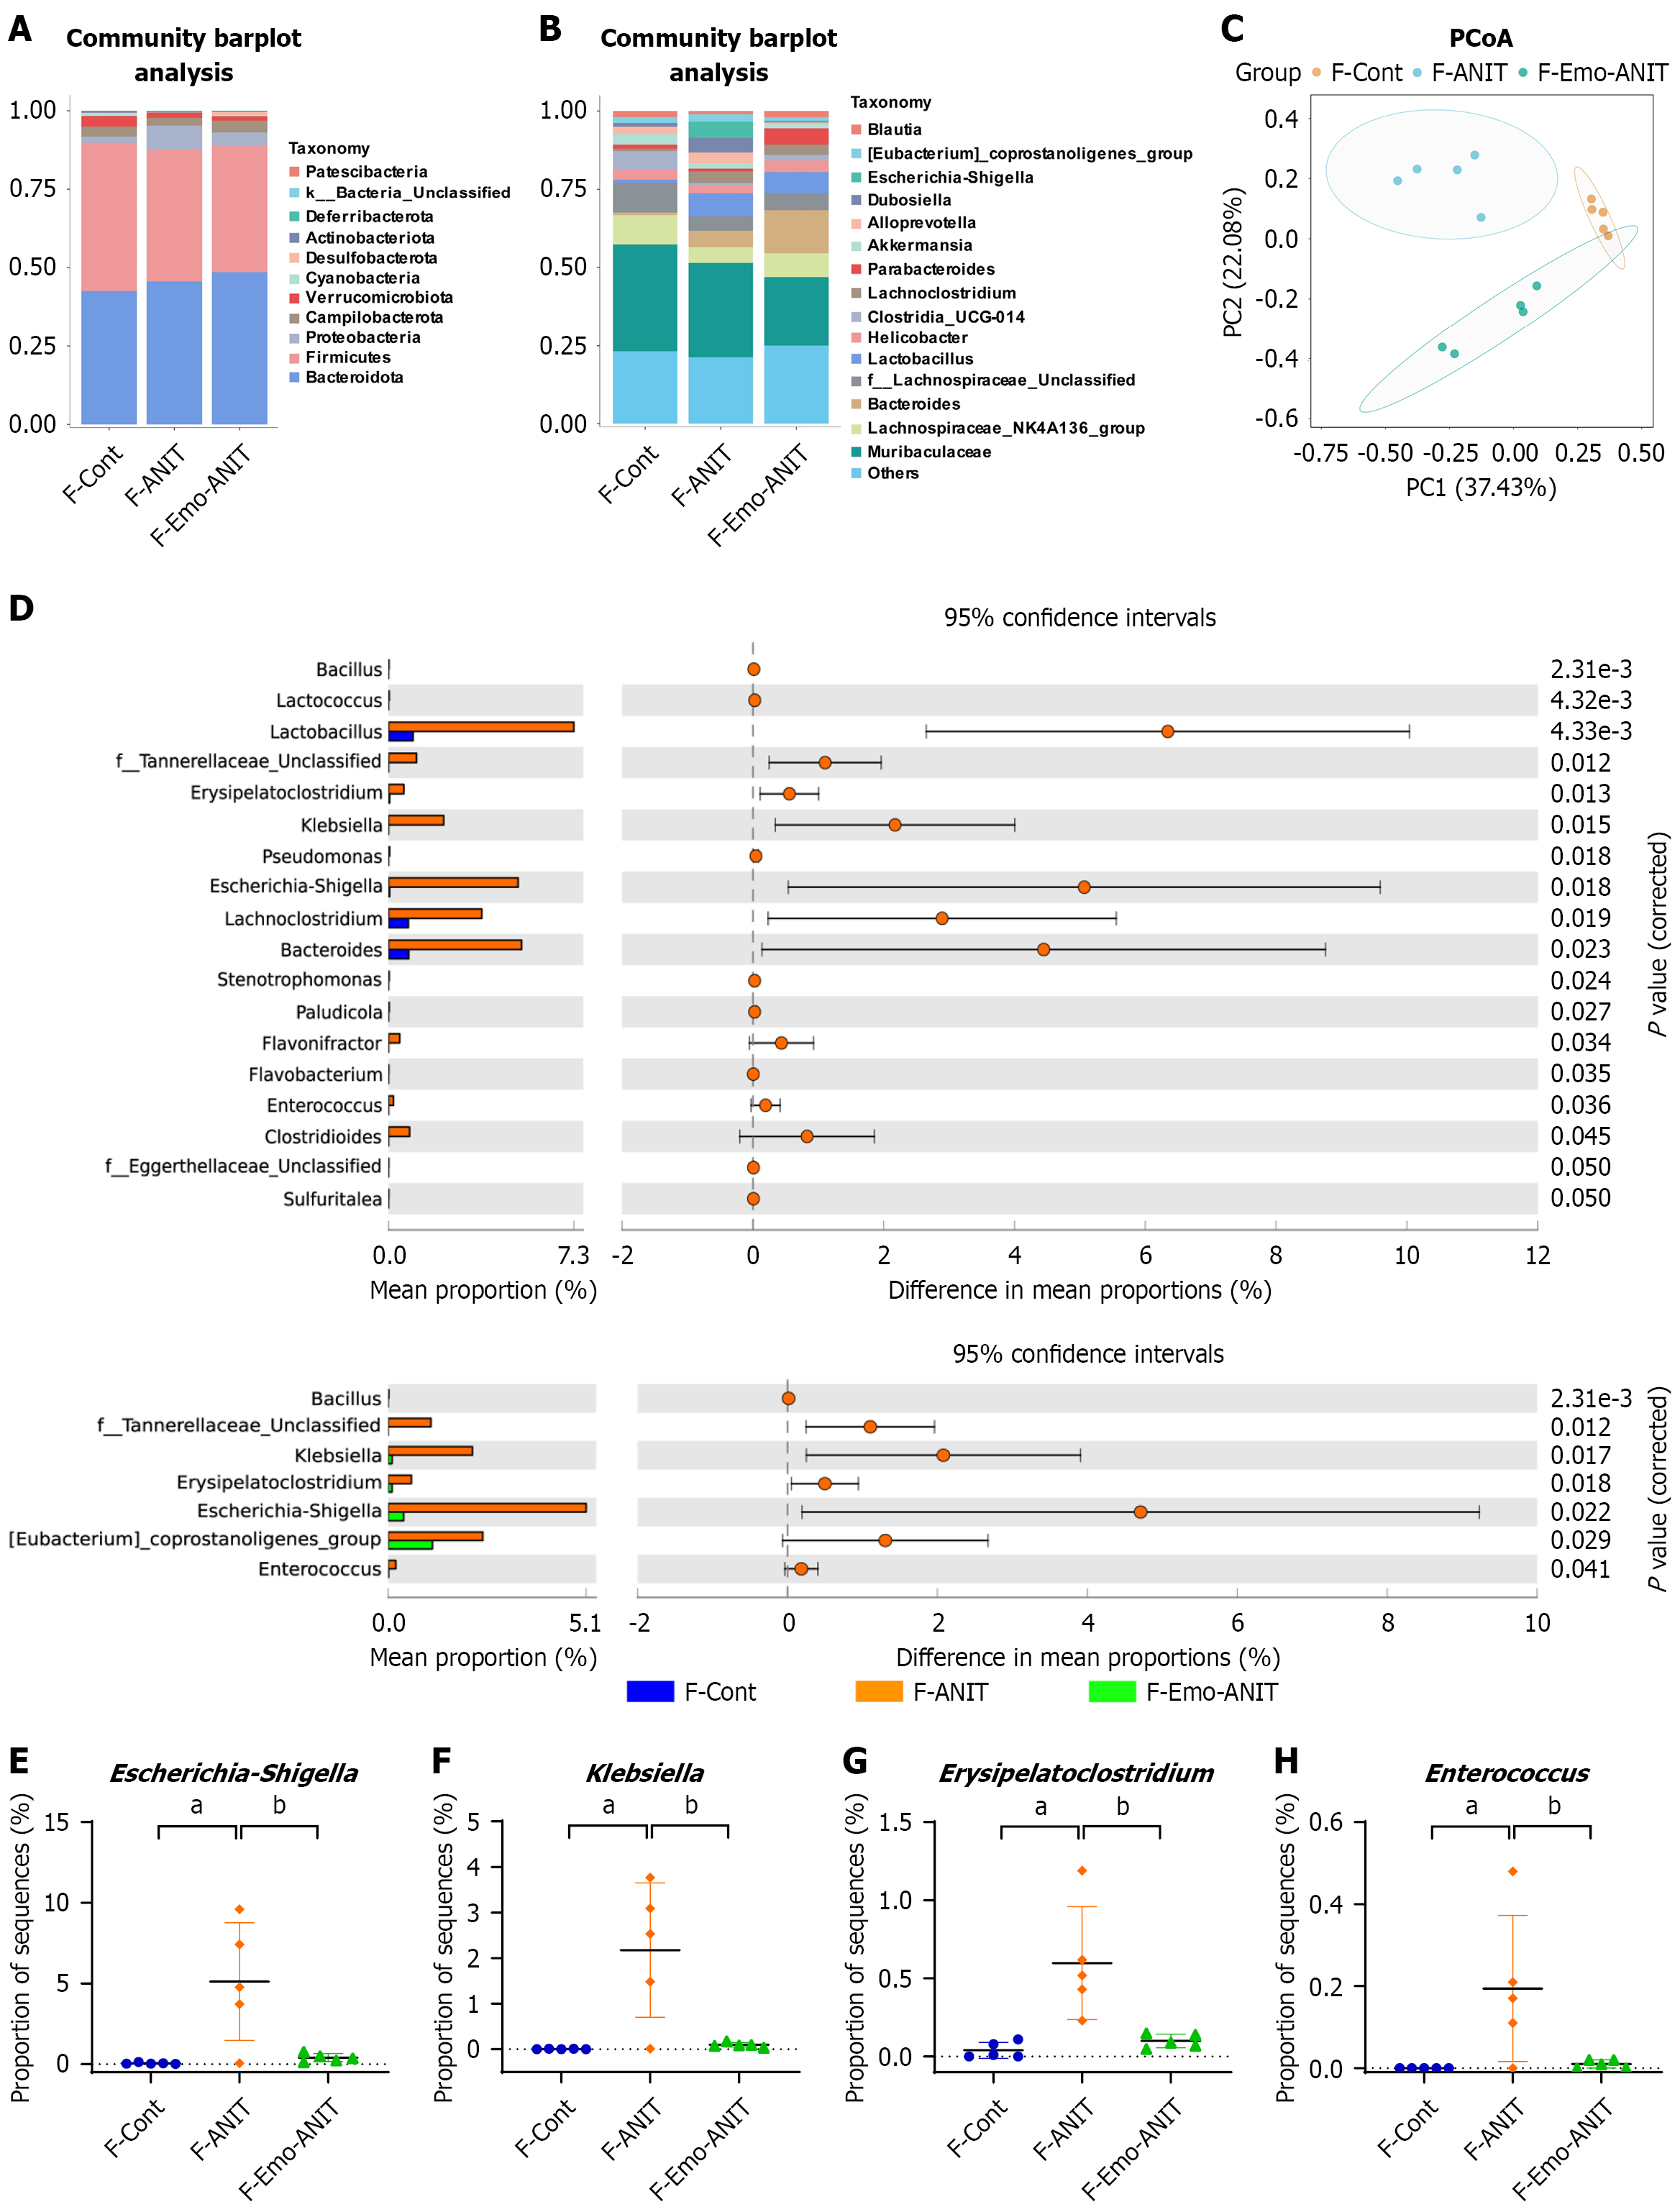
Figure 11 Fecal microbiota transplantation of emodin-fed mice modulated gut microbiota.
A: Bacterial community composition at the phylum level; B: Bacterial community composition at the genus level; C: Principal co-ordinates analysis of the gut microbiota in each group at the genus level; D: STAMP analysis uncovered the differences between F-control and F-α-naphthylisothiocyanate (ANIT) groups, F-ANIT and F-emodin-ANIT groups (the P value < 0.05 for declaring significance); E-H: Relative abundance of differential microbiota. Data were analyzed via two-sided Welch’s t-test, n = 5. aP < 0.05 vs control group, bP < 0.05 vs α-naphthylisothiocyanate group. Cont: Control; Emo: Emodin; ANIT: Α-naphthylisothiocyanate; PCoA: Principal co-ordinates analysis.
- Citation: Wang CX, Wang LM, Fu ZF, Zhao X, Han LF, Lou YF. Emodin ameliorates cholestatic liver injury by regulating bile acid metabolism and gut microbiota in mice. World J Gastroenterol 2026; 32(44): 117819
- URL: https://www.wjgnet.com/1007-9327/full/v32/i44/117819.htm
- DOI: https://dx.doi.org/10.3748/wjg.117819