Copyright
©The Author(s) 2025.
World J Clin Cases. Oct 16, 2025; 13(29): 111096
Published online Oct 16, 2025. doi: 10.12998/wjcc.v13.i29.111096
Published online Oct 16, 2025. doi: 10.12998/wjcc.v13.i29.111096
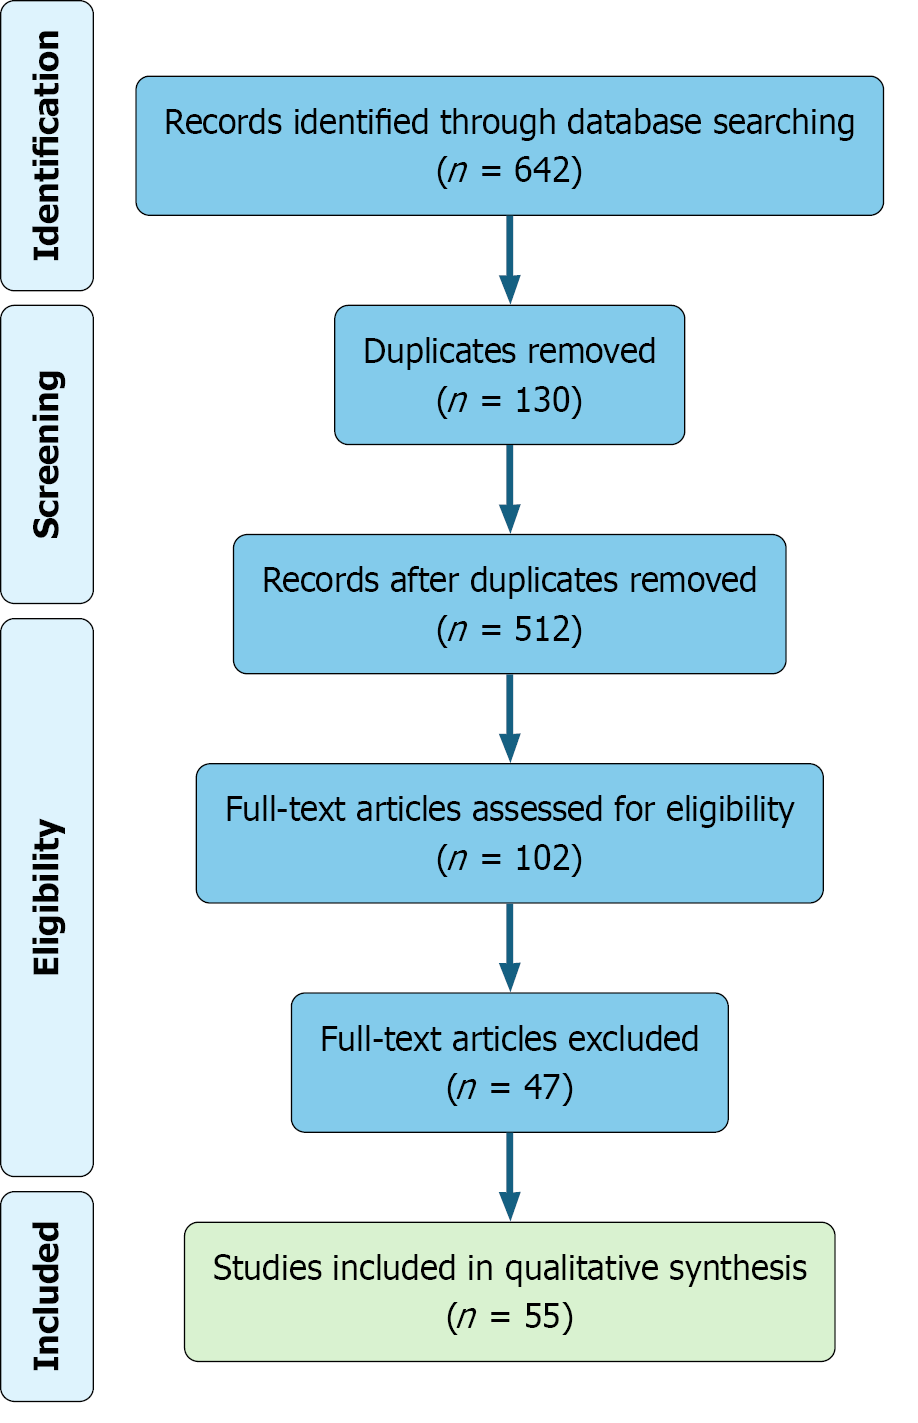
Figure 1 PRISMA flow diagram outlining the study selection process.
A total of 642 records were identified through database searching. After removal of 130 duplicates, 512 records underwent title and abstract screening. Of these, 102 full-text articles were assessed for eligibility, resulting in 55 studies included in the final qualitative synthesis.
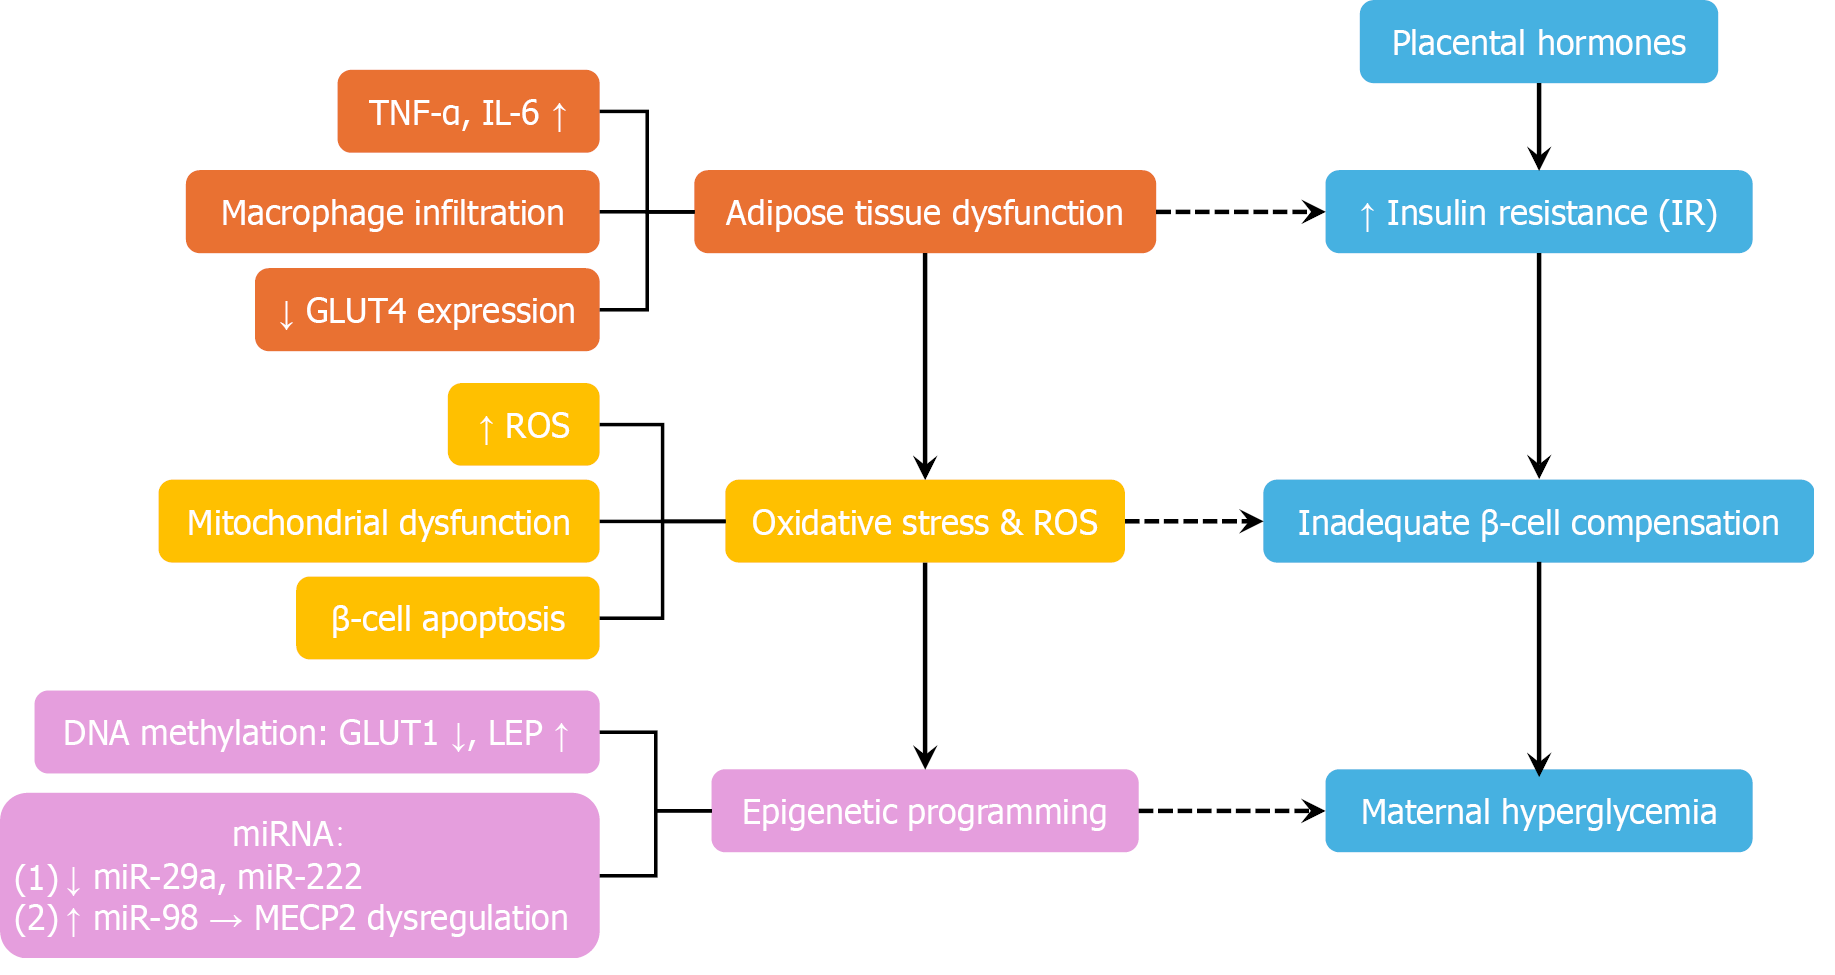
Figure 2 Pathophysiology of gestational diabetes mellitus: A multi-pathway model.
This diagram illustrates the multifactorial pathophysiology of gestational diabetes mellitus. Placental hormones—including human placental lactogen, estrogen, and placental growth hormone—progressively induce insulin resistance to support fetal nutrient supply. In susceptible women with insufficient β-cell compensation, this adaptive mechanism fails, resulting in maternal hyperglycemia. Simultaneously, adipose tissue dysfunction—characterized by macrophage infiltration, elevated proinflammatory cytokines [e.g., tumour necrosis factor alpha (TNF-α) and interleukin-6 (IL-6)], and decreased GLUT4 expression—further aggravates insulin resistance. Oxidative stress and mitochondrial dysfunction contribute to β-cell apoptosis and impaired insulin secretion. Epigenetic modifications, such as altered DNA methylation [e.g., decreased GLUT1 and increased leptin (LEP)] and dysregulated mRNAs (e.g., downregulated miR-29a and upregulated miR-98), are implicated in fetal metabolic programming and may perpetuate transgenerational cardiometabolic risk. Blue blocks - core insulin-glucose axis: Placental hormones, increased insulin resistance, inadequate β-cell compensation, and maternal hyperglycemia. Orange blocks - adipose inflammation and insulin resistance: Elevated TNF-α, elevated IL-6, reduced GLUT4 expression, and adipose tissue dysfunction. Yellow blocks - oxidative stress and mitochondrial dysfunction: Increased reactive oxygen species and β-cell apoptosis. Purple blocks - epigenetic mechanisms: Altered DNA methylation (e.g., decreased GLUT1 and increased LEP) and dysregulated miRNAs. TNF-α: Tumor necrosis factor alpha; IL-6: Interleukin-6; GLUT4: Glucose transporter type 4; ROS: Reactive oxygen species; LEP: Leptin; miR: MicroRNA.
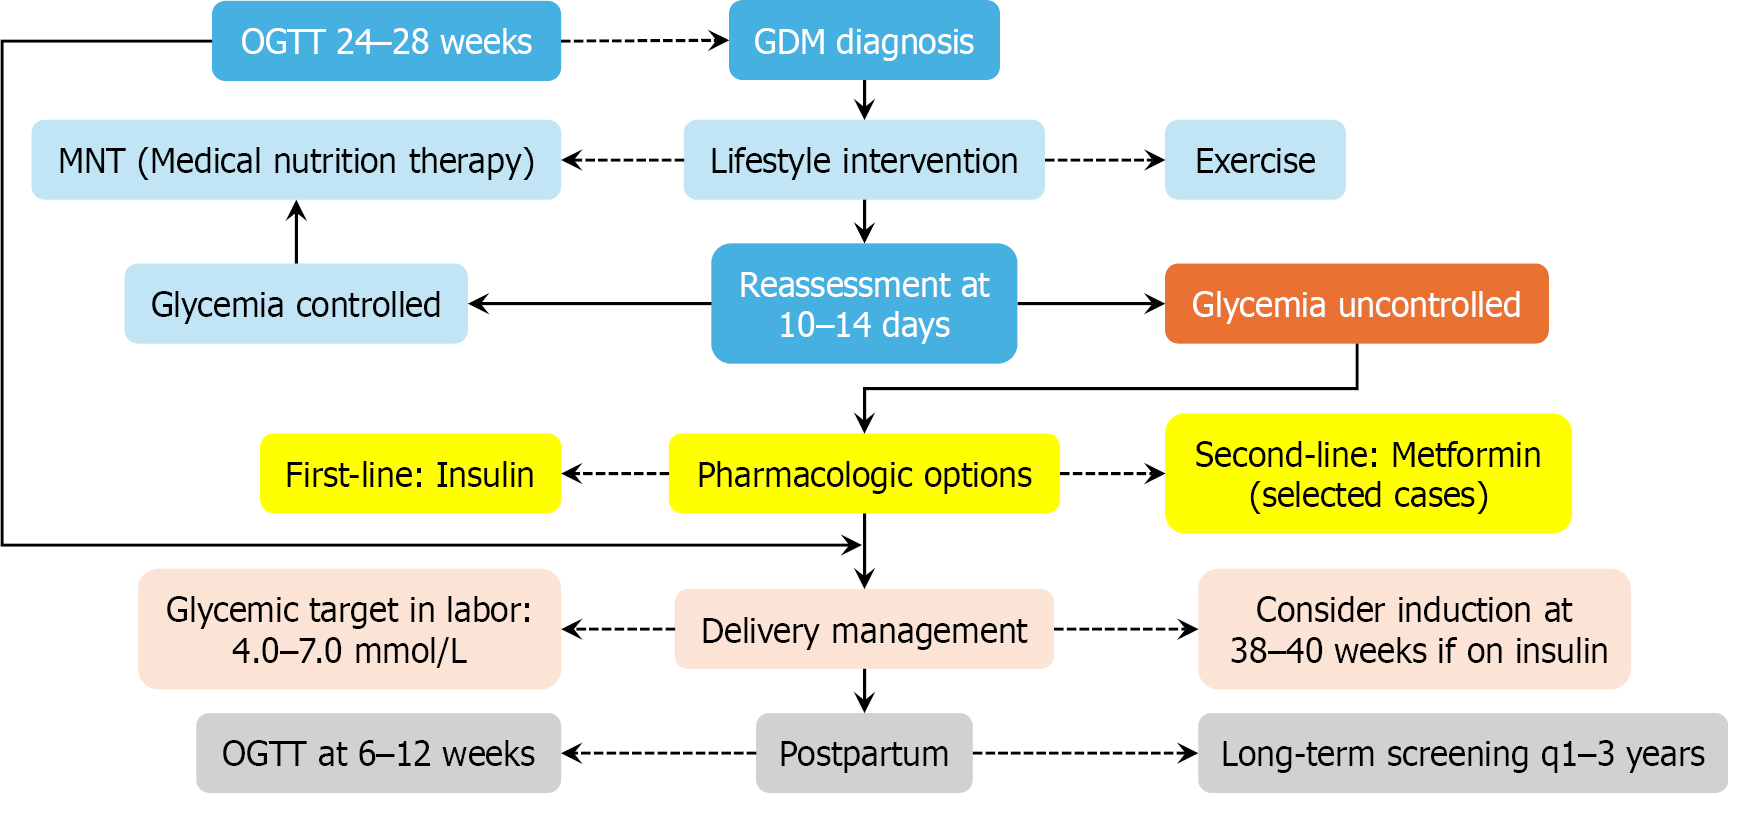
Figure 3 Stepwise clinical algorithm for the diagnosis and management of gestational diabetes mellitus.
This flowchart outlines a standardized care pathway from initial screening—via oral glucose tolerance testing (OGTT) at 24-28 weeks—to postpartum follow-up. Lifestyle intervention constitutes the cornerstone of treatment, while pharmacologic therapy (primarily insulin, with metformin as an alternative) is initiated if glycemic targets are not met within 10-14 days. Postpartum OGTT and ongoing metabolic surveillance are essential to mitigate future risks of type 2 diabetes mellitus and cardiovascular disease. Blue blocks: Diagnostic and monitoring checkpoints (e.g., OGTT at 24-28 weeks, 10-14 days reassessment). Gray-blue blocks: Lifestyle and non-pharmacologic interventions (e.g., medical nutrition therapy, exercise, and glycemic control). Orange blocks: Persistent hyperglycemia (e.g., glycemia uncontrolled). Yellow blocks: Pharmacologic therapy and delivery planning (e.g., insulin initiation, intrapartum glucose targets). Pale-pink blocks: Intrapartum management and delivery timing considerations. Pale-gray blocks: Postpartum surveillance (e.g., OGTT at 6-12 weeks, annual screening every 1-3 years). GDM: Gestational diabetes mellitus; OGTT: Oral glucose tolerance test.
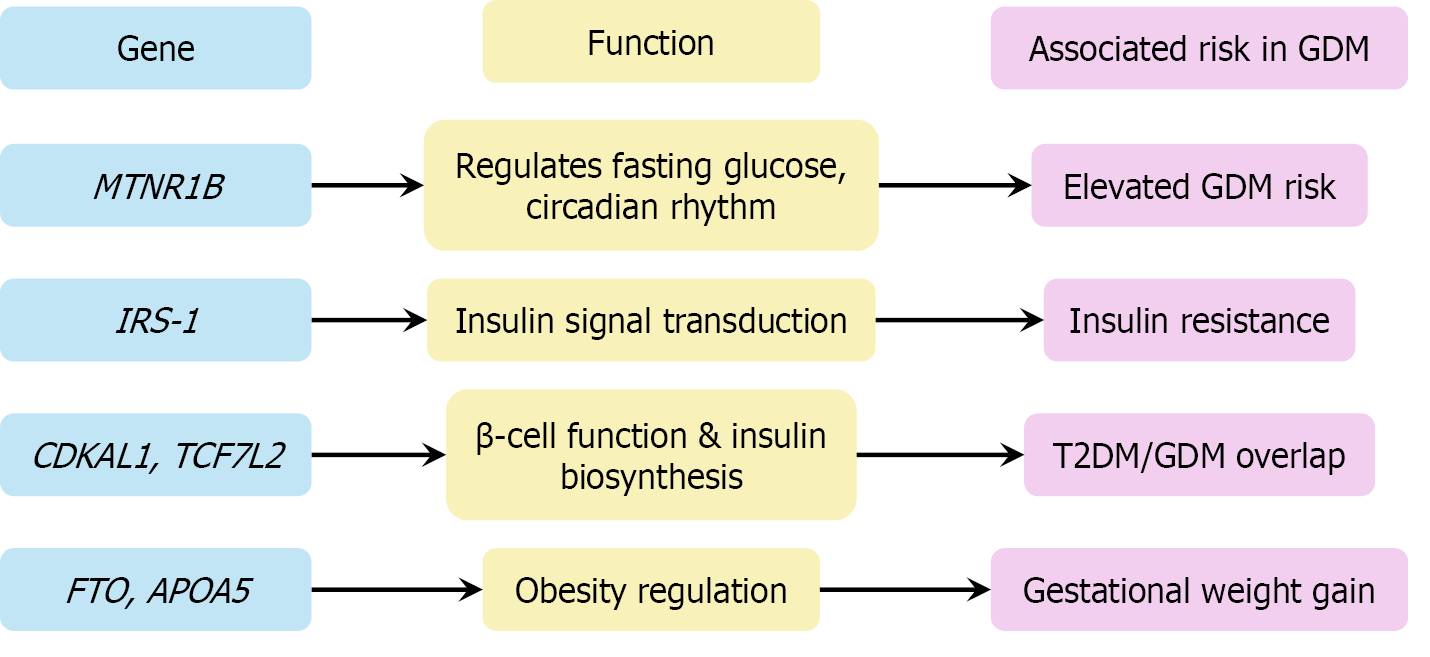
Figure 4 Genetic loci associated with gestational diabetes mellitus and their mechanistic roles in disease pathogenesis.
This diagram maps the key gestational diabetes mellitus-associated genes to their molecular functions. MTNR1B and IRS-1 regulate glucose metabolism and insulin signaling. CDKAL1 and TCF7 L2 impair β-cell proliferation and insulin synthesis. Obesity-related genes such as FTO and APOA5 contribute to gestational weight gain and metabolic dysregulation, reinforcing the polygenic basis of gestational diabetes mellitus. GDM: Gestational diabetes mellitus; T2DM: Type 2 diabetes mellitus.
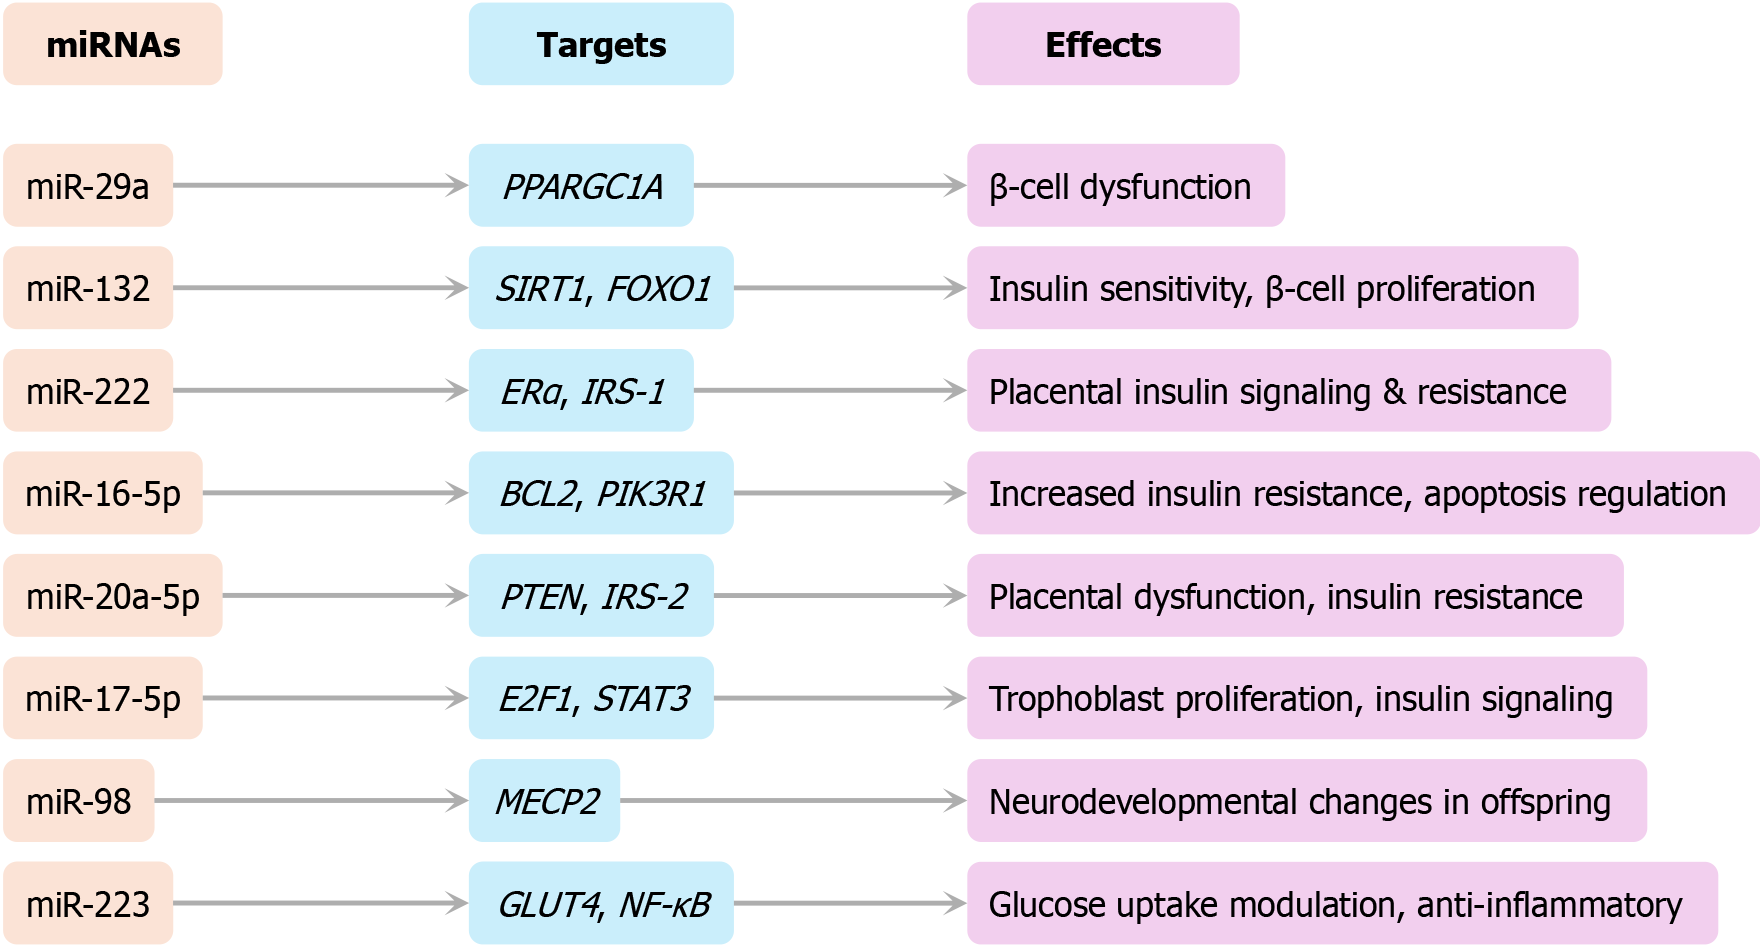
Figure 5 Regulatory network of dysregulated microRNAs in gestational diabetes mellitus.
This network diagram illustrates experimentally validated interactions between dysregulated miRNAs, their molecular targets, and their physiological impacts—including insulin resistance, β-cell dysfunction, and placental adaptation.
Figure 6 Conceptual pathway from genetic and epigenetic factors to offspring risk in gestational diabetes mellitus.
This conceptual diagram links maternal genetic predisposition (e.g., MTNR1B and IRS-1), epigenetic alterations (e.g., DNA methylation of MEST and PIK3R5; dysregulation of miR-29a and miR-223), and transgenerational metabolic outcomes such as obesity, insulin resistance, and type 2 diabetes mellitus in offspring.
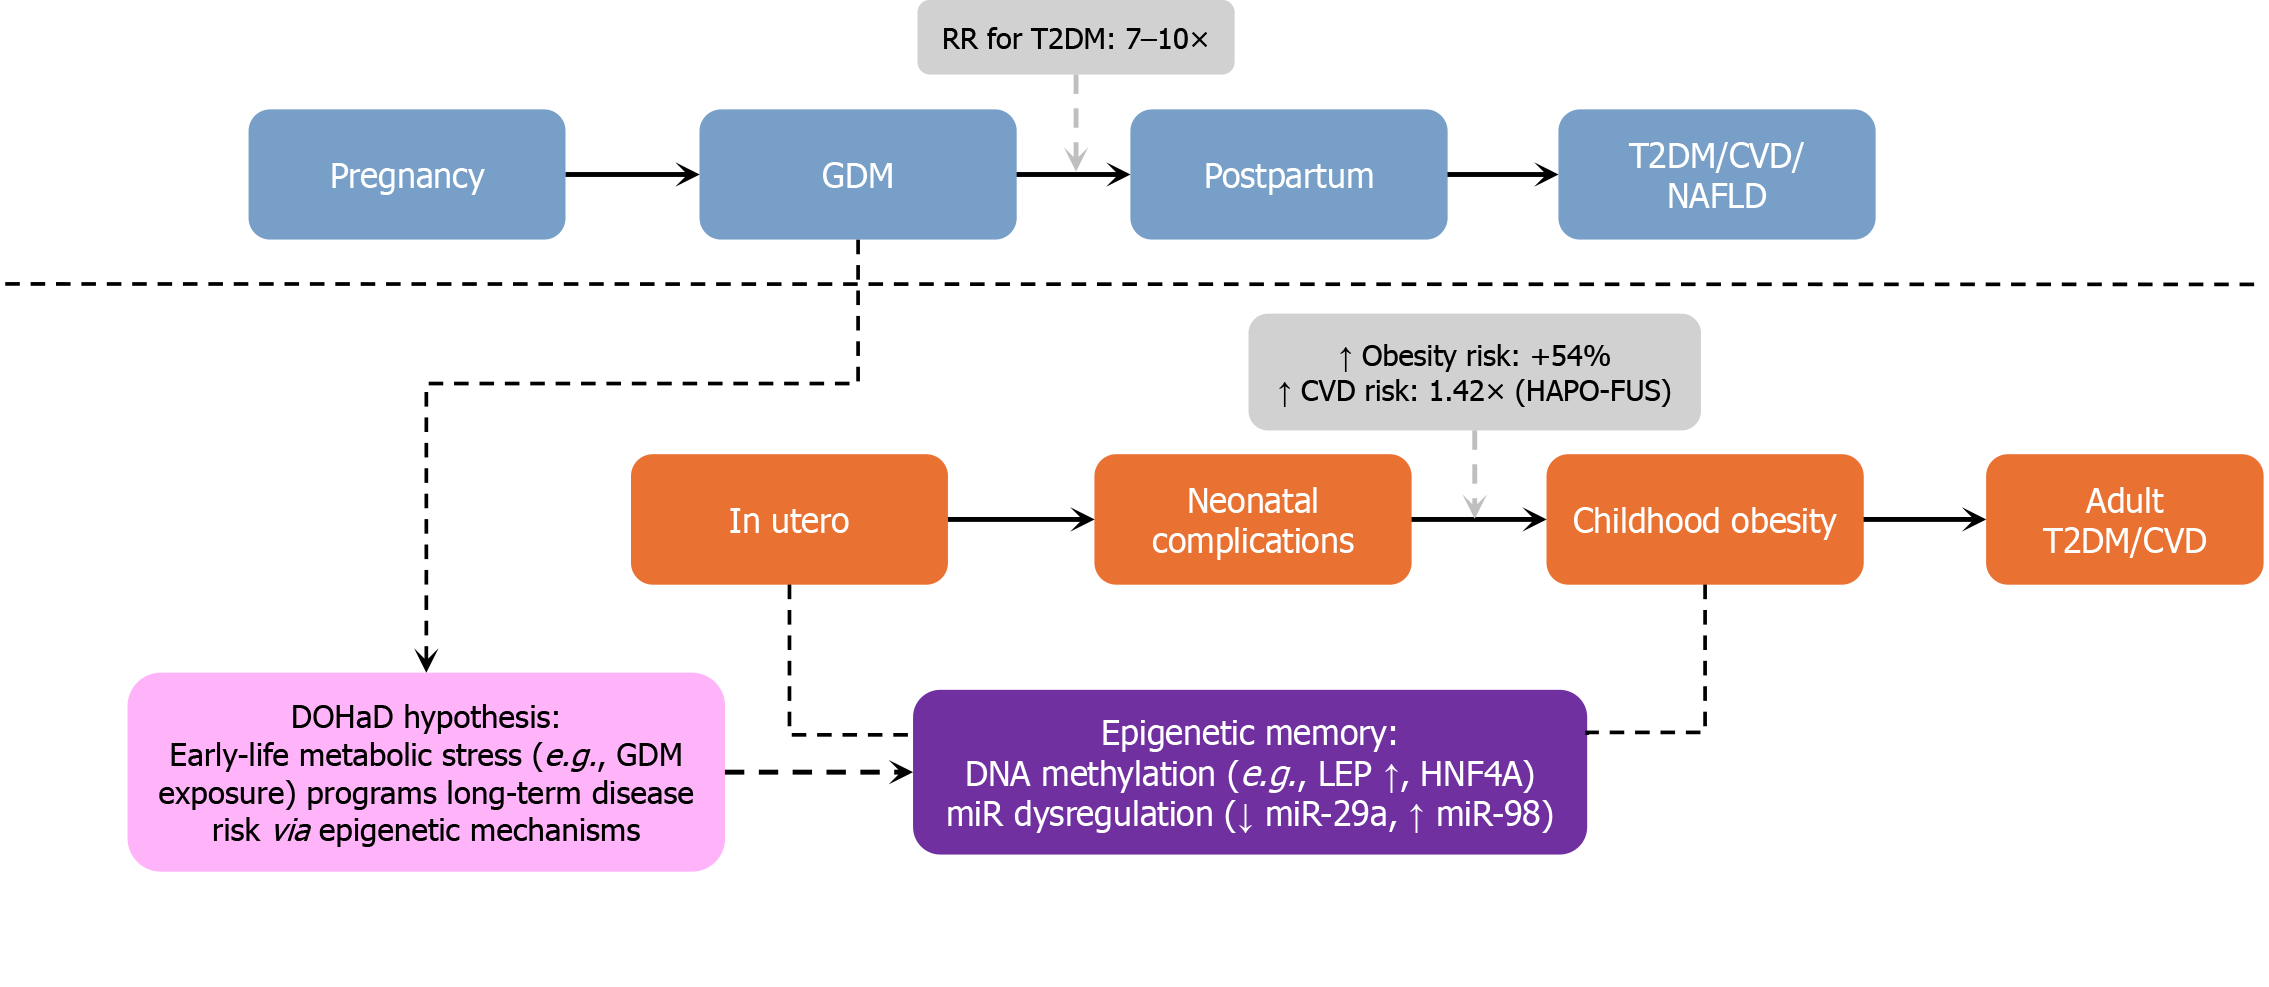
Figure 7 Life-course impact of gestational diabetes mellitus.
This schematic illustrates the parallel health trajectories of mothers and their offspring following exposure to gestational diabetes mellitus (GDM). Maternal risks include progression to type 2 diabetes mellitus (T2DM) [relative risk (RR) = 7-10], cardiovascular disease (RR = 1.98), and NAFLD. Offspring face increased risks of neonatal complications, childhood obesity (54% higher), insulin resistance, and adult-onset cardiovascular disease (RR = 1.42). Central drivers include DOHaD-based fetal programming, persistent epigenetic alterations, and transgenerational metabolic stress. Blue blocks: Maternal life stages (GDM → postpartum → T2DM/CVD/NAFLD). Orange blocks: Offspring trajectory (neonatal → childhood → adult metabolic disease). Purple blocks: Epigenetic memory (e.g., increased LEP methylation, decreased miR-29a, and increased miR-98). Light-purple blocks: DOHaD hypothesis - epigenetic basis of lifelong risk. Gray box: Quantified risks - e.g., +54% childhood obesity; T2DM RR: 7-10 ×. RR: Relative risk; T2DM: Type 2 diabetes mellitus; CVD: Cardiovascular disease; NAFLD: Non-alcoholic fatty liver disease; DOHaD: Developmental Origins of Health and Disease; LEP: Leptin; miR: MicroRNA.
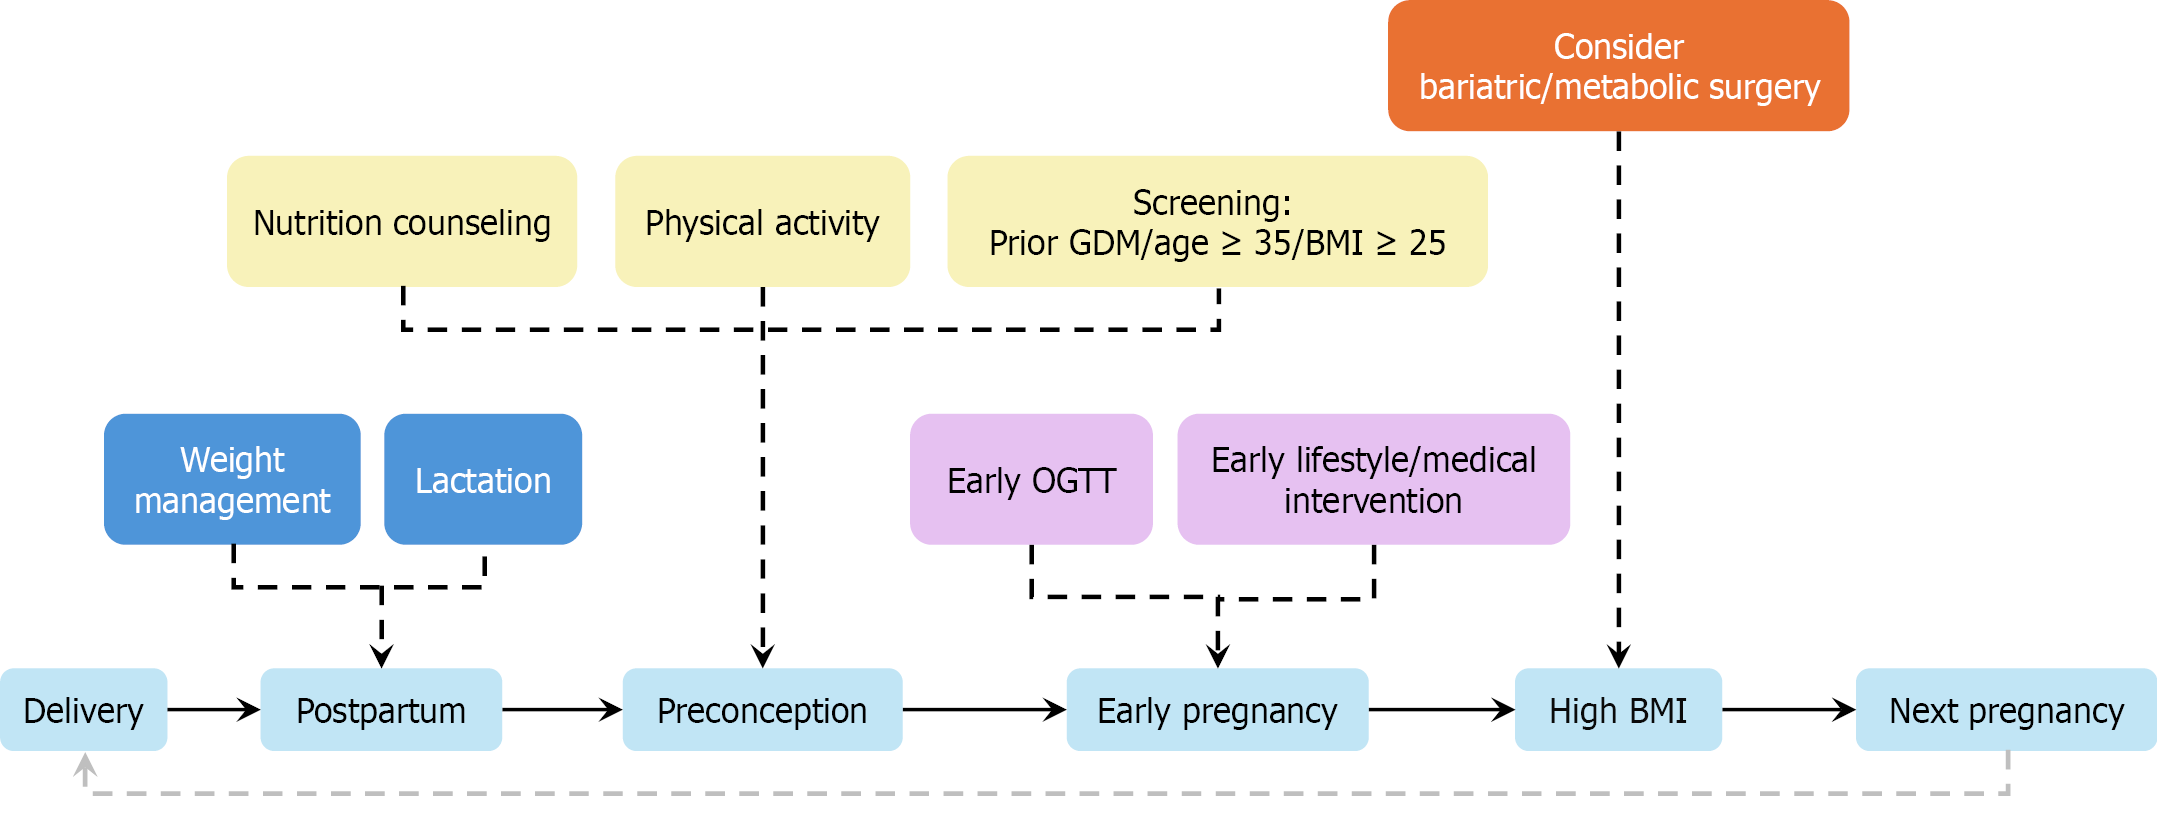
Figure 8 Timeline-based strategy for preventing recurrence of gestational diabetes mellitus.
This infographic illustrates a phased intervention model spanning postpartum to early pregnancy. Above the central timeline are stage-specific strategies: Postpartum (e.g., weight management and lactation), preconception (e.g., nutrition and screening), and early pregnancy [e.g., early oral glucose tolerance test (OGTT) and targeted therapy]. Bariatric surgery is considered for morbidly obese women (body mass index ≥ 35 kg/m²) with prior recurrence. Light-blue: Lifecycle stages. Deep-blue: Postpartum recovery (e.g., lactation and weight control). Yellow: Health promotion (e.g., physical activity and screening). Purple: Early medical interventions (e.g., early OGTT). Orange: Surgical option pathway (e.g., bariatric surgery for body mass index ≥ 35 kg/m²). OGTT: Oral glucose tolerance test; BMI: Body mass index.
- Citation: Luo QJ, Ni Q. Life-course management of gestational diabetes mellitus: A narrative review. World J Clin Cases 2025; 13(29): 111096
- URL: https://www.wjgnet.com/2307-8960/full/v13/i29/111096.htm
- DOI: https://dx.doi.org/10.12998/wjcc.v13.i29.111096


