Copyright
©The Author(s) 2022.
World J Clin Cases. Nov 26, 2022; 10(33): 12116-12135
Published online Nov 26, 2022. doi: 10.12998/wjcc.v10.i33.12116
Published online Nov 26, 2022. doi: 10.12998/wjcc.v10.i33.12116
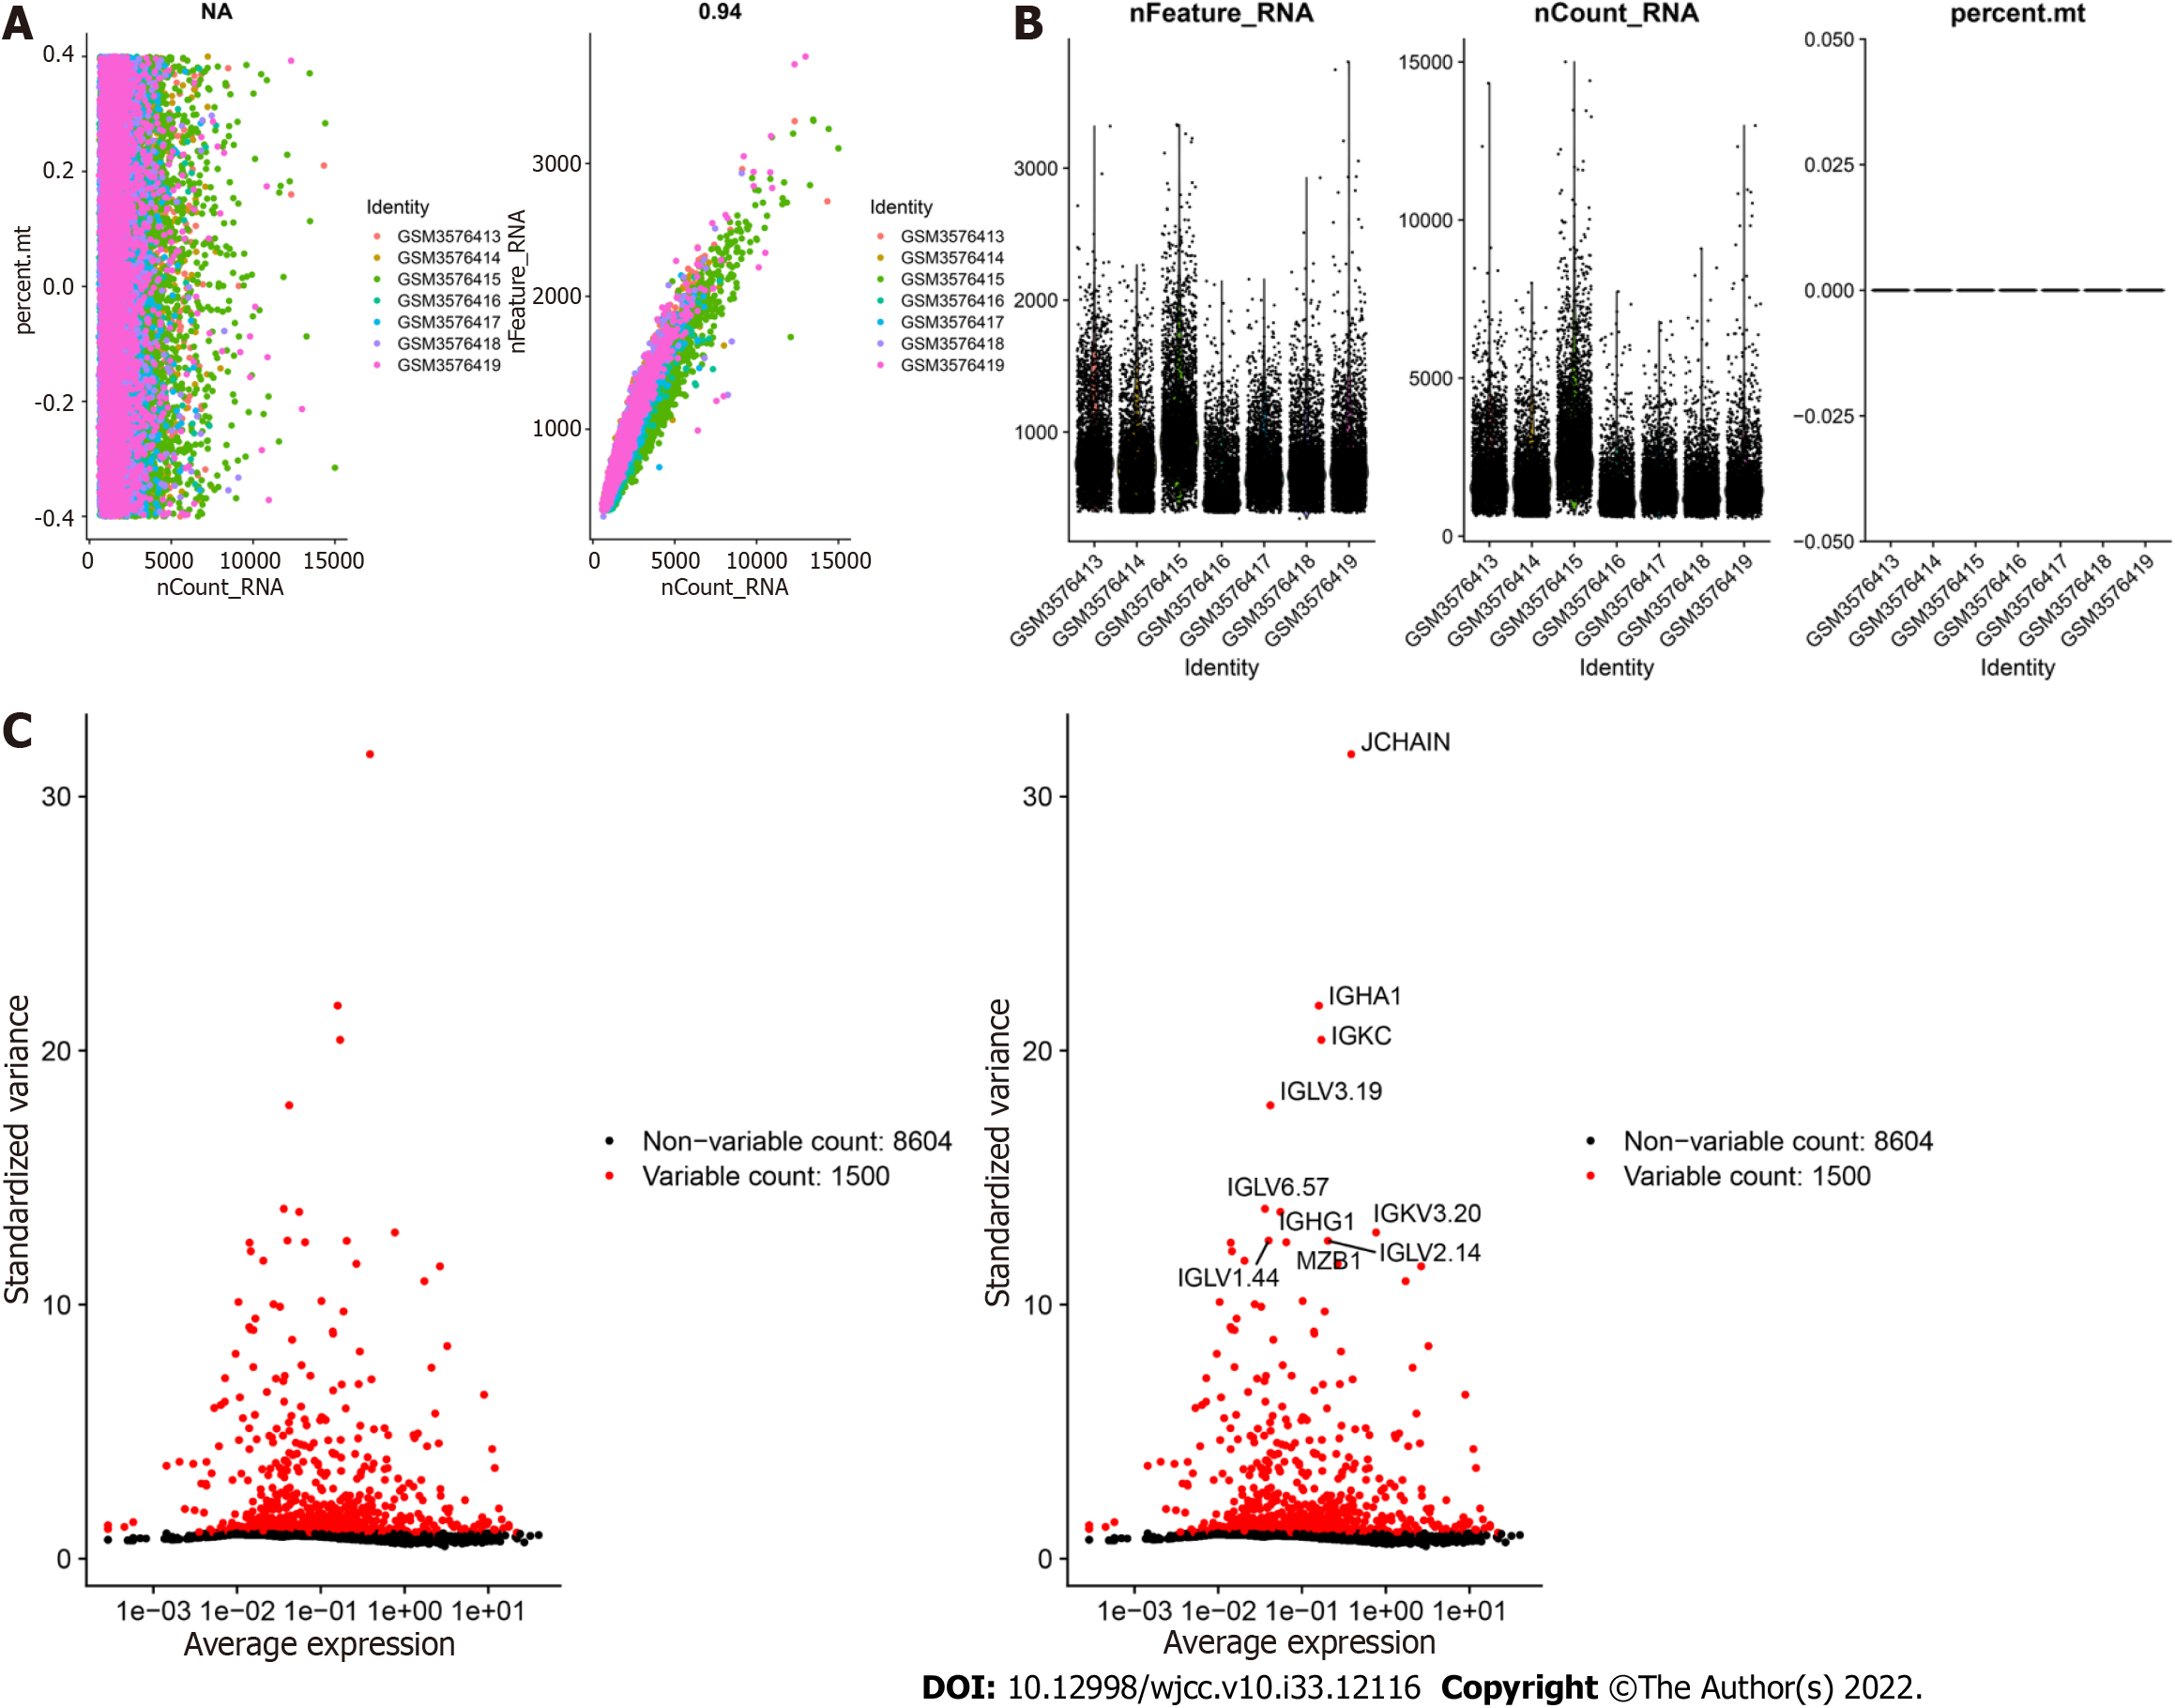
Figure 1 Characterization of single-cell RNA sequencing data from samples of peripheral blood mononuclear cells in ulcerative colitis.
A: The left graph shows the relationship between the cell sequencing depth and the mitochondrial content, and the right graph shows the relationship between the sequencing depth and the gene number, which were positively correlated. B: Quality control analysis of the PBMC samples determined the number of genes and the sequencing depth of each cell. C: Genes with significantly different expression between cells were identified, and a characteristic variance map was drawn.
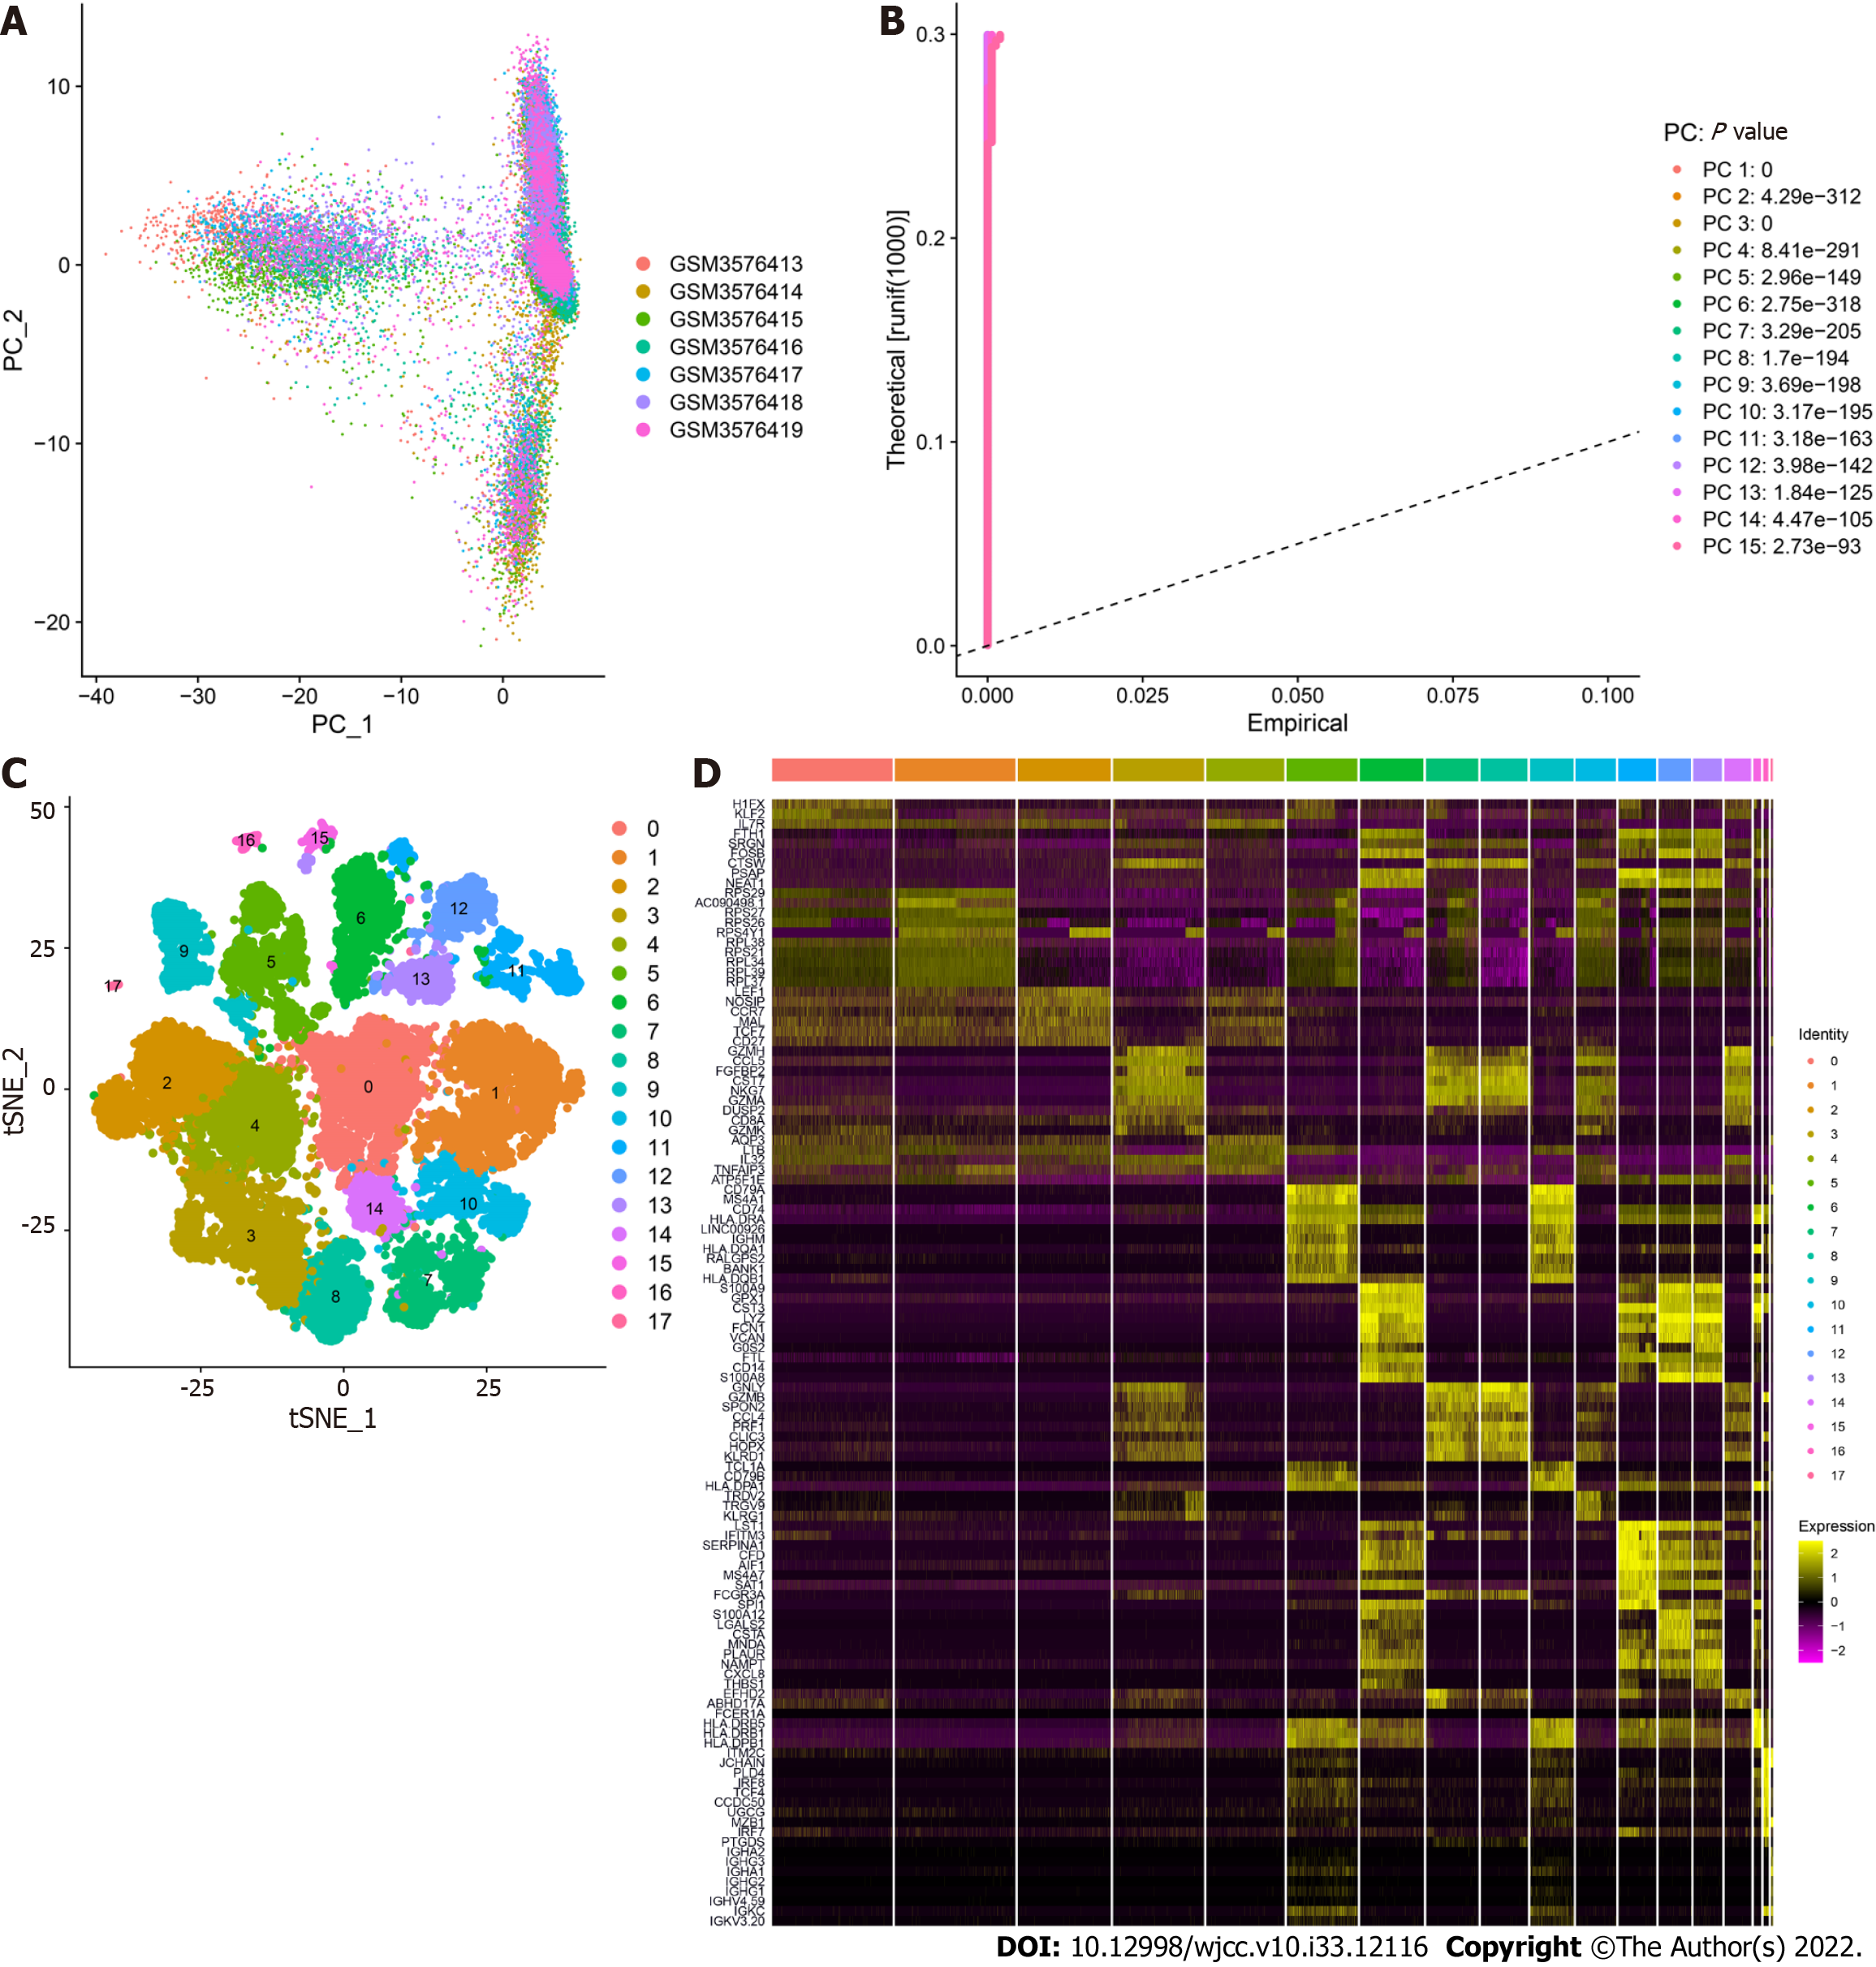
Figure 2 Clustering of peripheral blood mononuclear cell samples from ulcerative colitis patients.
A: Distribution of peripheral blood mononuclear cells. The dots represent cells, and the colors represent the samples; B: The P value corresponds to each principal component (PC), and the PC was determined based on the P value; C: According to the important components identified via PCA, the cells were divided into 17 clusters using the tSNE algorithm; D: Heatmap of the top 10 characteristic genes of each cluster.
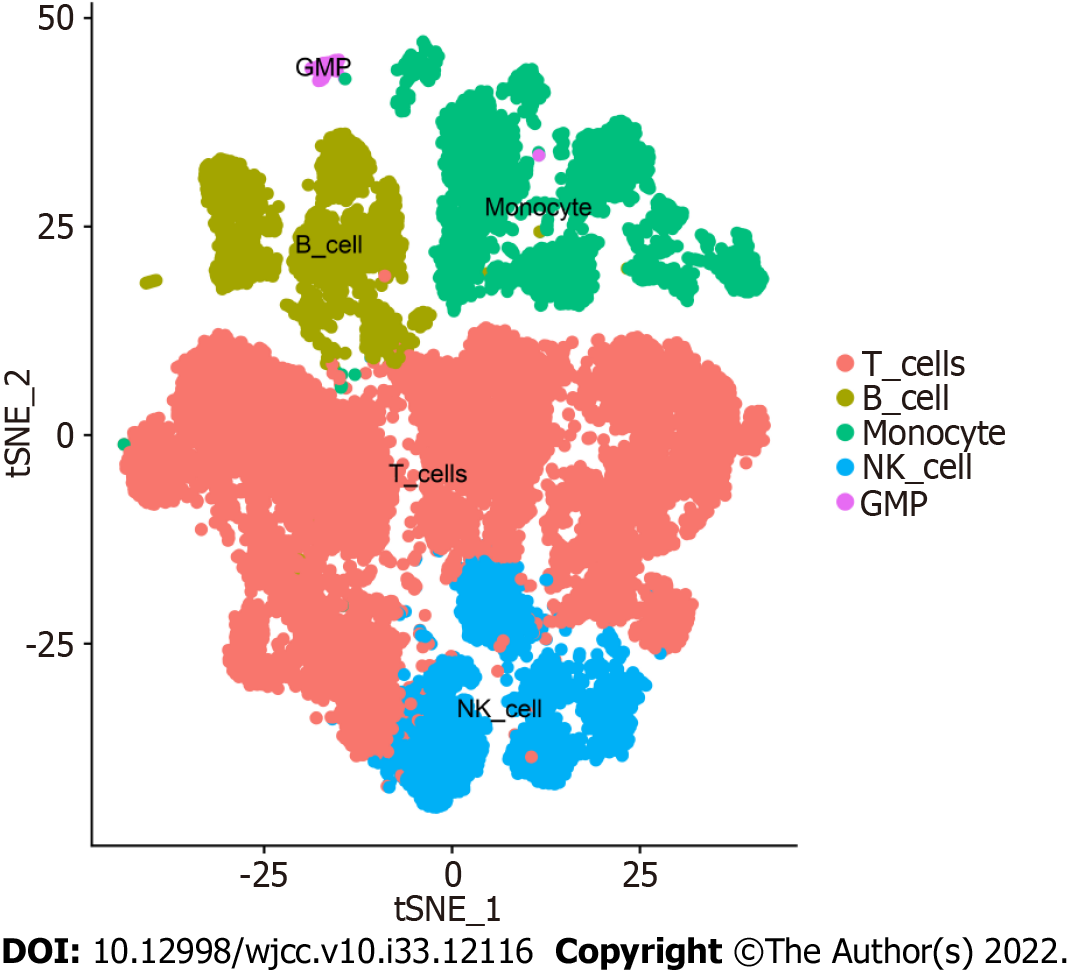
Figure 3 Cell annotation of peripheral blood mononuclear cells in ulcerative colitis.
The 17 annotated clusters were grouped into 5 cell types, namely, T cells, B cells, monocytes, NK cells, and granulocyte-monocyte progenitors.
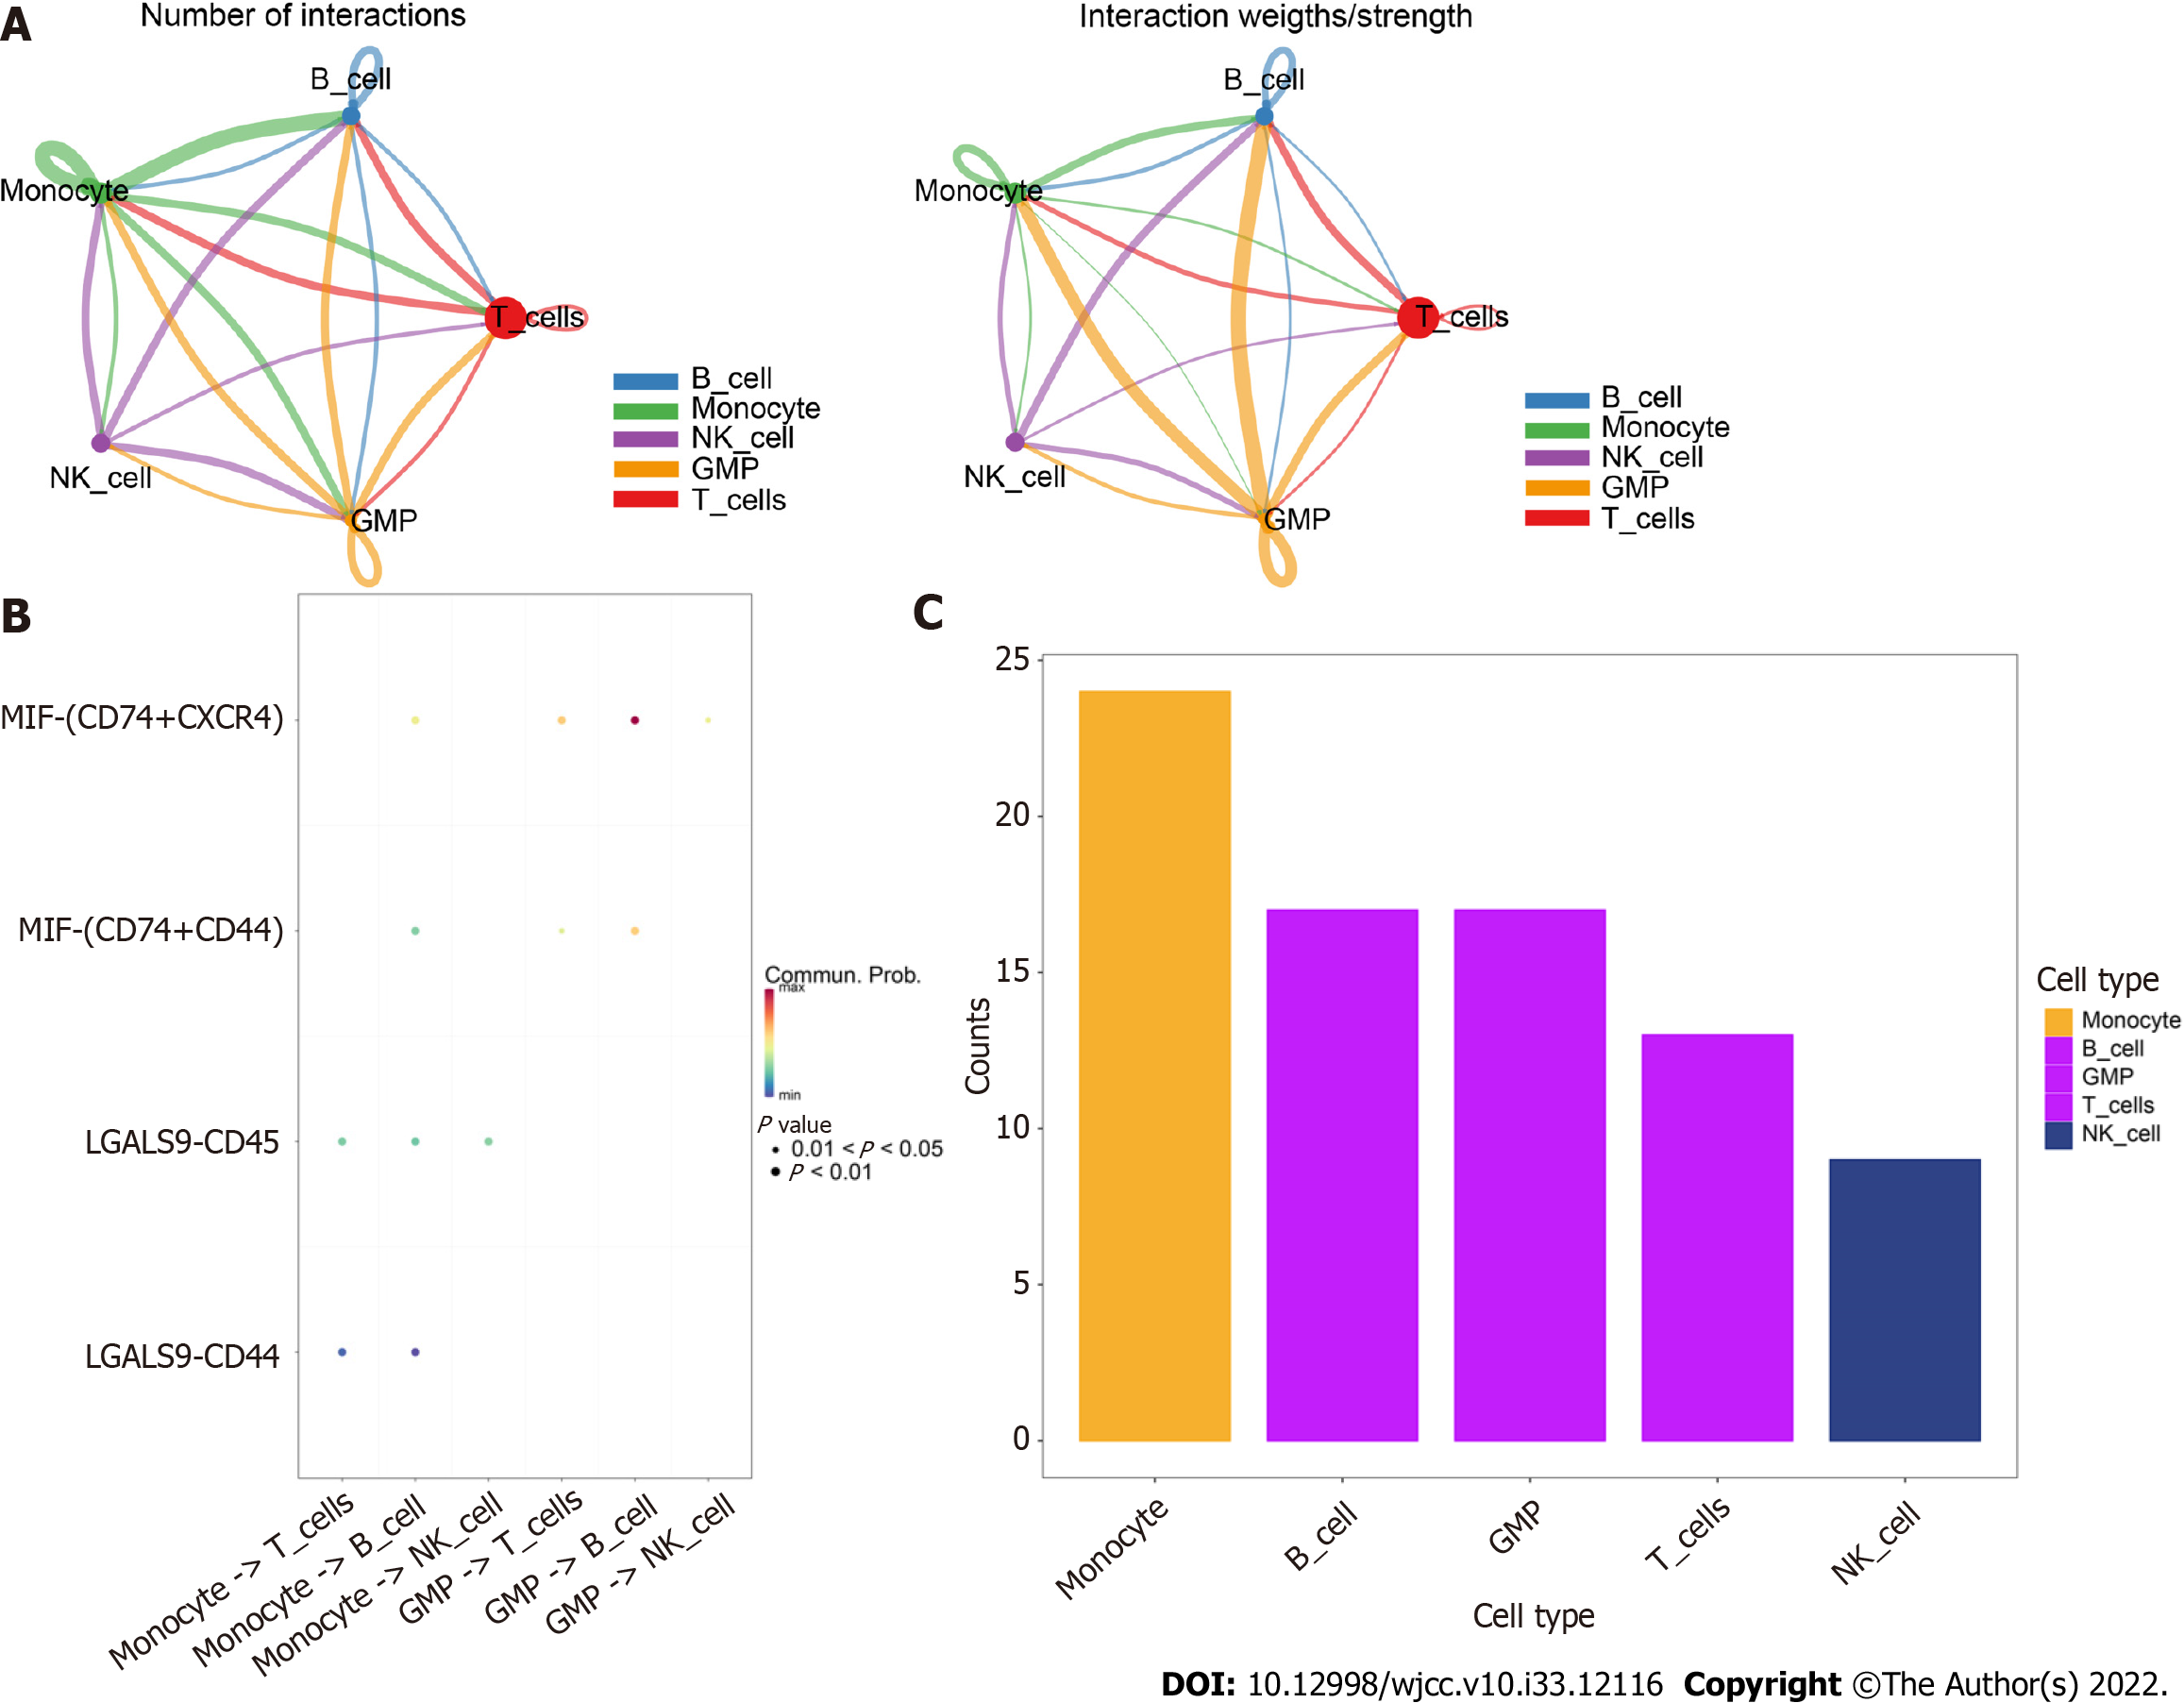
Figure 4 CellChat identification of communication between cells.
A: Network of cell interactions between the five cell types. Monocytes and B cells and B cells and granulocyte-monocyte progenitors showed the closest interactions. The dot size is proportional to the number of cells in each group, and the edge width indicates the communication probability between cells; B: Bubble diagram of receptor–ligand interactions between cells; C: Comparison of the total number of interactions in the communication network between the five cell types.
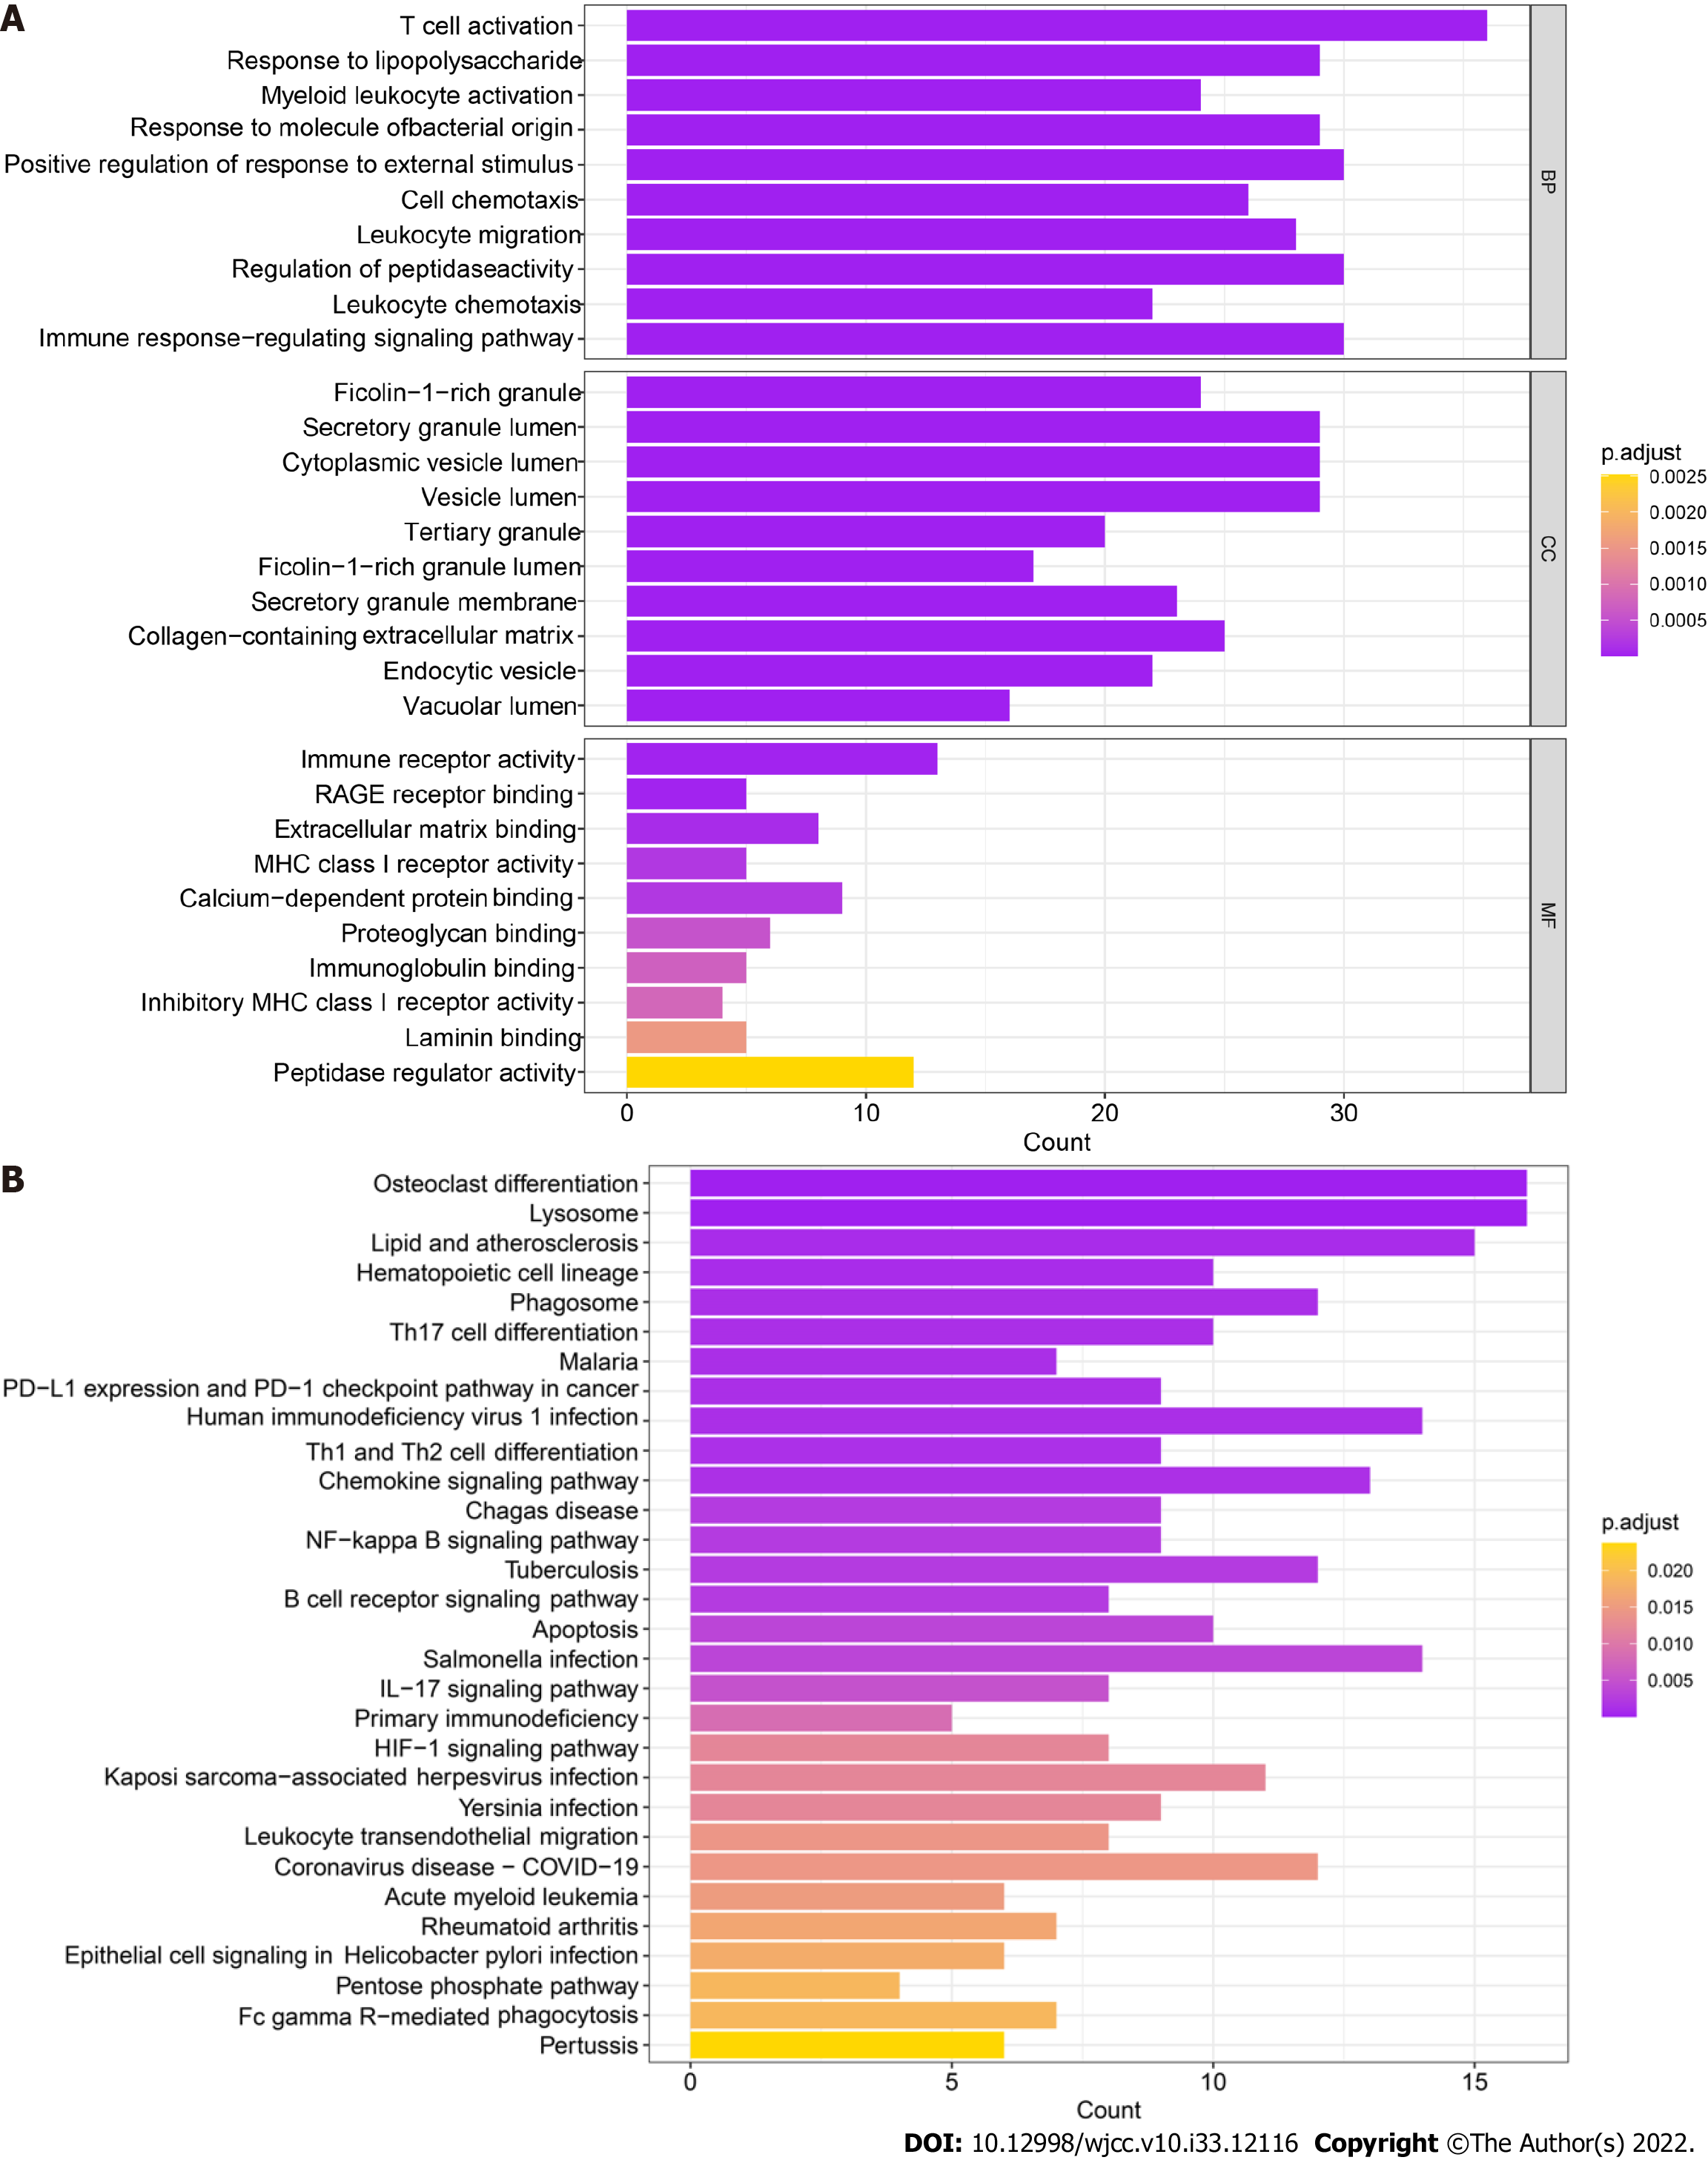
Figure 5 Functional enrichment of monocyte markers.
A: Gene Ontology enrichment analysis, including molecular function, cellular component and biological process analyses, of marker genes. The depth of the color indicates the strength of the adjusted P value; B: Kyoto Encyclopedia of Genes and Genomes enrichment analysis of marker genes. The depth of the color indicates the strength of the adjusted P value. MF: Molecular function; CC: Cellular component; BP: Biological process.
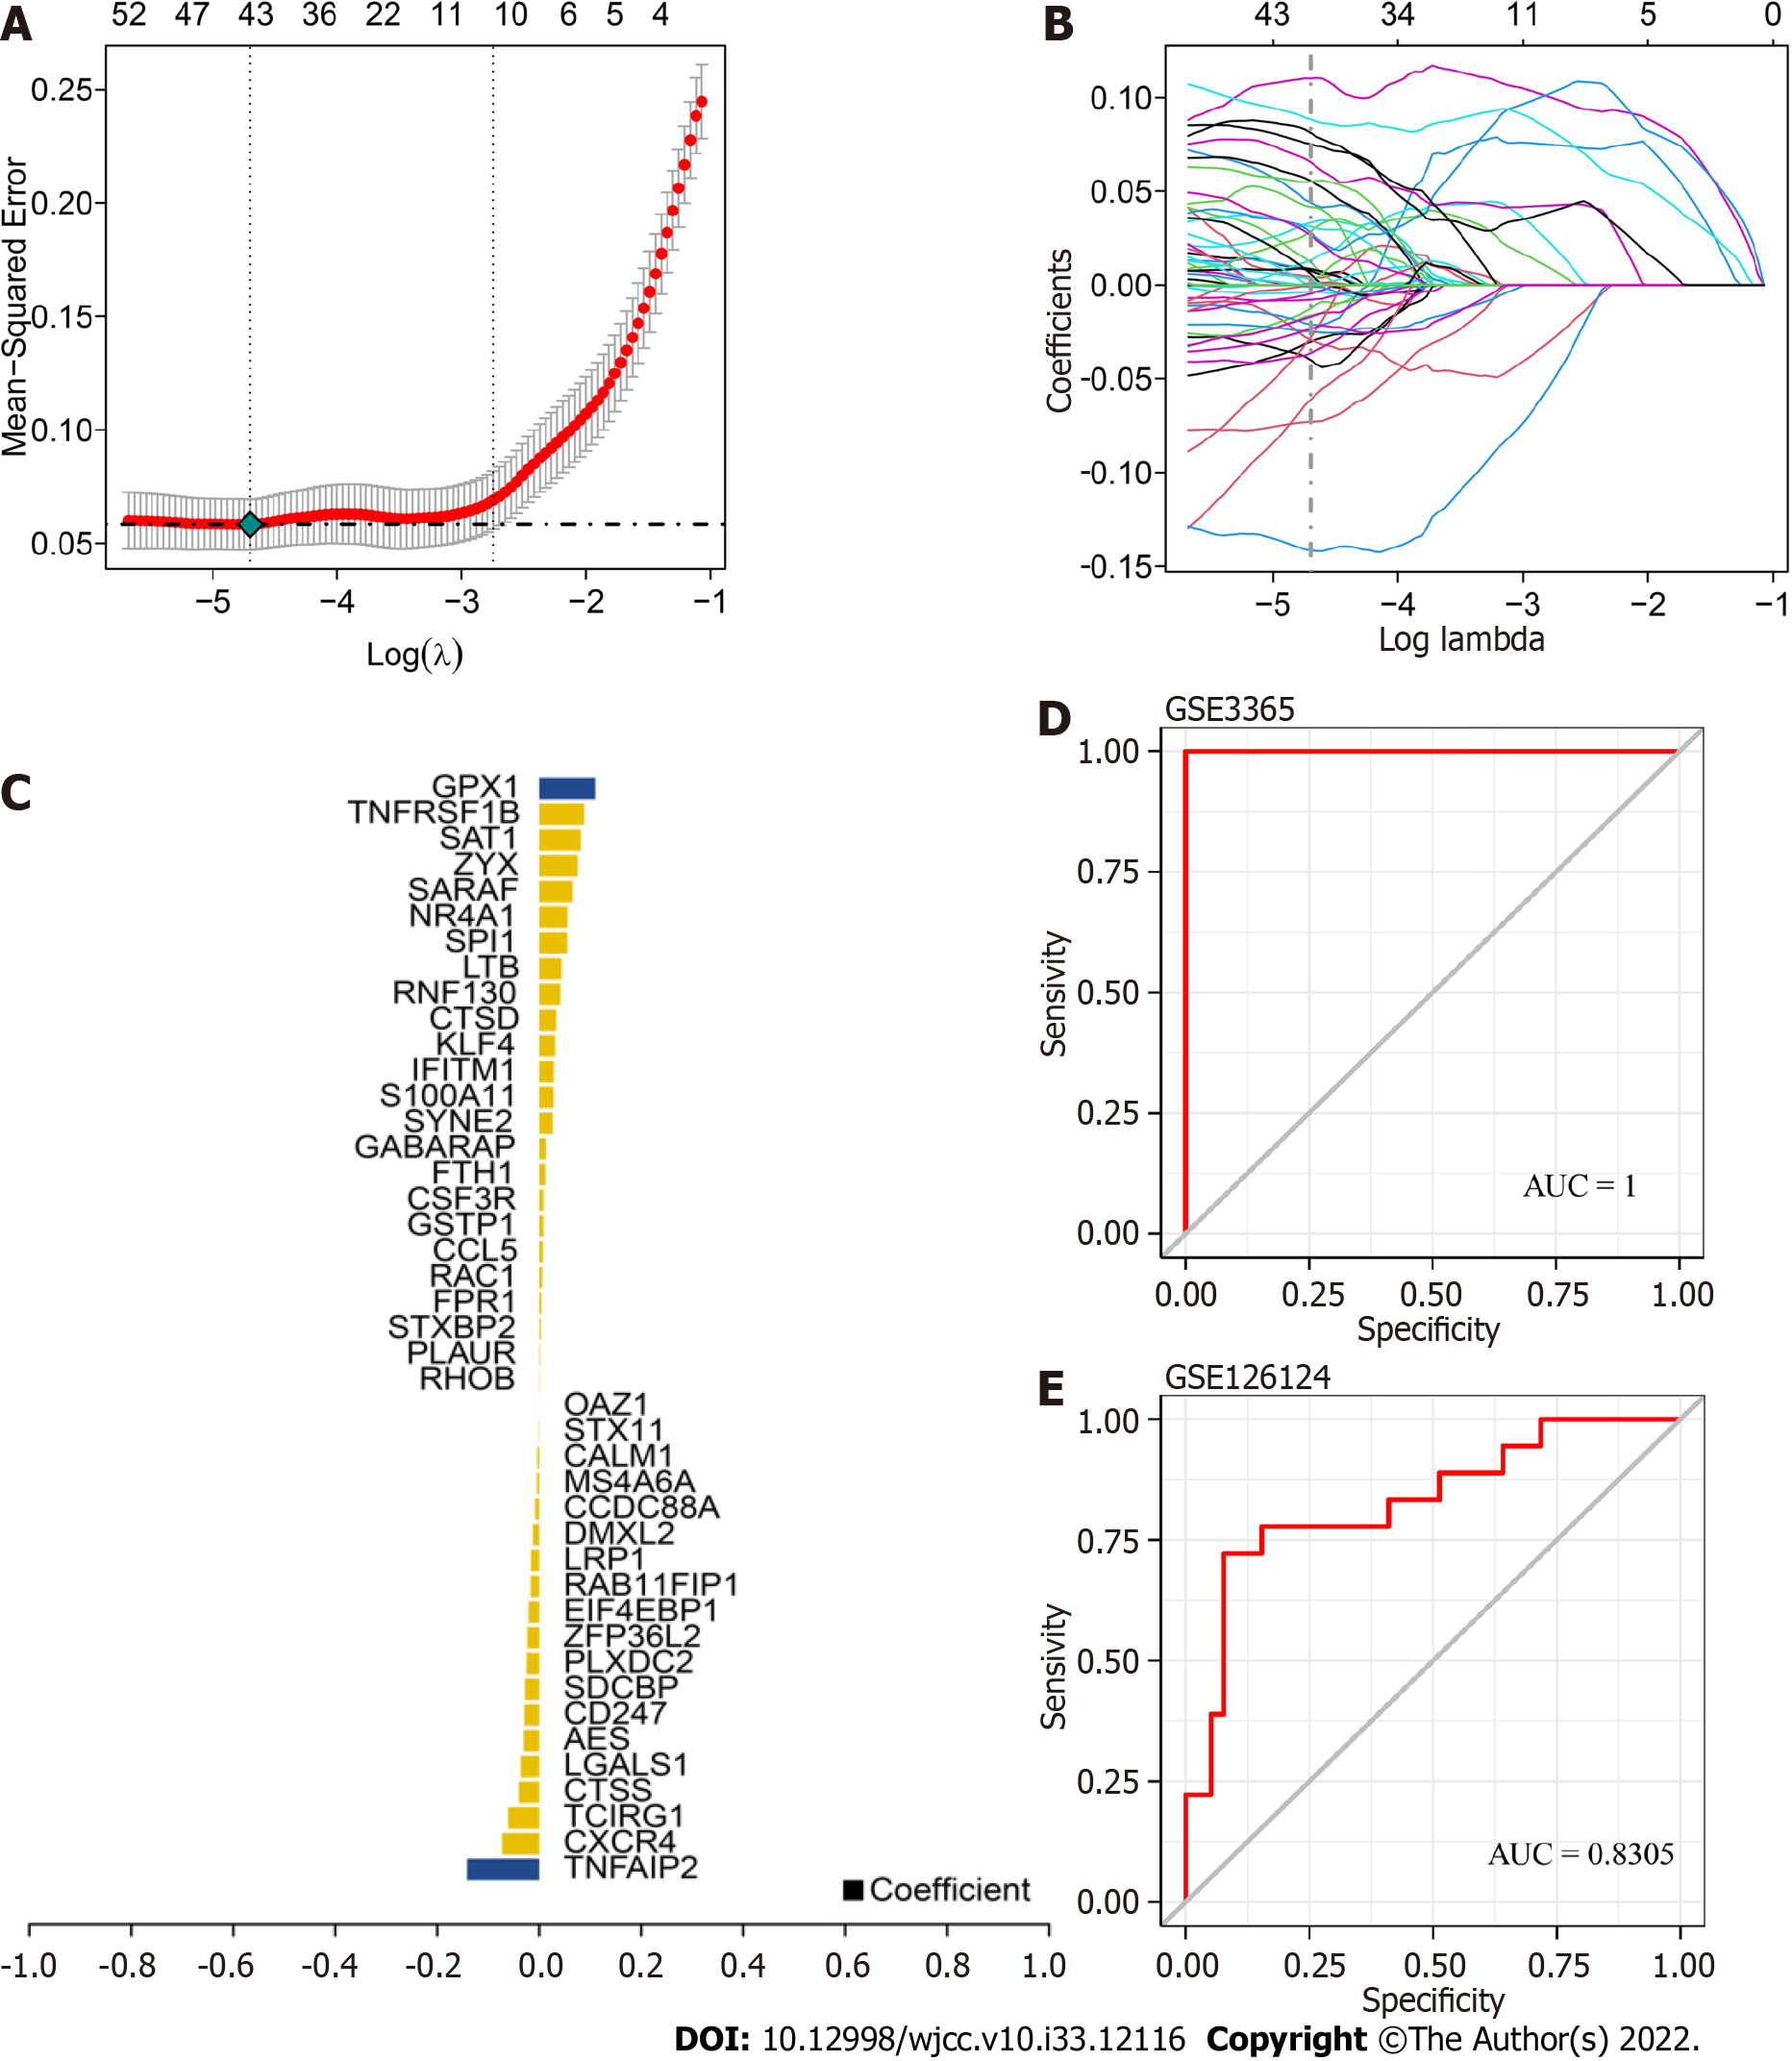
Figure 6 Identification of core genes in ulcerative colitis.
A: Tenfold cross validation of tuning parameter selection in the least absolute shrinkage and selection operator (LASSO) model; B: LASSO coefficient distribution of marker genes; C: Gene coefficients were screened by LASSO analysis; D-E: Receiver operating characteristic curves of LASSO-identified genes in both the training and validation sets. The area under the curve values were greater than 0.8, indicating that the model had good predictive efficacy.
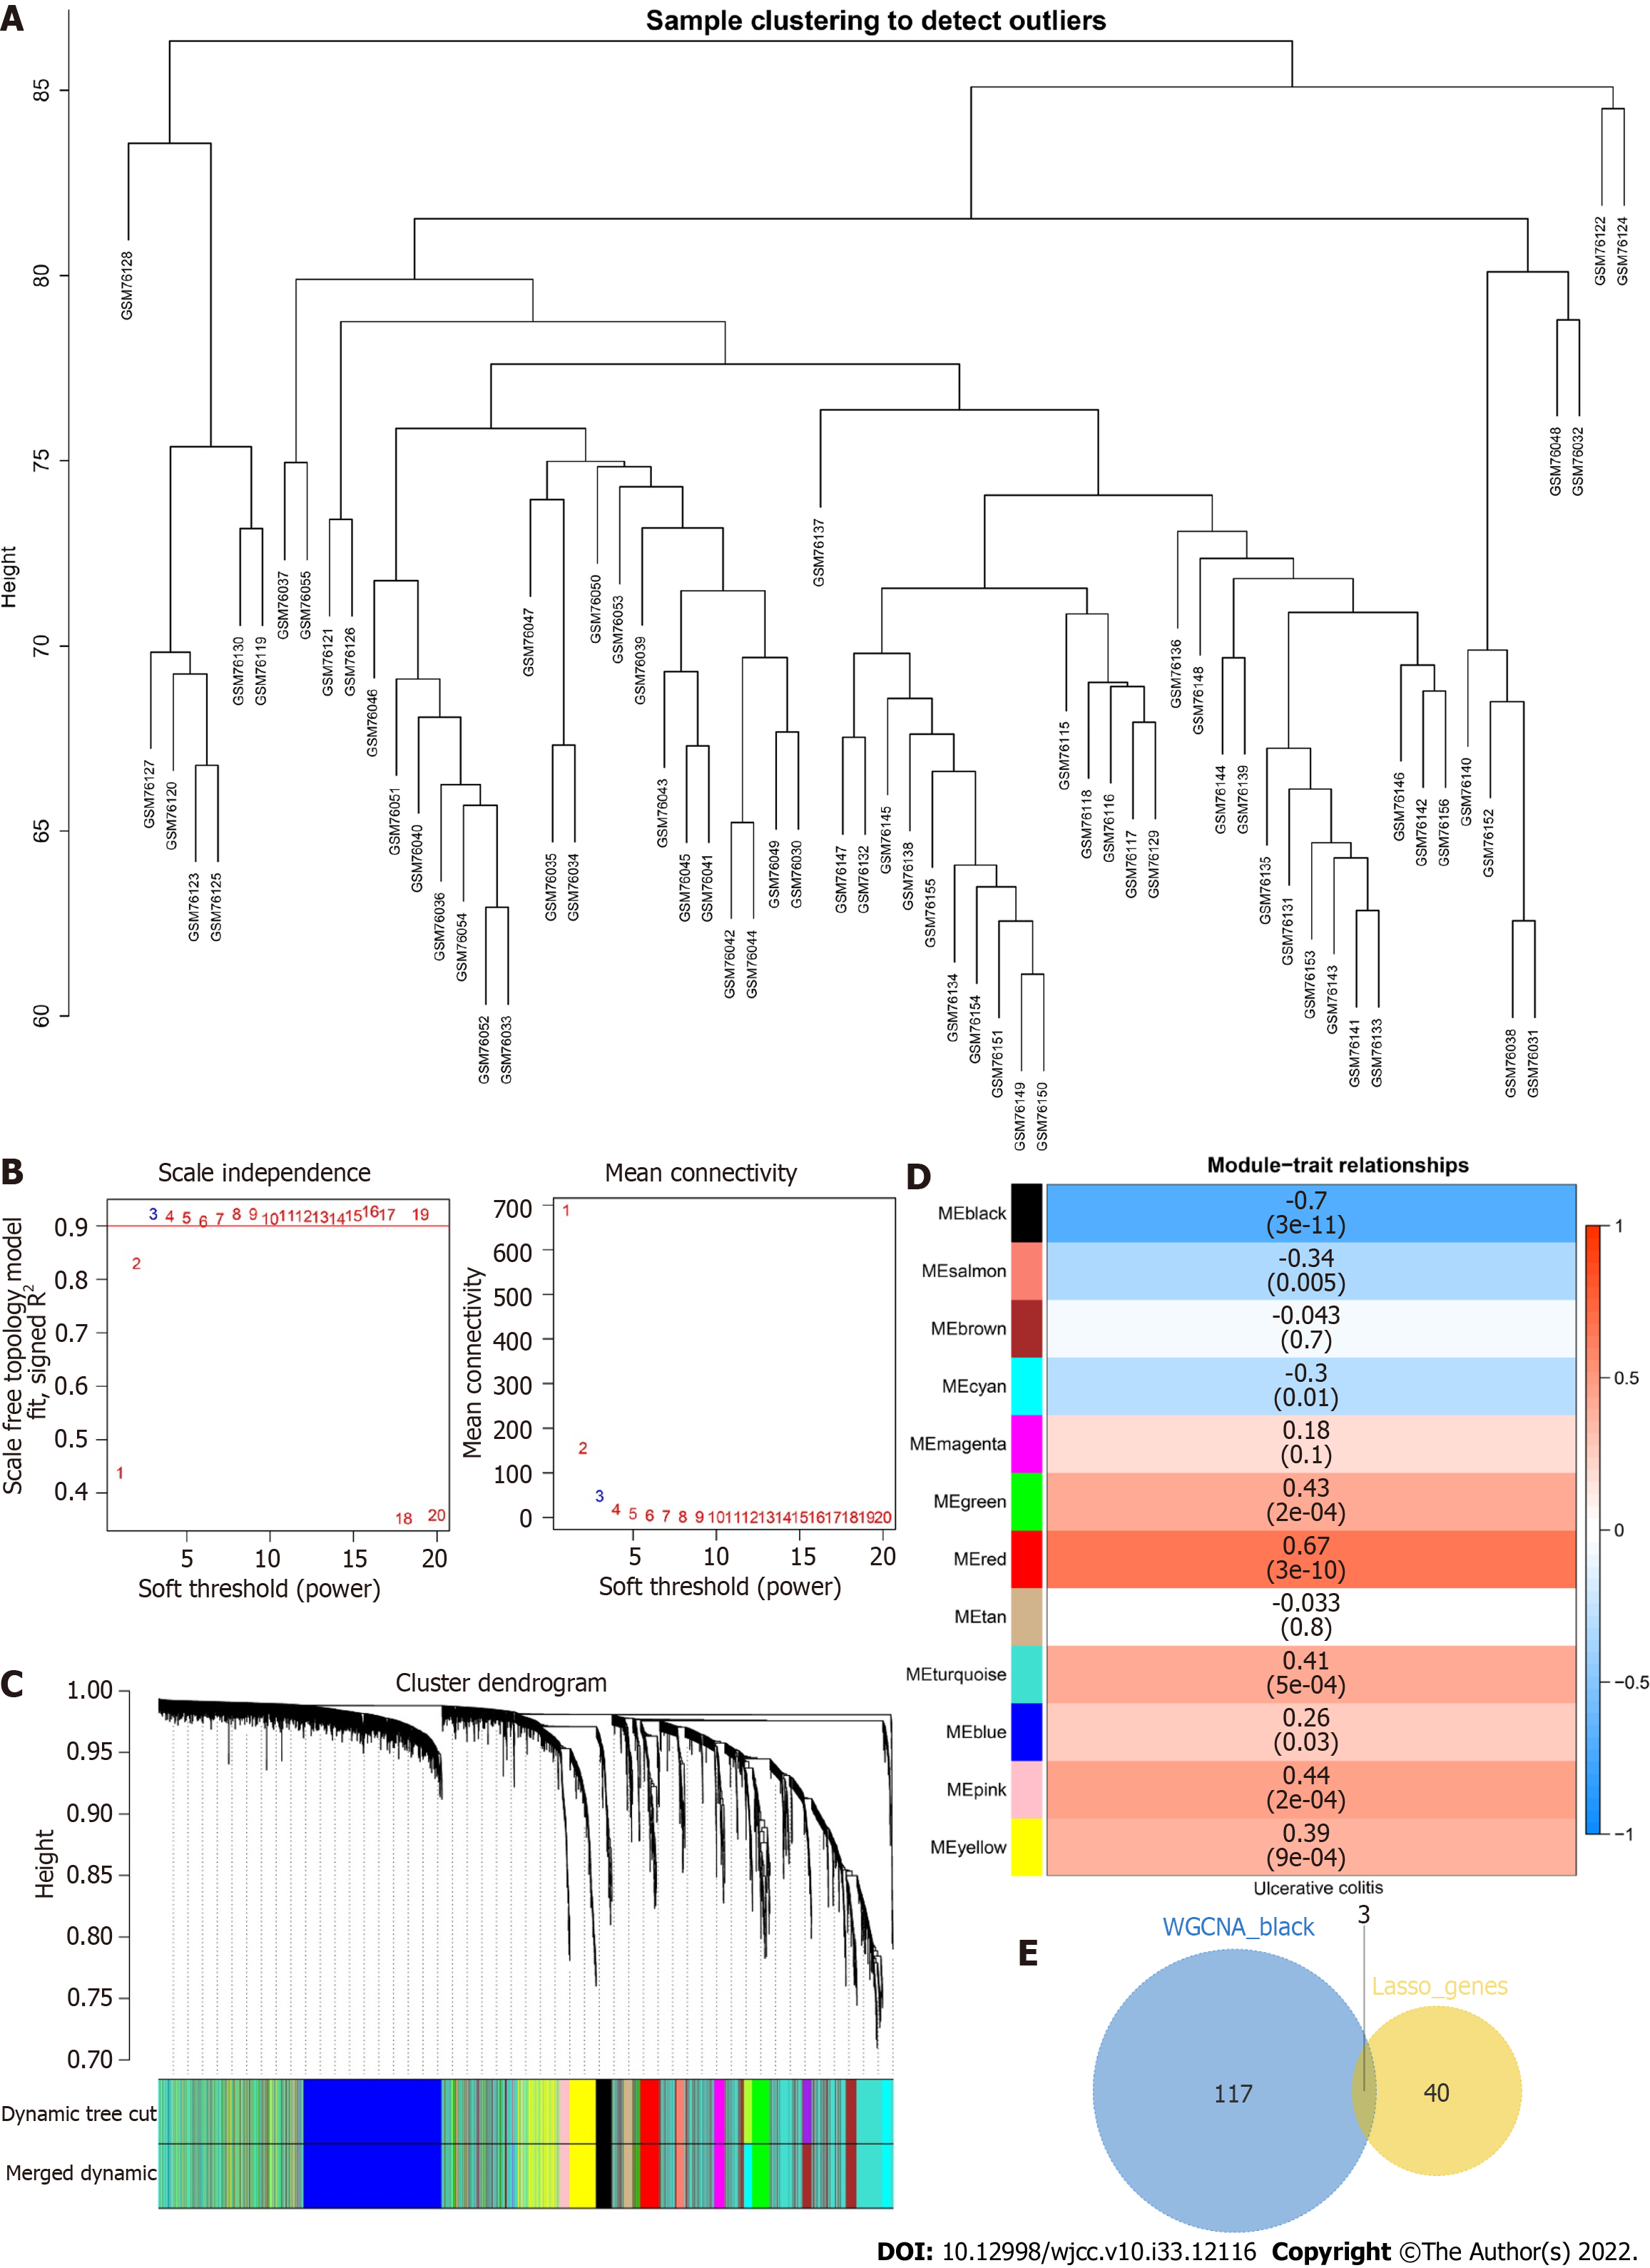
Figure 7 Construction of a weighted gene correlation network analysis network for ulcerative colitis.
A: Cluster dendrogram of the samples; B: Scale-free index and average connectivity of each soft threshold; C: Dendrogram of gene cluster. The different colors represent different modules; D: Heatmap of the correlations between module feature genes and ulcerative colitis. Blue indicates a negative correlation, and red indicates a positive correlation; E: Venn diagram of the weighted gene correlation network analysis black module with 43 least absolute shrinkage and selection operator genes.
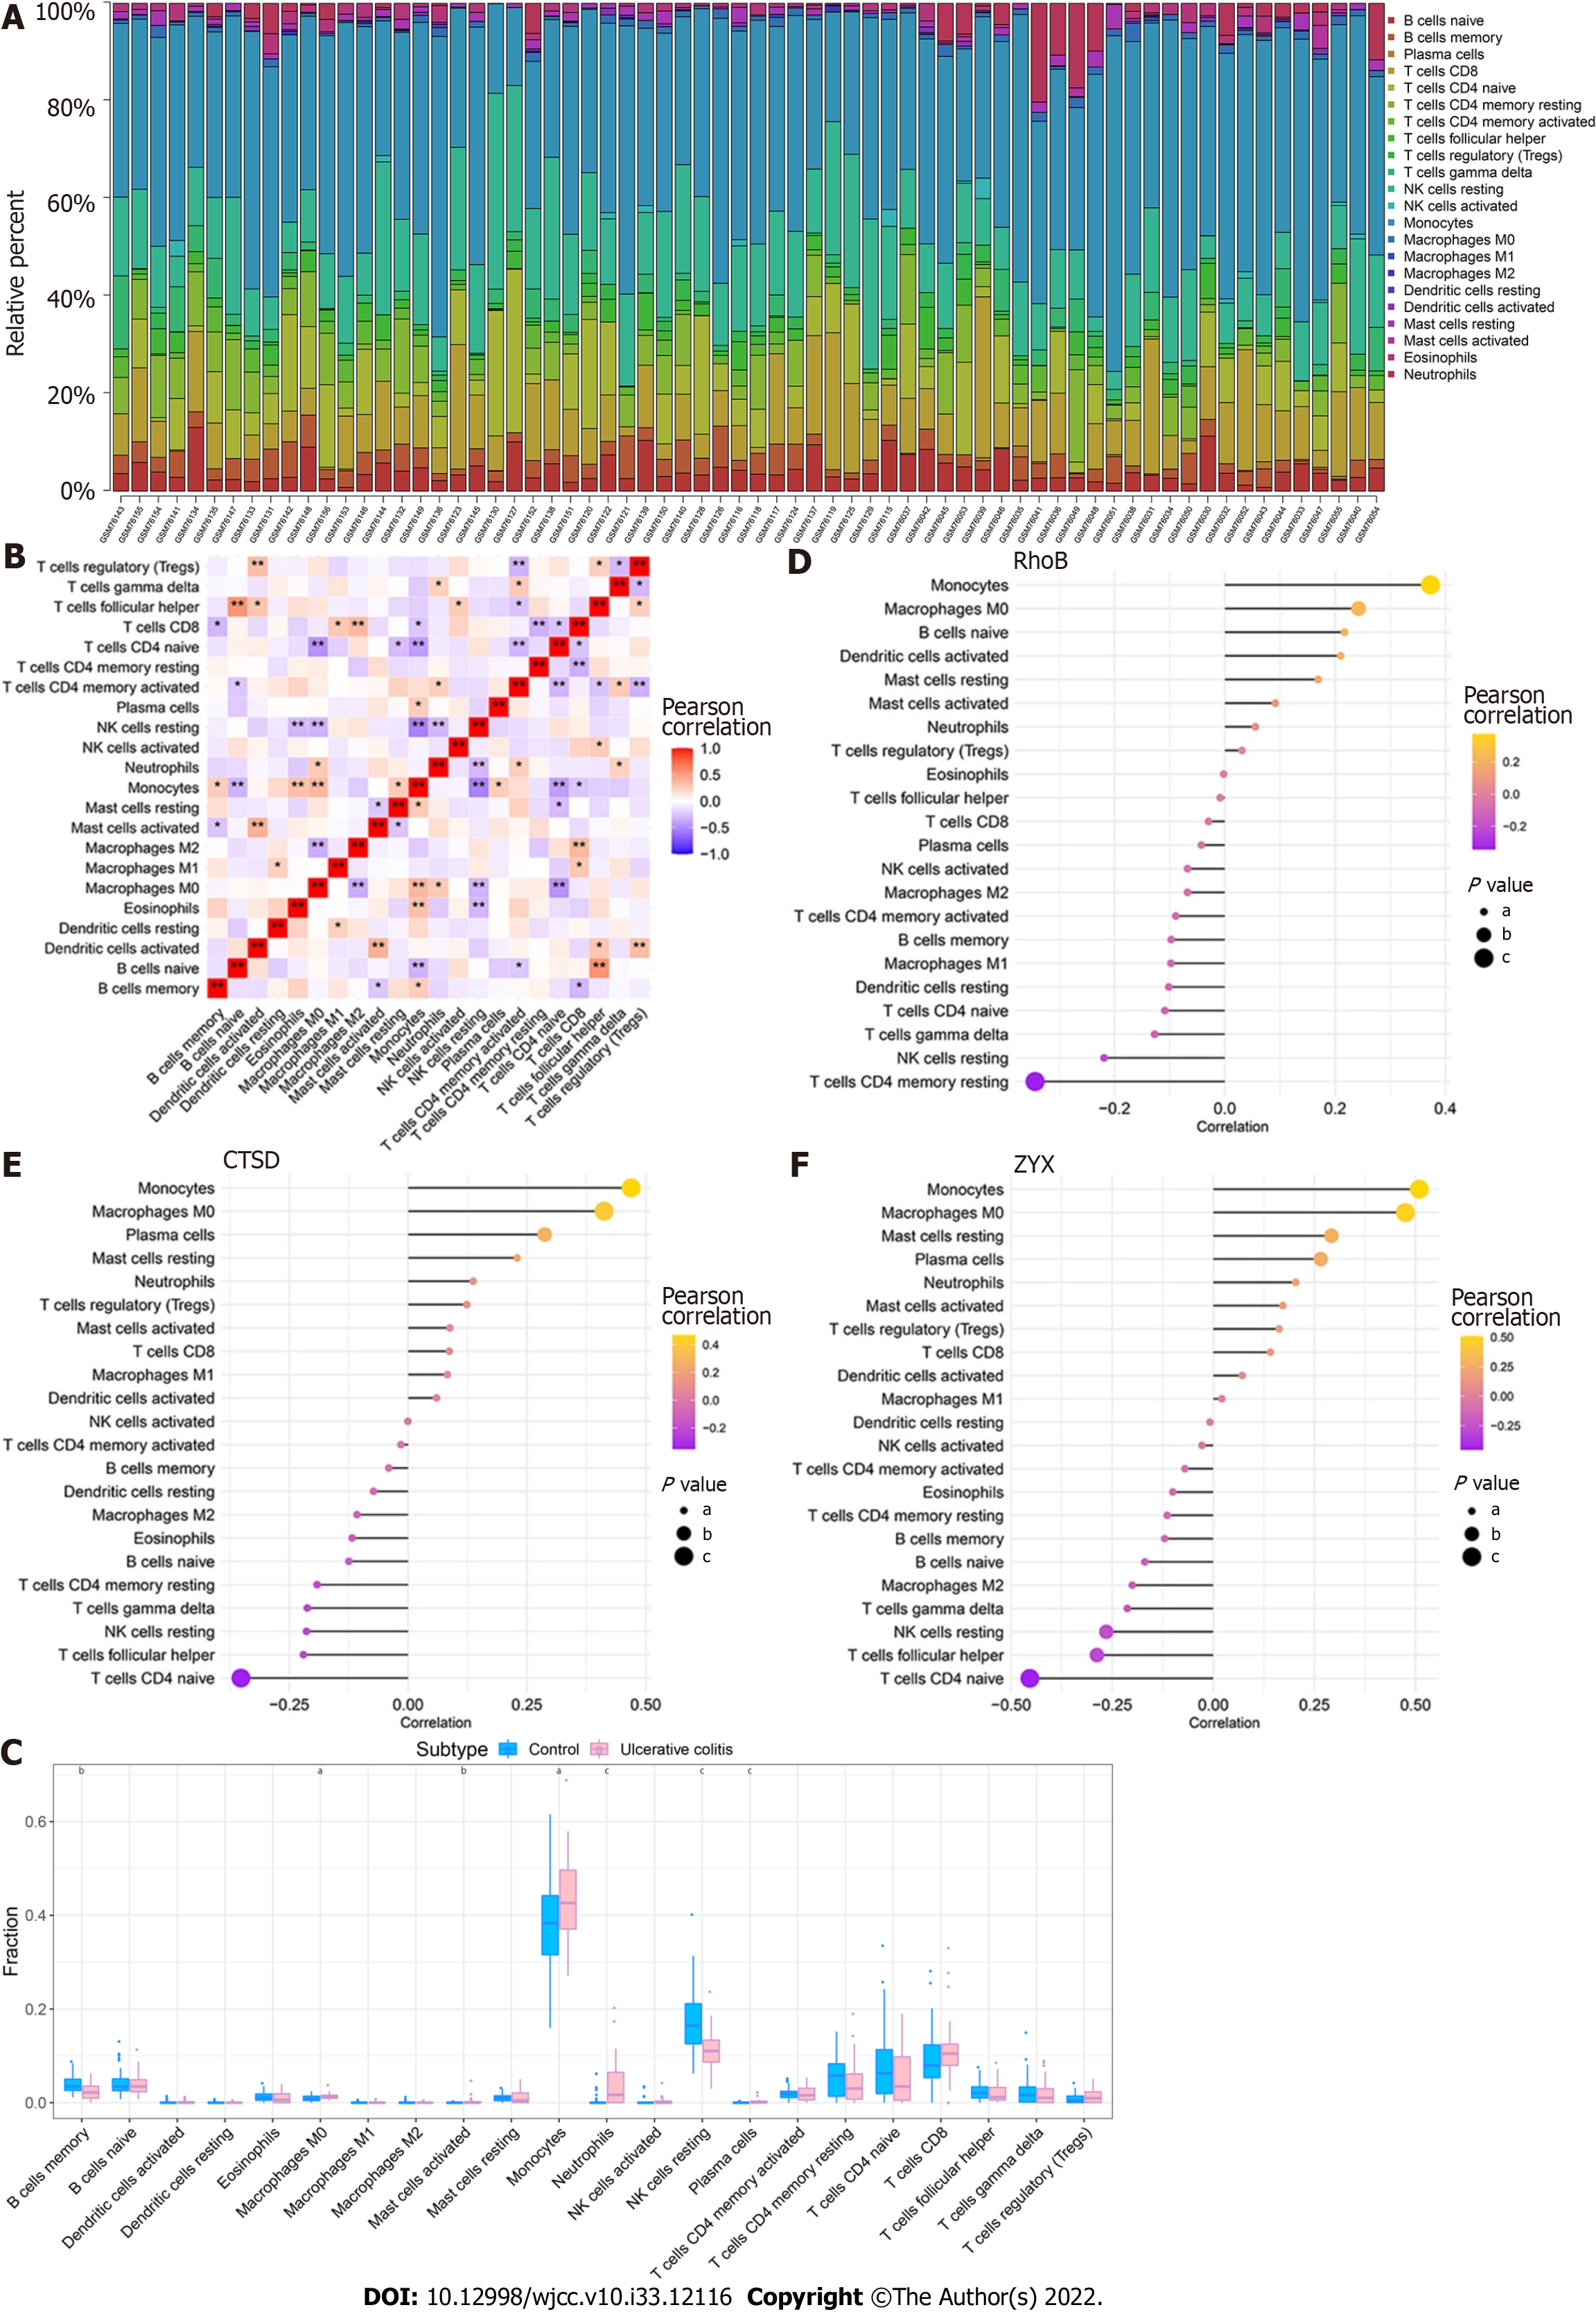
Figure 8 Immune infiltration in patients with ulcerative colitis.
A: Relative percentages of 22 immune cell subsets in ulcerative colitis (UC) samples; B: Pearson correlation among the 22 immune cell types. Blue indicates a positive correlation, and red indicates a positive correlation; C: Differences in the immune cell content between controls and patients with UC. Blue indicates controls, and pink indicates patients with UC. aP < 0.05, bP < 0.01, cP < 0.001; D-F: Pearson correlation analysis of the three core genes with immune cells. Orange indicates a positive correlation, and purple indicates a negative correlation.
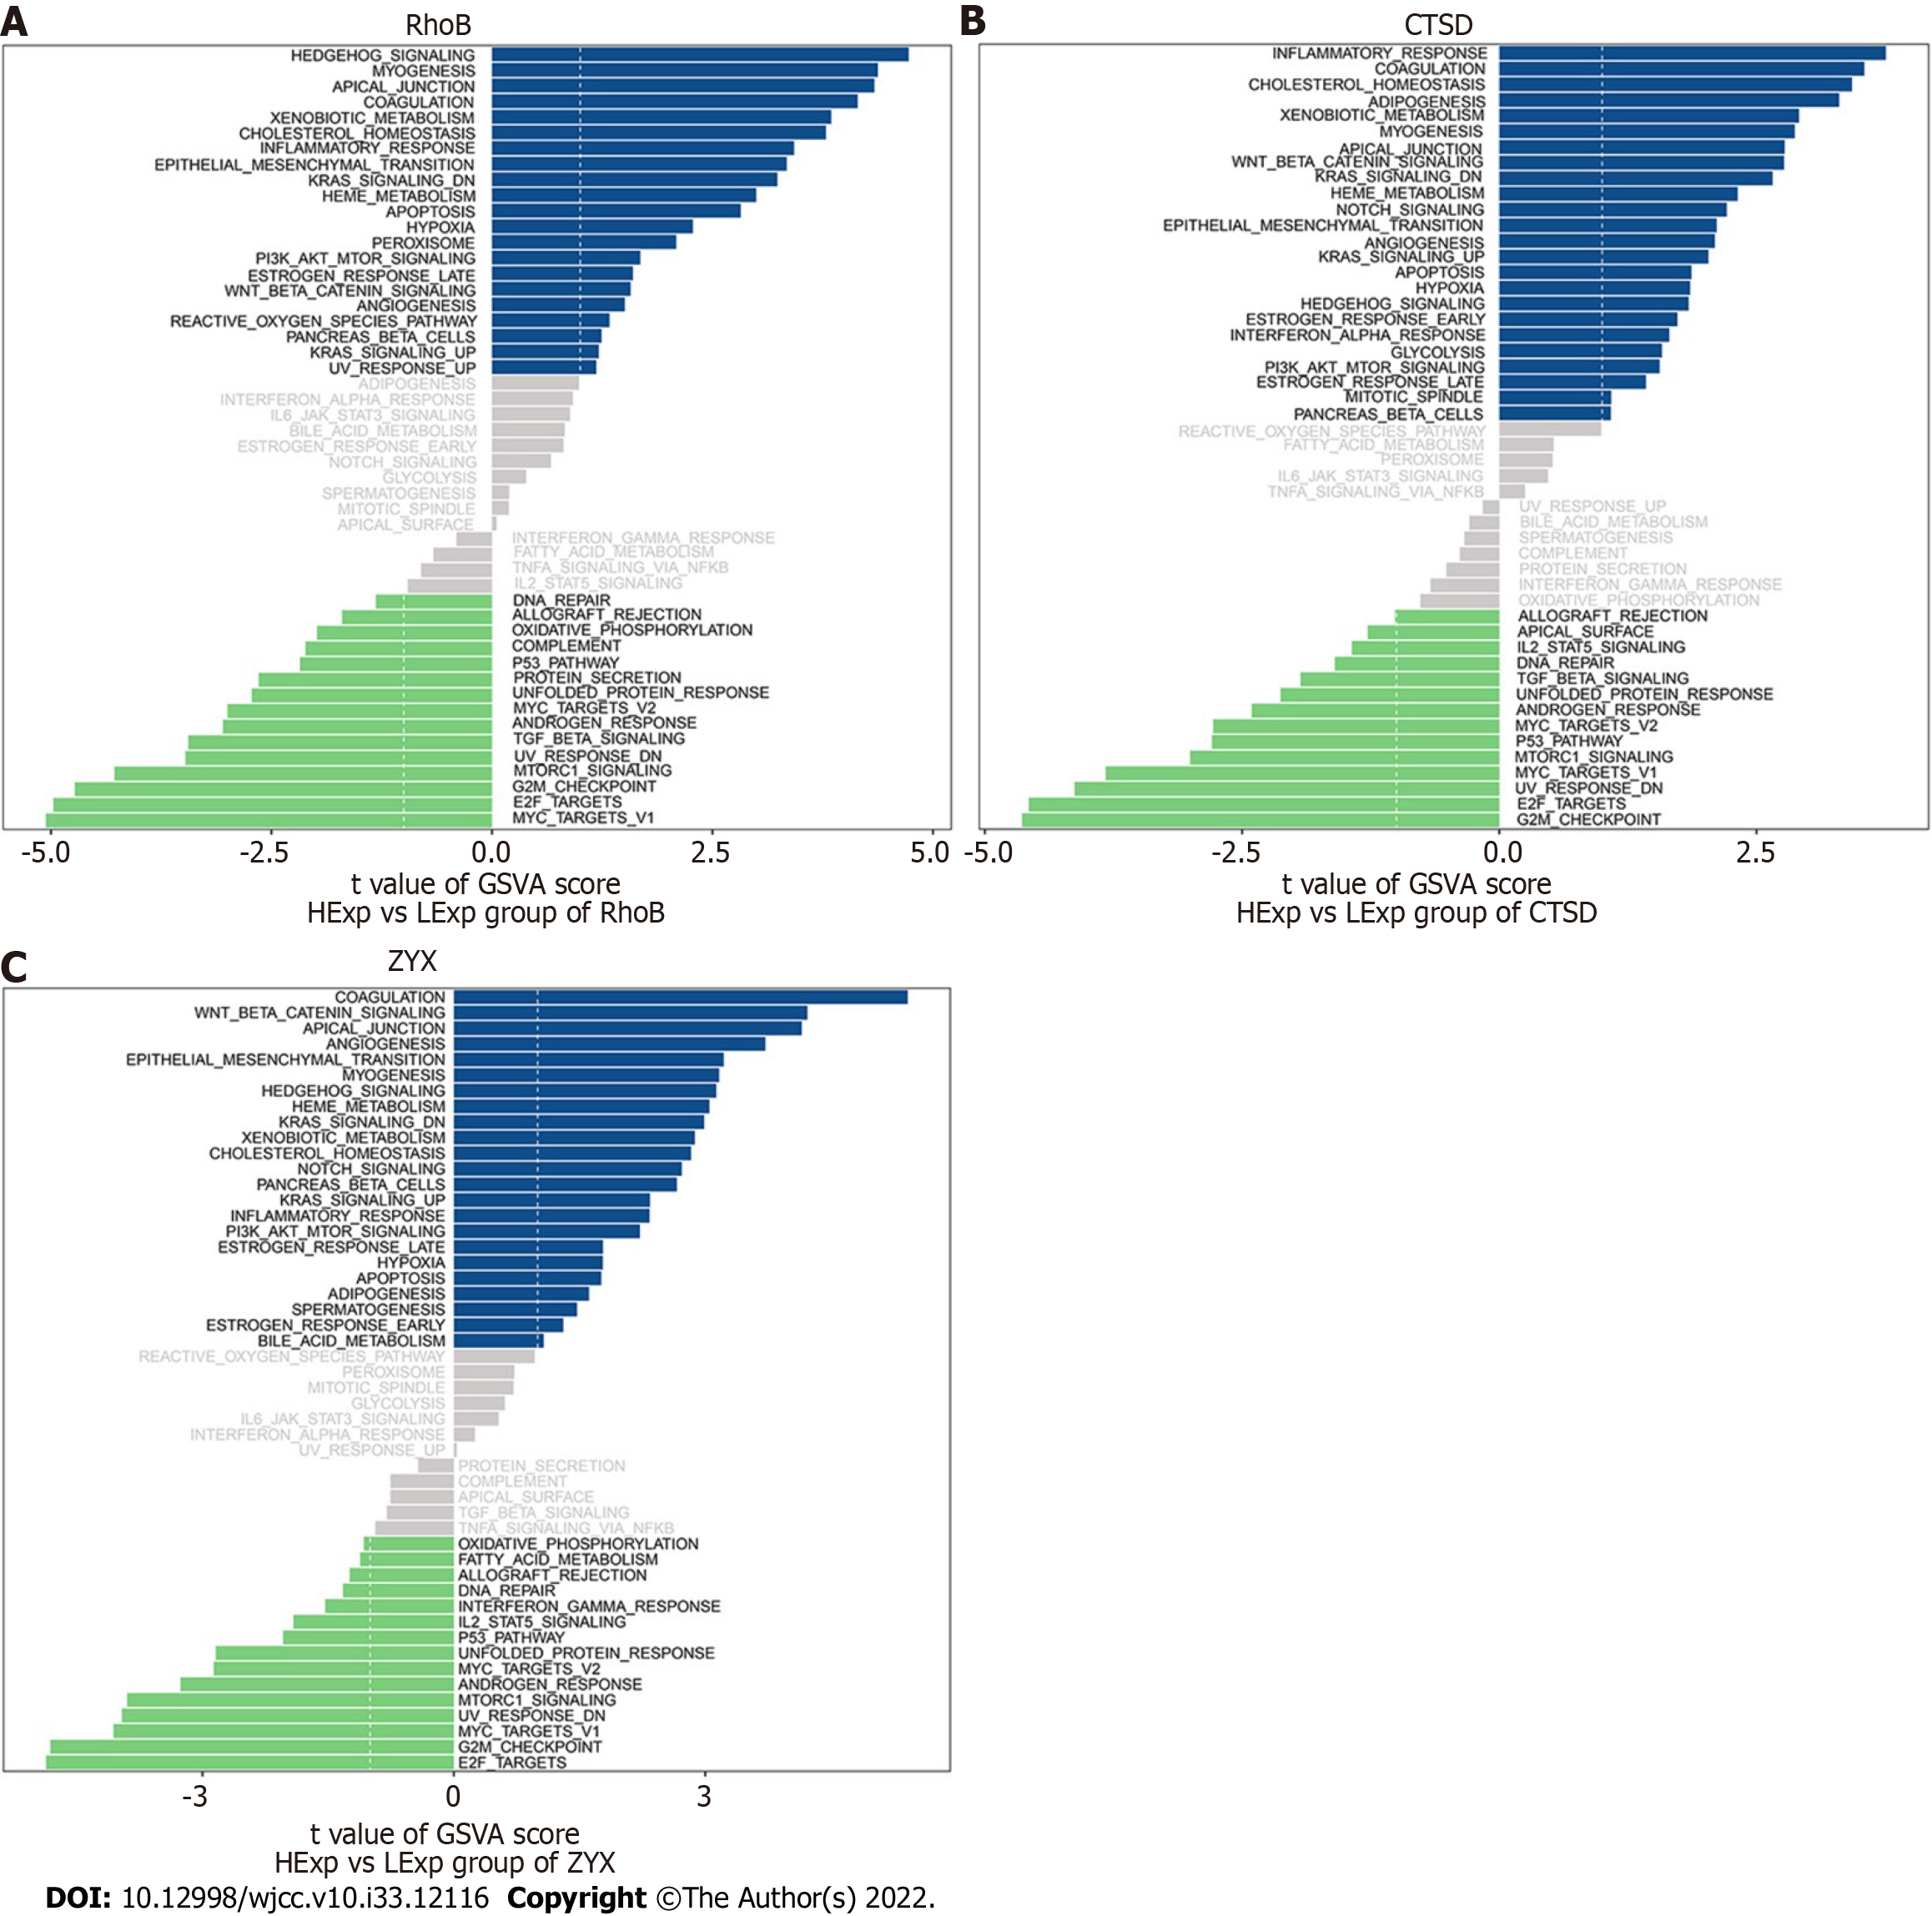
Figure 9 Gene set variation analysis of the core genes.
A-C: Gene set variation analysis of the three core genes. Blue indicates high expression, green indicates low expression, and the background gene set was the hallmark gene set.
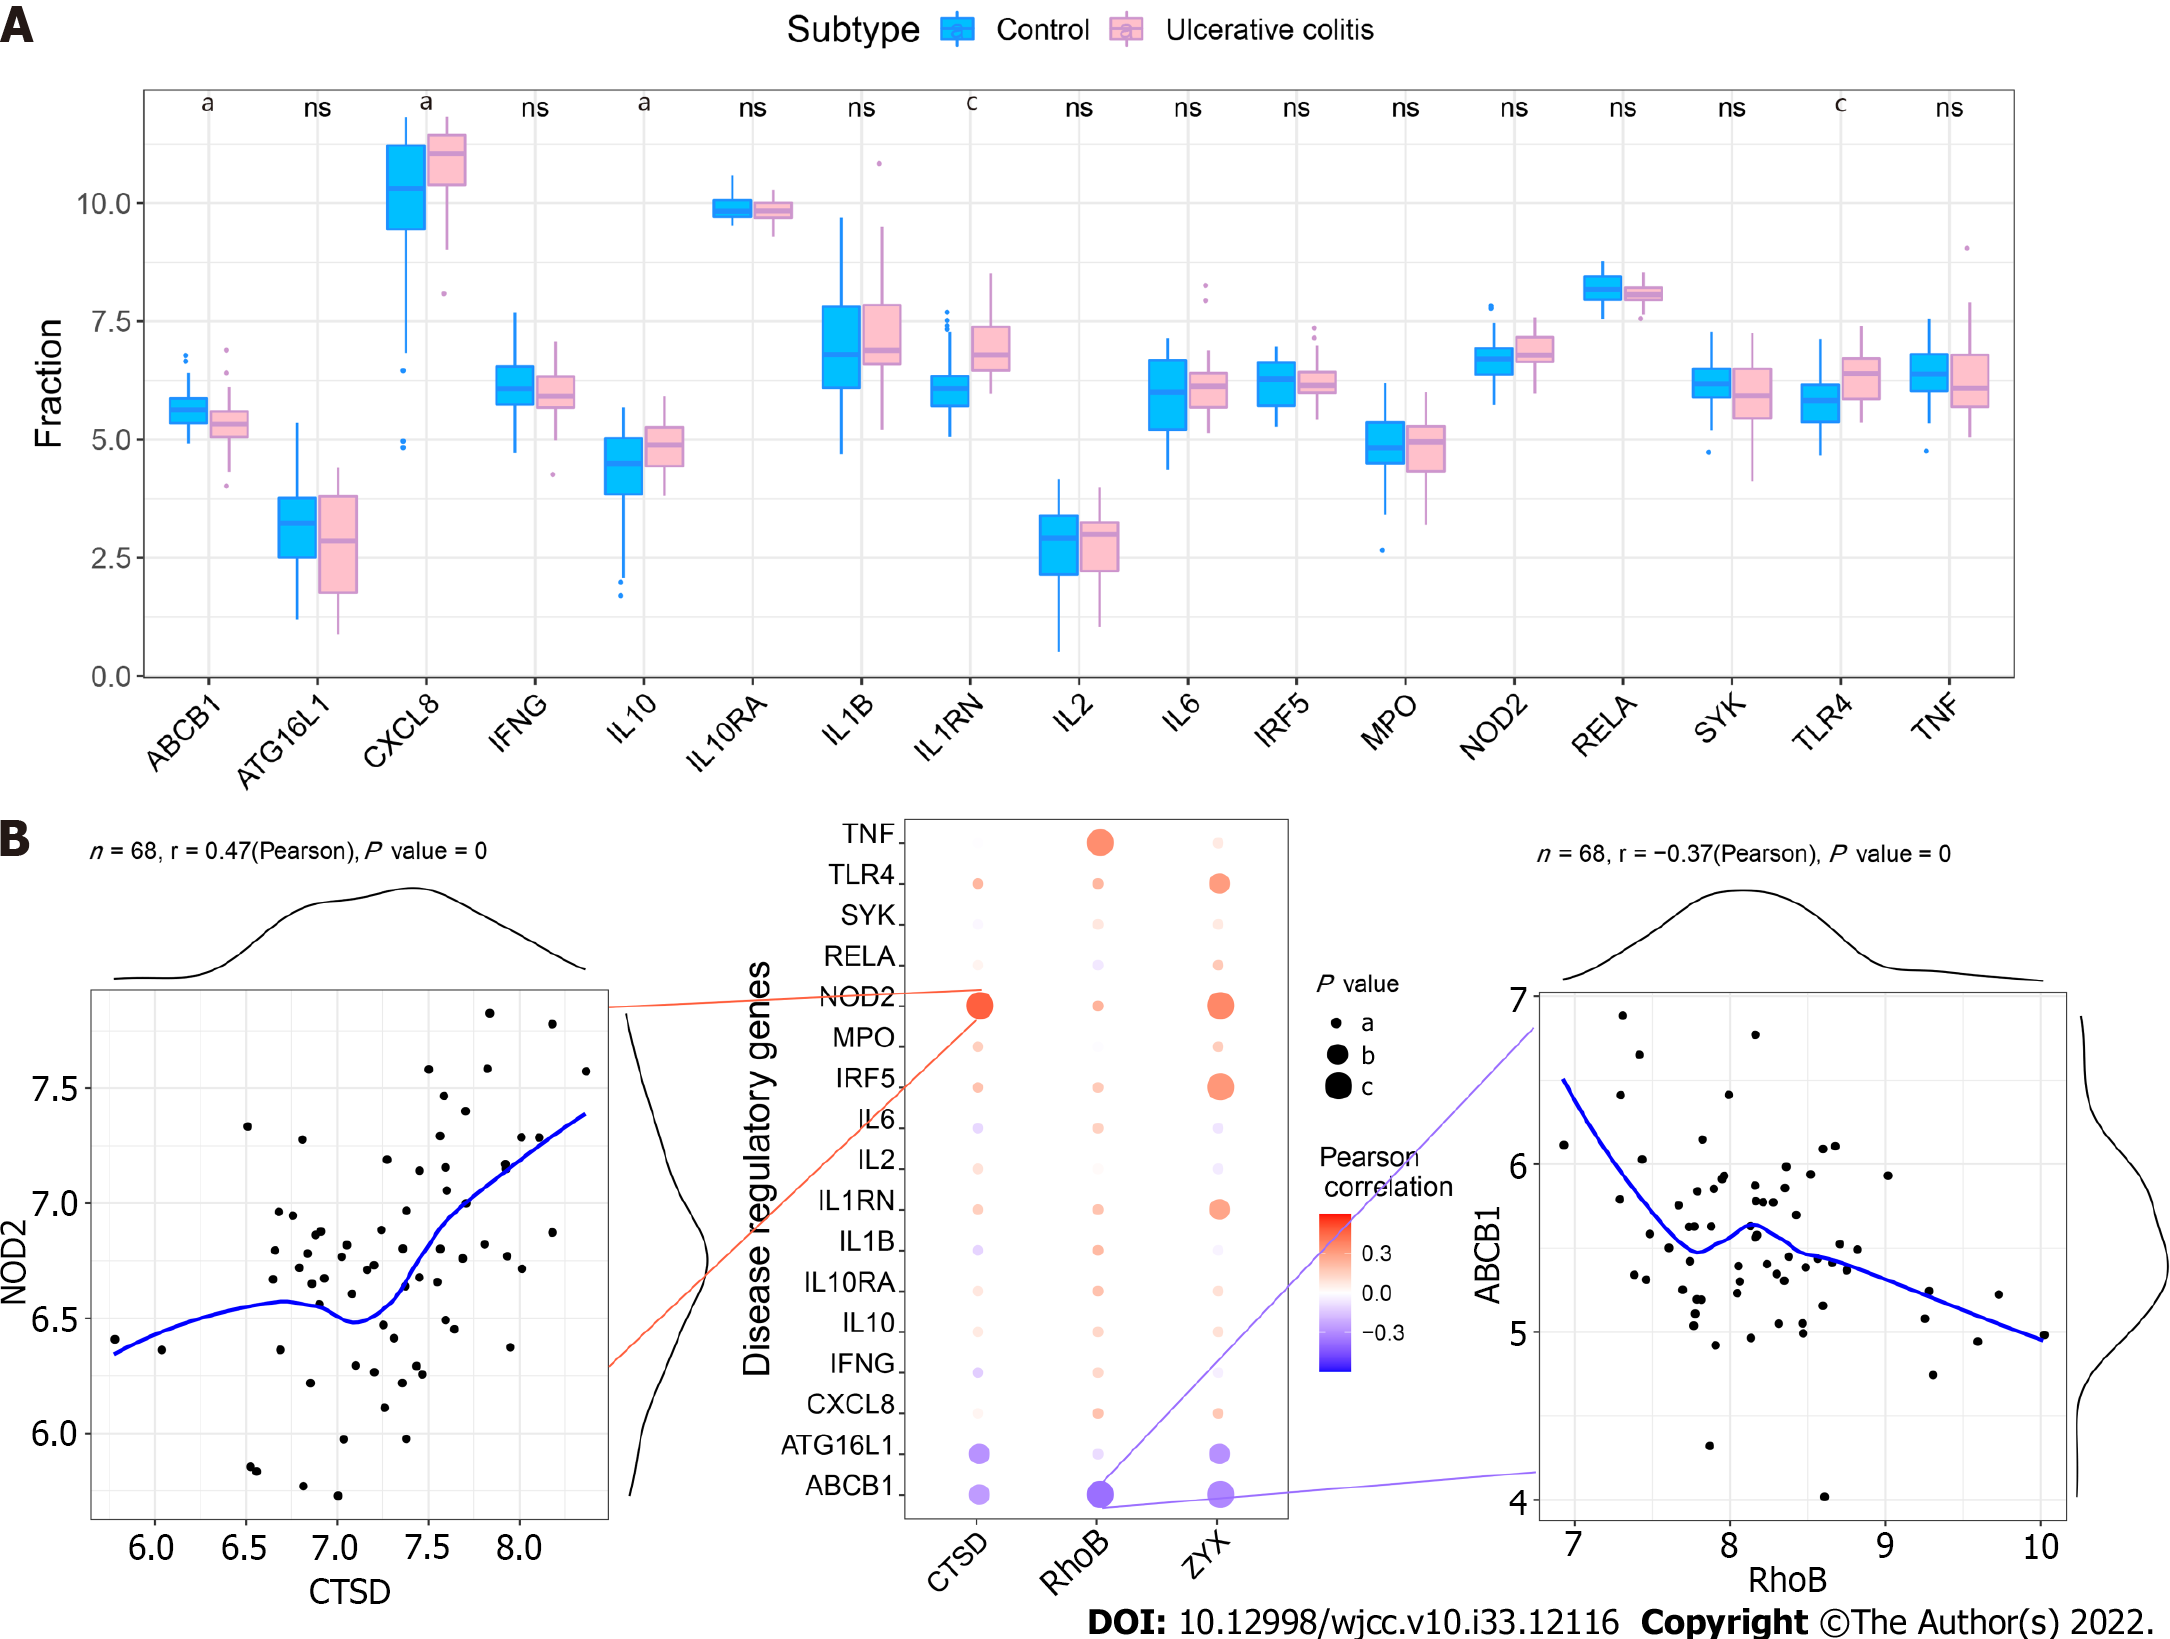
Figure 10 Correlation between regulatory genes and core genes in ulcerative colitis.
A: Differential expression of regulatory genes in ulcerative colitis (UC). aP < 0.05, bP < 0.01, cP < 0.001; B: Pearson correlation analysis of core genes and UC regulatory genes. Blue indicates a negative correlation, and red indicates a positive correlation.
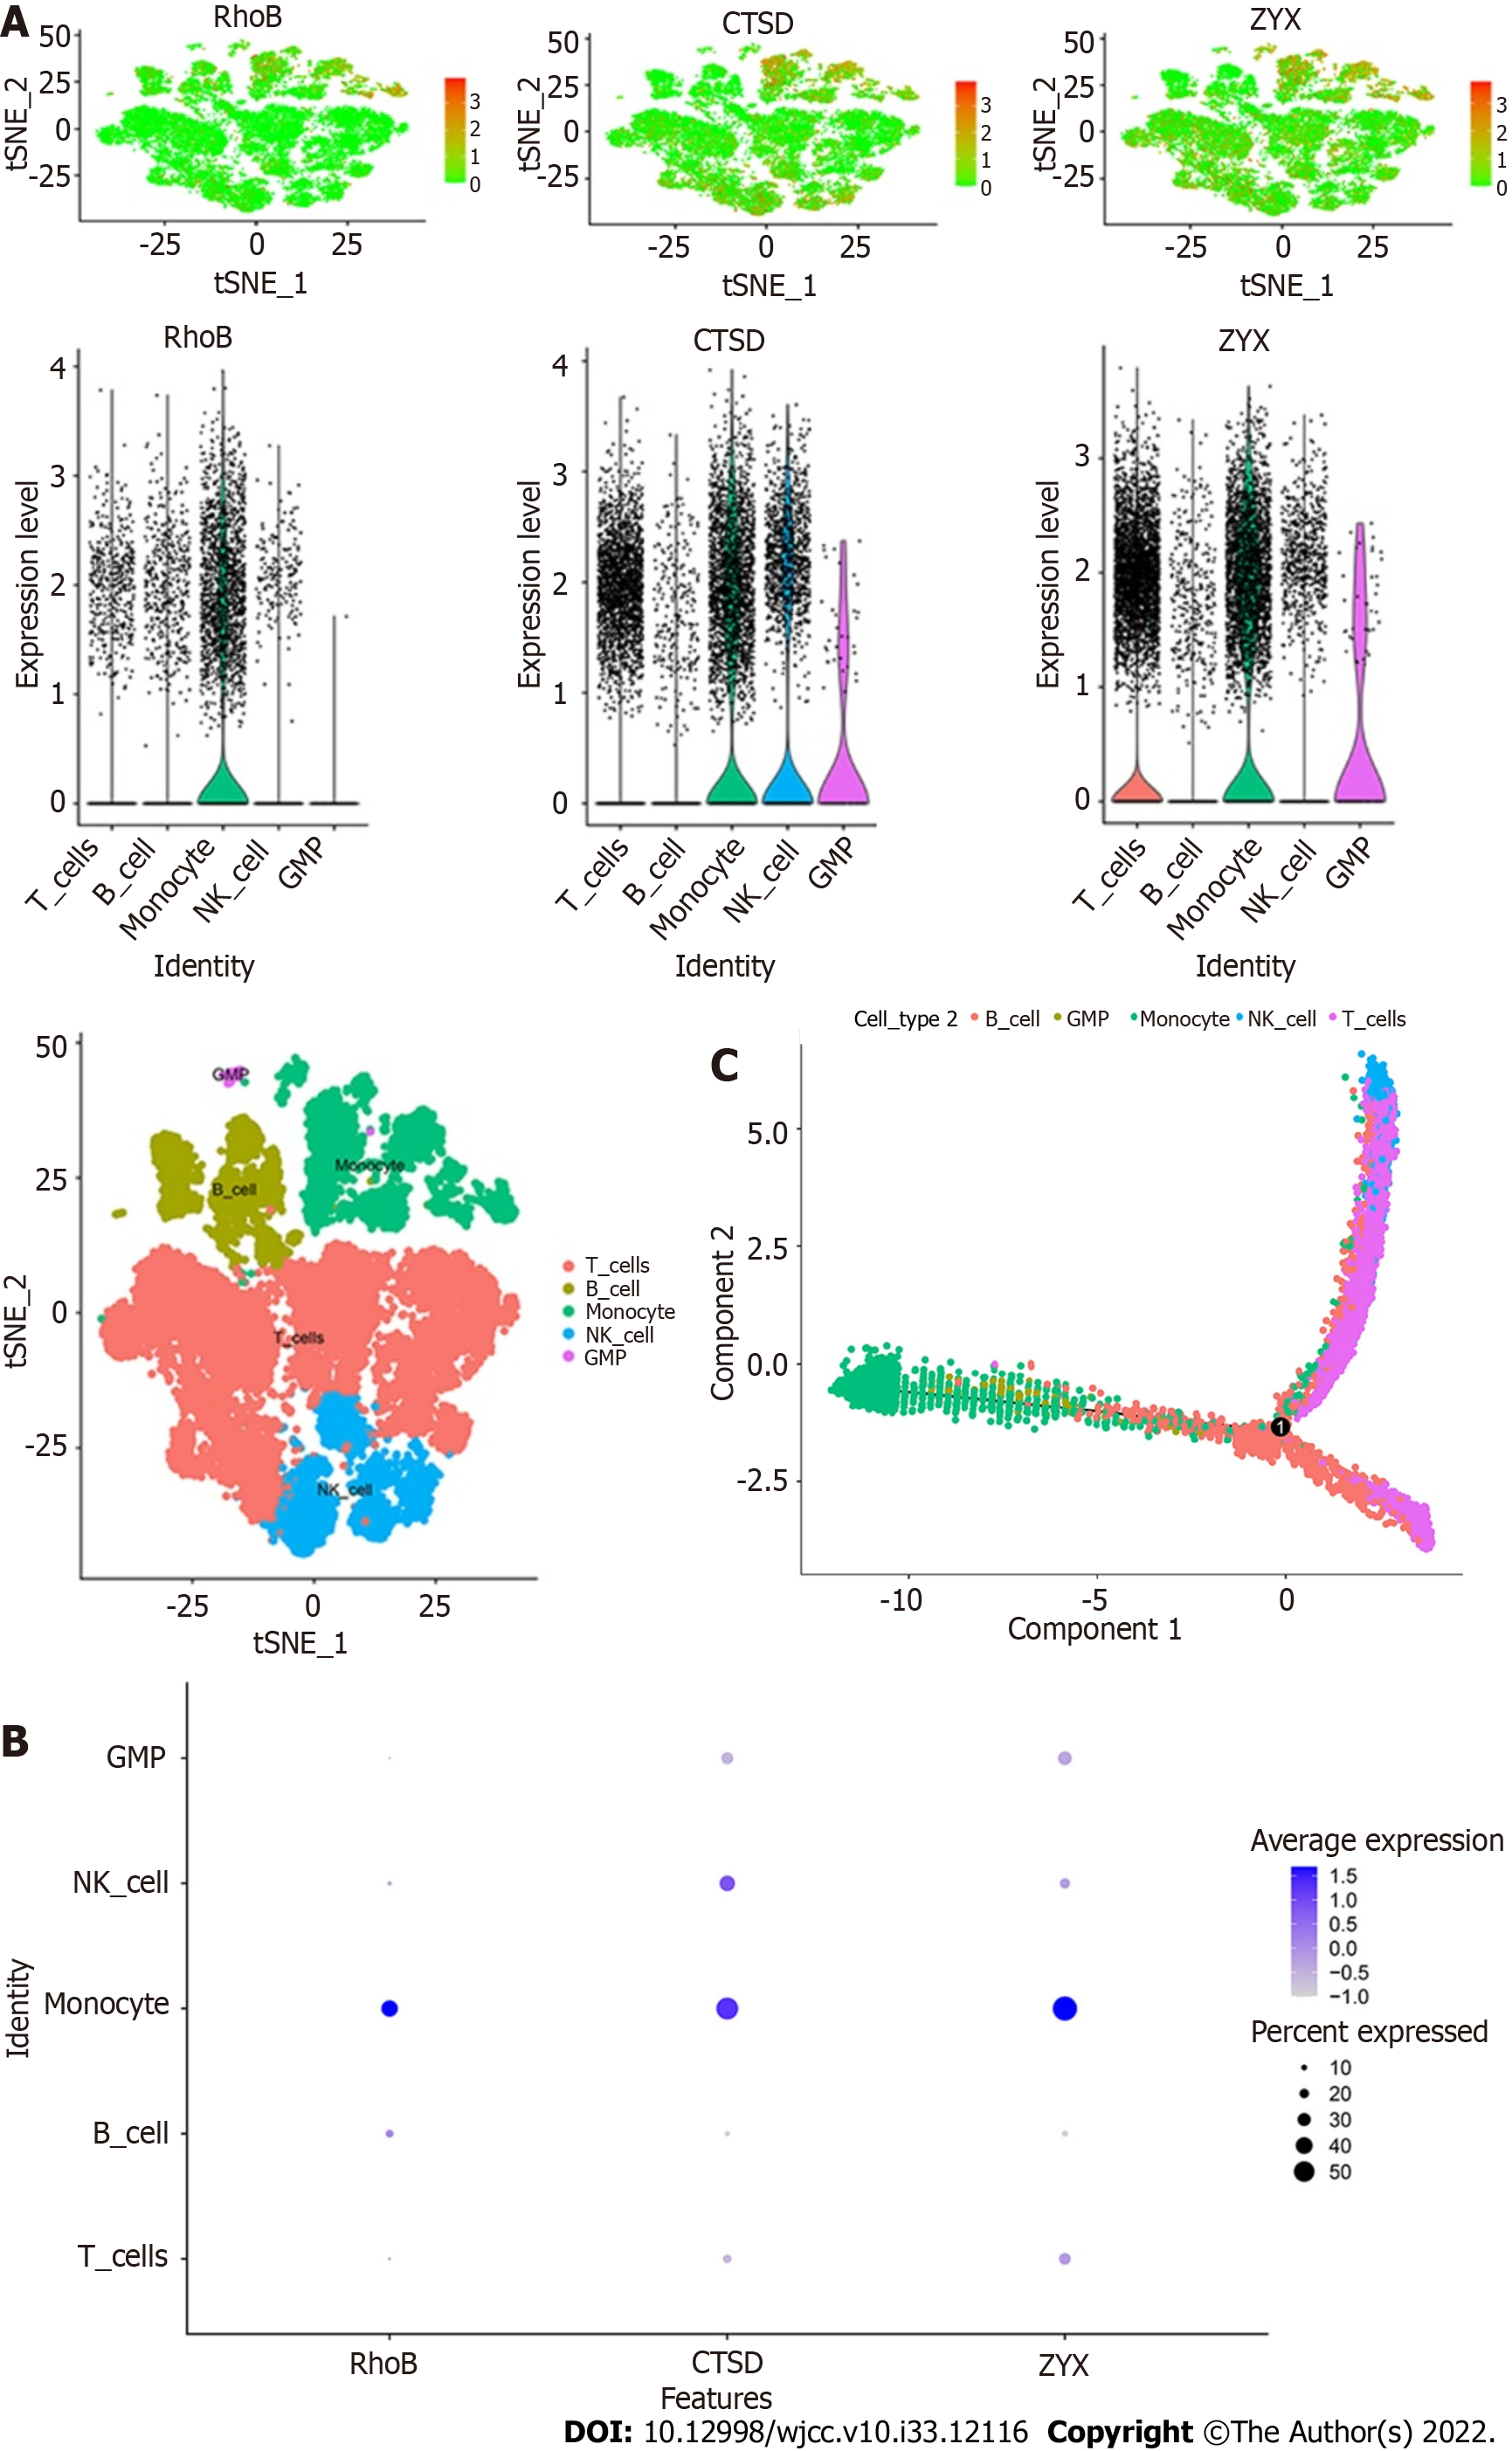
Figure 11 Expression patterns of key genes in single cells.
A: Expression of the core genes in five cell subtypes. The three core genes were highly expressed in monocytes; B: Bubble diagram of the expression of the three core genes in the five cell subtypes; C: Cell trajectory analysis revealed the maturation of peripheral blood mononuclear cells in ulcerative colitis according to cell subtype staining.
- Citation: Dai YC, Qiao D, Fang CY, Chen QQ, Que RY, Xiao TG, Zheng L, Wang LJ, Zhang YL. Single-cell RNA-sequencing combined with bulk RNA-sequencing analysis of peripheral blood reveals the characteristics and key immune cell genes of ulcerative colitis . World J Clin Cases 2022; 10(33): 12116-12135
- URL: https://www.wjgnet.com/2307-8960/full/v10/i33/12116.htm
- DOI: https://dx.doi.org/10.12998/wjcc.v10.i33.12116


