Copyright
©The Author(s) 2022.
World J Clin Cases. Nov 26, 2022; 10(33): 12116-12135
Published online Nov 26, 2022. doi: 10.12998/wjcc.v10.i33.12116
Published online Nov 26, 2022. doi: 10.12998/wjcc.v10.i33.12116
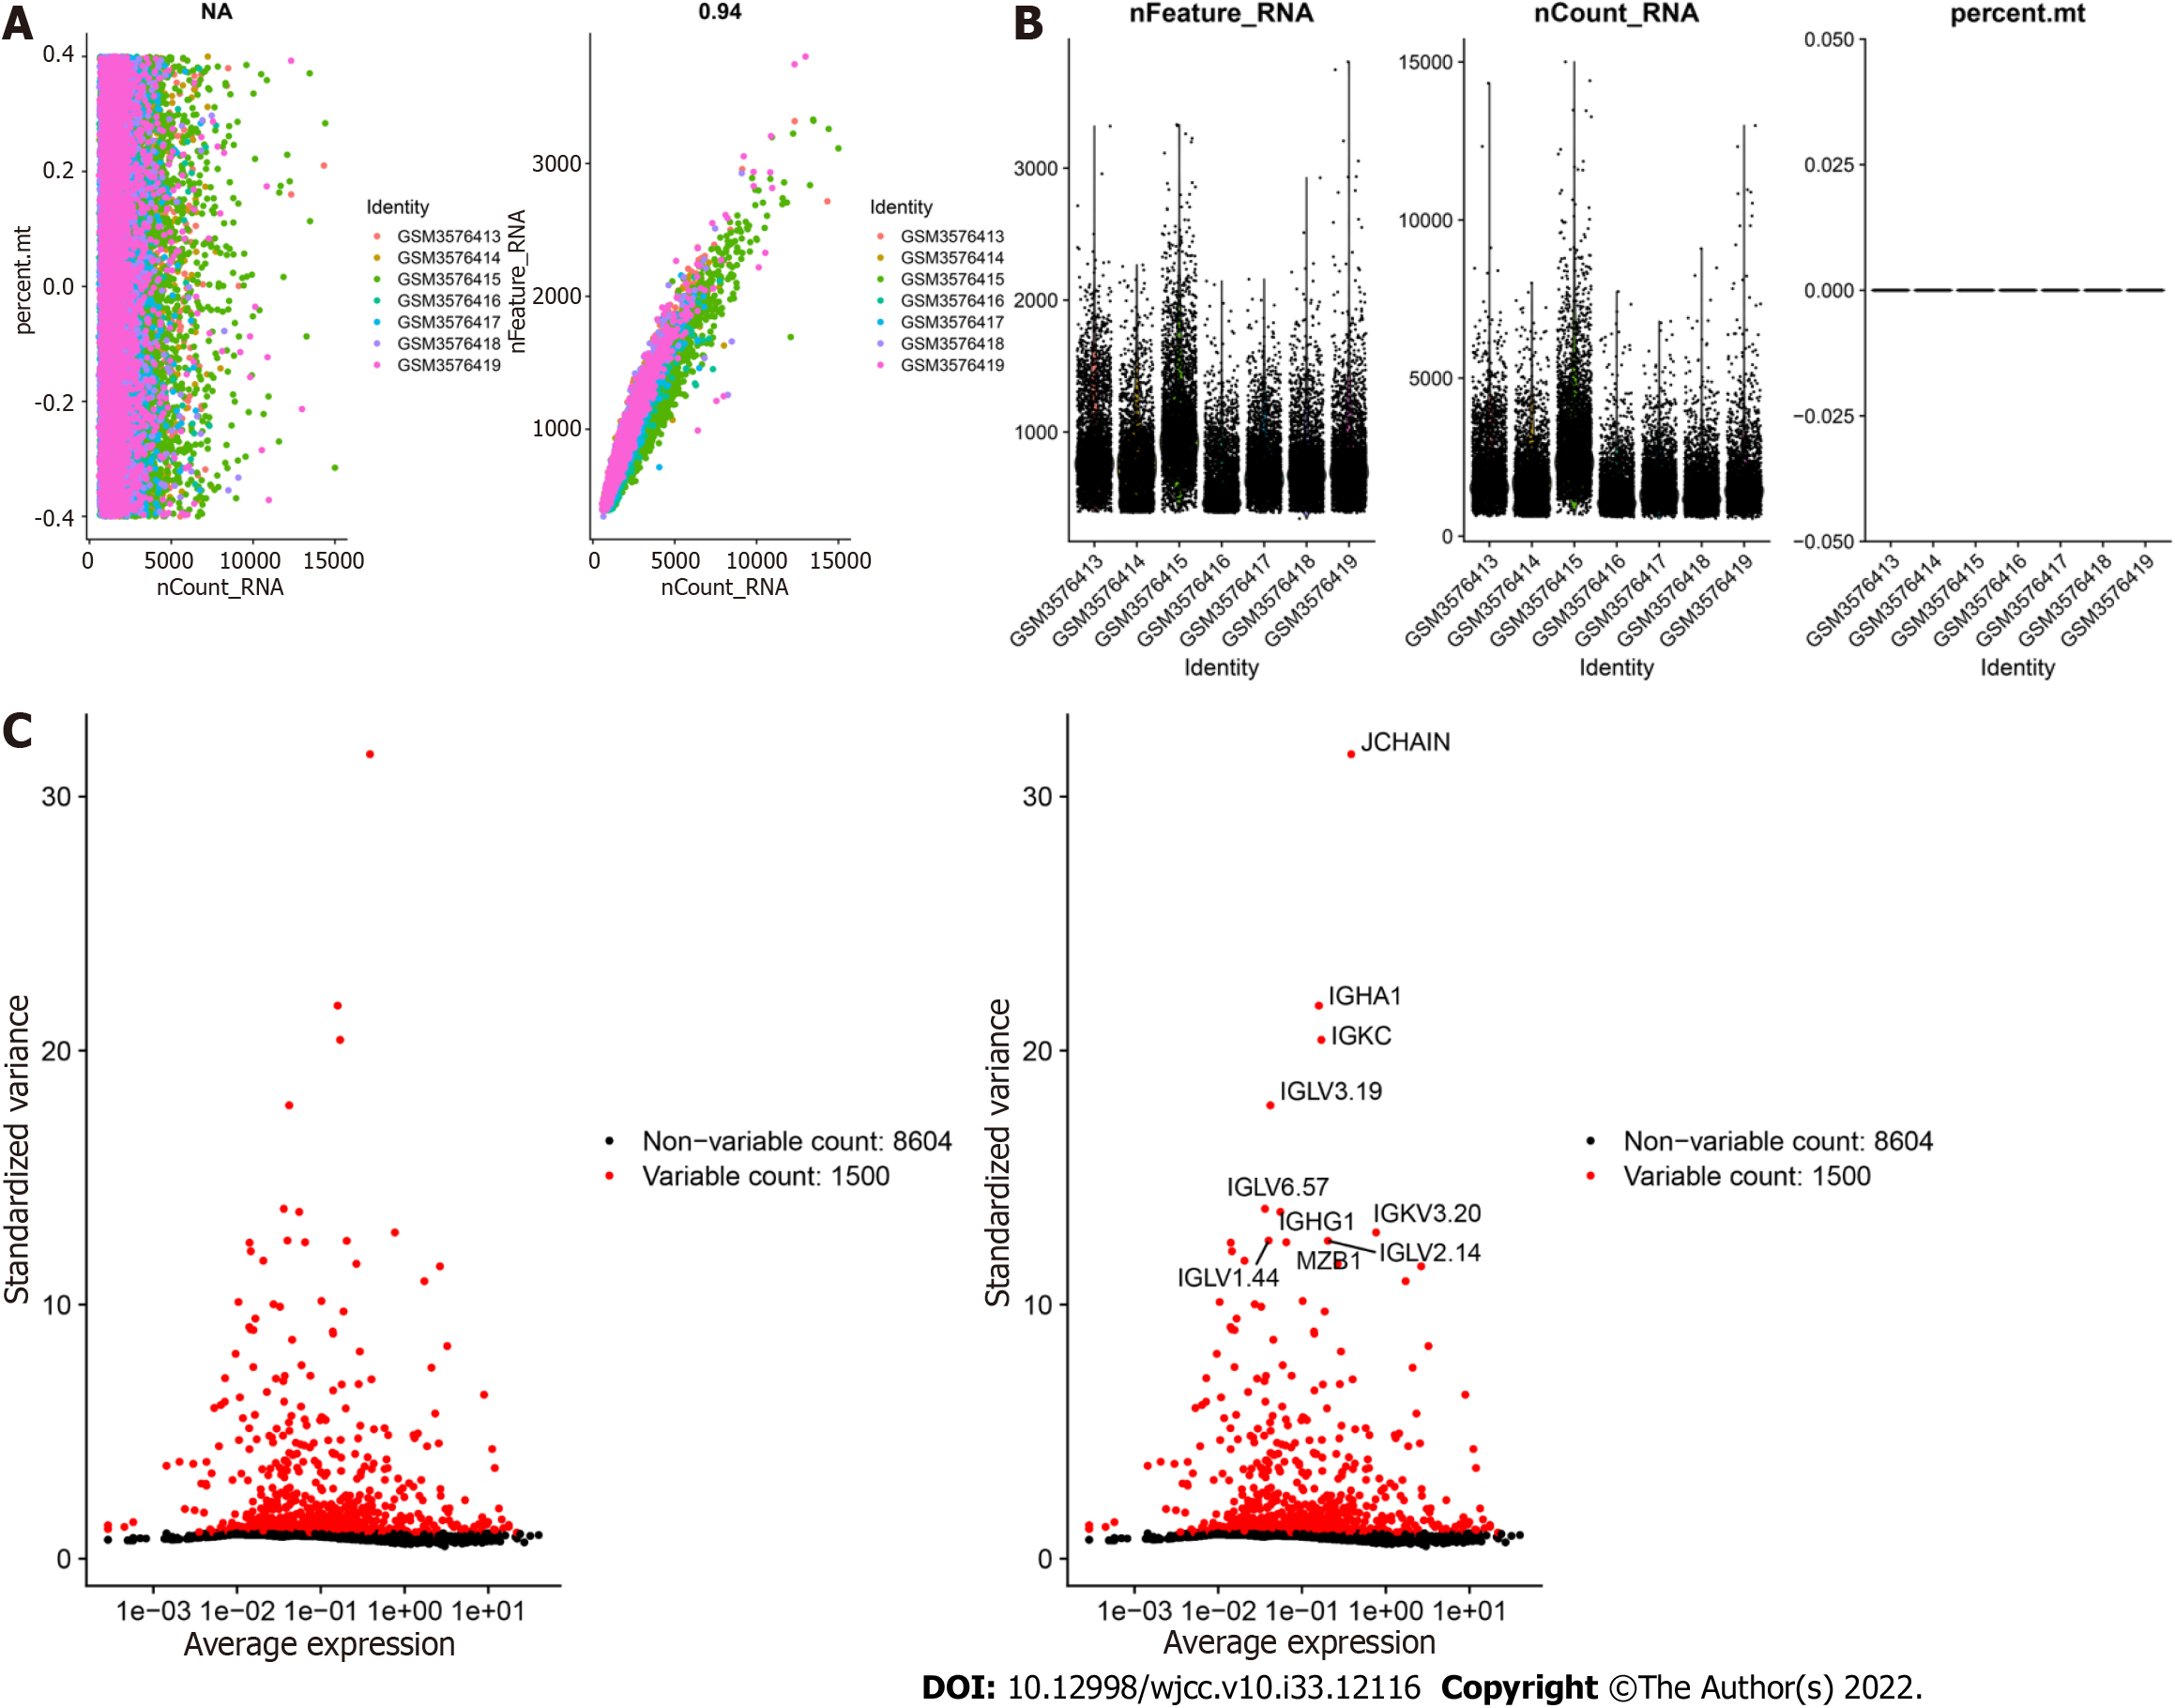
Figure 1 Characterization of single-cell RNA sequencing data from samples of peripheral blood mononuclear cells in ulcerative colitis.
A: The left graph shows the relationship between the cell sequencing depth and the mitochondrial content, and the right graph shows the relationship between the sequencing depth and the gene number, which were positively correlated. B: Quality control analysis of the PBMC samples determined the number of genes and the sequencing depth of each cell. C: Genes with significantly different expression between cells were identified, and a characteristic variance map was drawn.
- Citation: Dai YC, Qiao D, Fang CY, Chen QQ, Que RY, Xiao TG, Zheng L, Wang LJ, Zhang YL. Single-cell RNA-sequencing combined with bulk RNA-sequencing analysis of peripheral blood reveals the characteristics and key immune cell genes of ulcerative colitis . World J Clin Cases 2022; 10(33): 12116-12135
- URL: https://www.wjgnet.com/2307-8960/full/v10/i33/12116.htm
- DOI: https://dx.doi.org/10.12998/wjcc.v10.i33.12116


