Copyright
©The Author(s) 2022.
World J Clin Cases. Nov 26, 2022; 10(33): 12116-12135
Published online Nov 26, 2022. doi: 10.12998/wjcc.v10.i33.12116
Published online Nov 26, 2022. doi: 10.12998/wjcc.v10.i33.12116
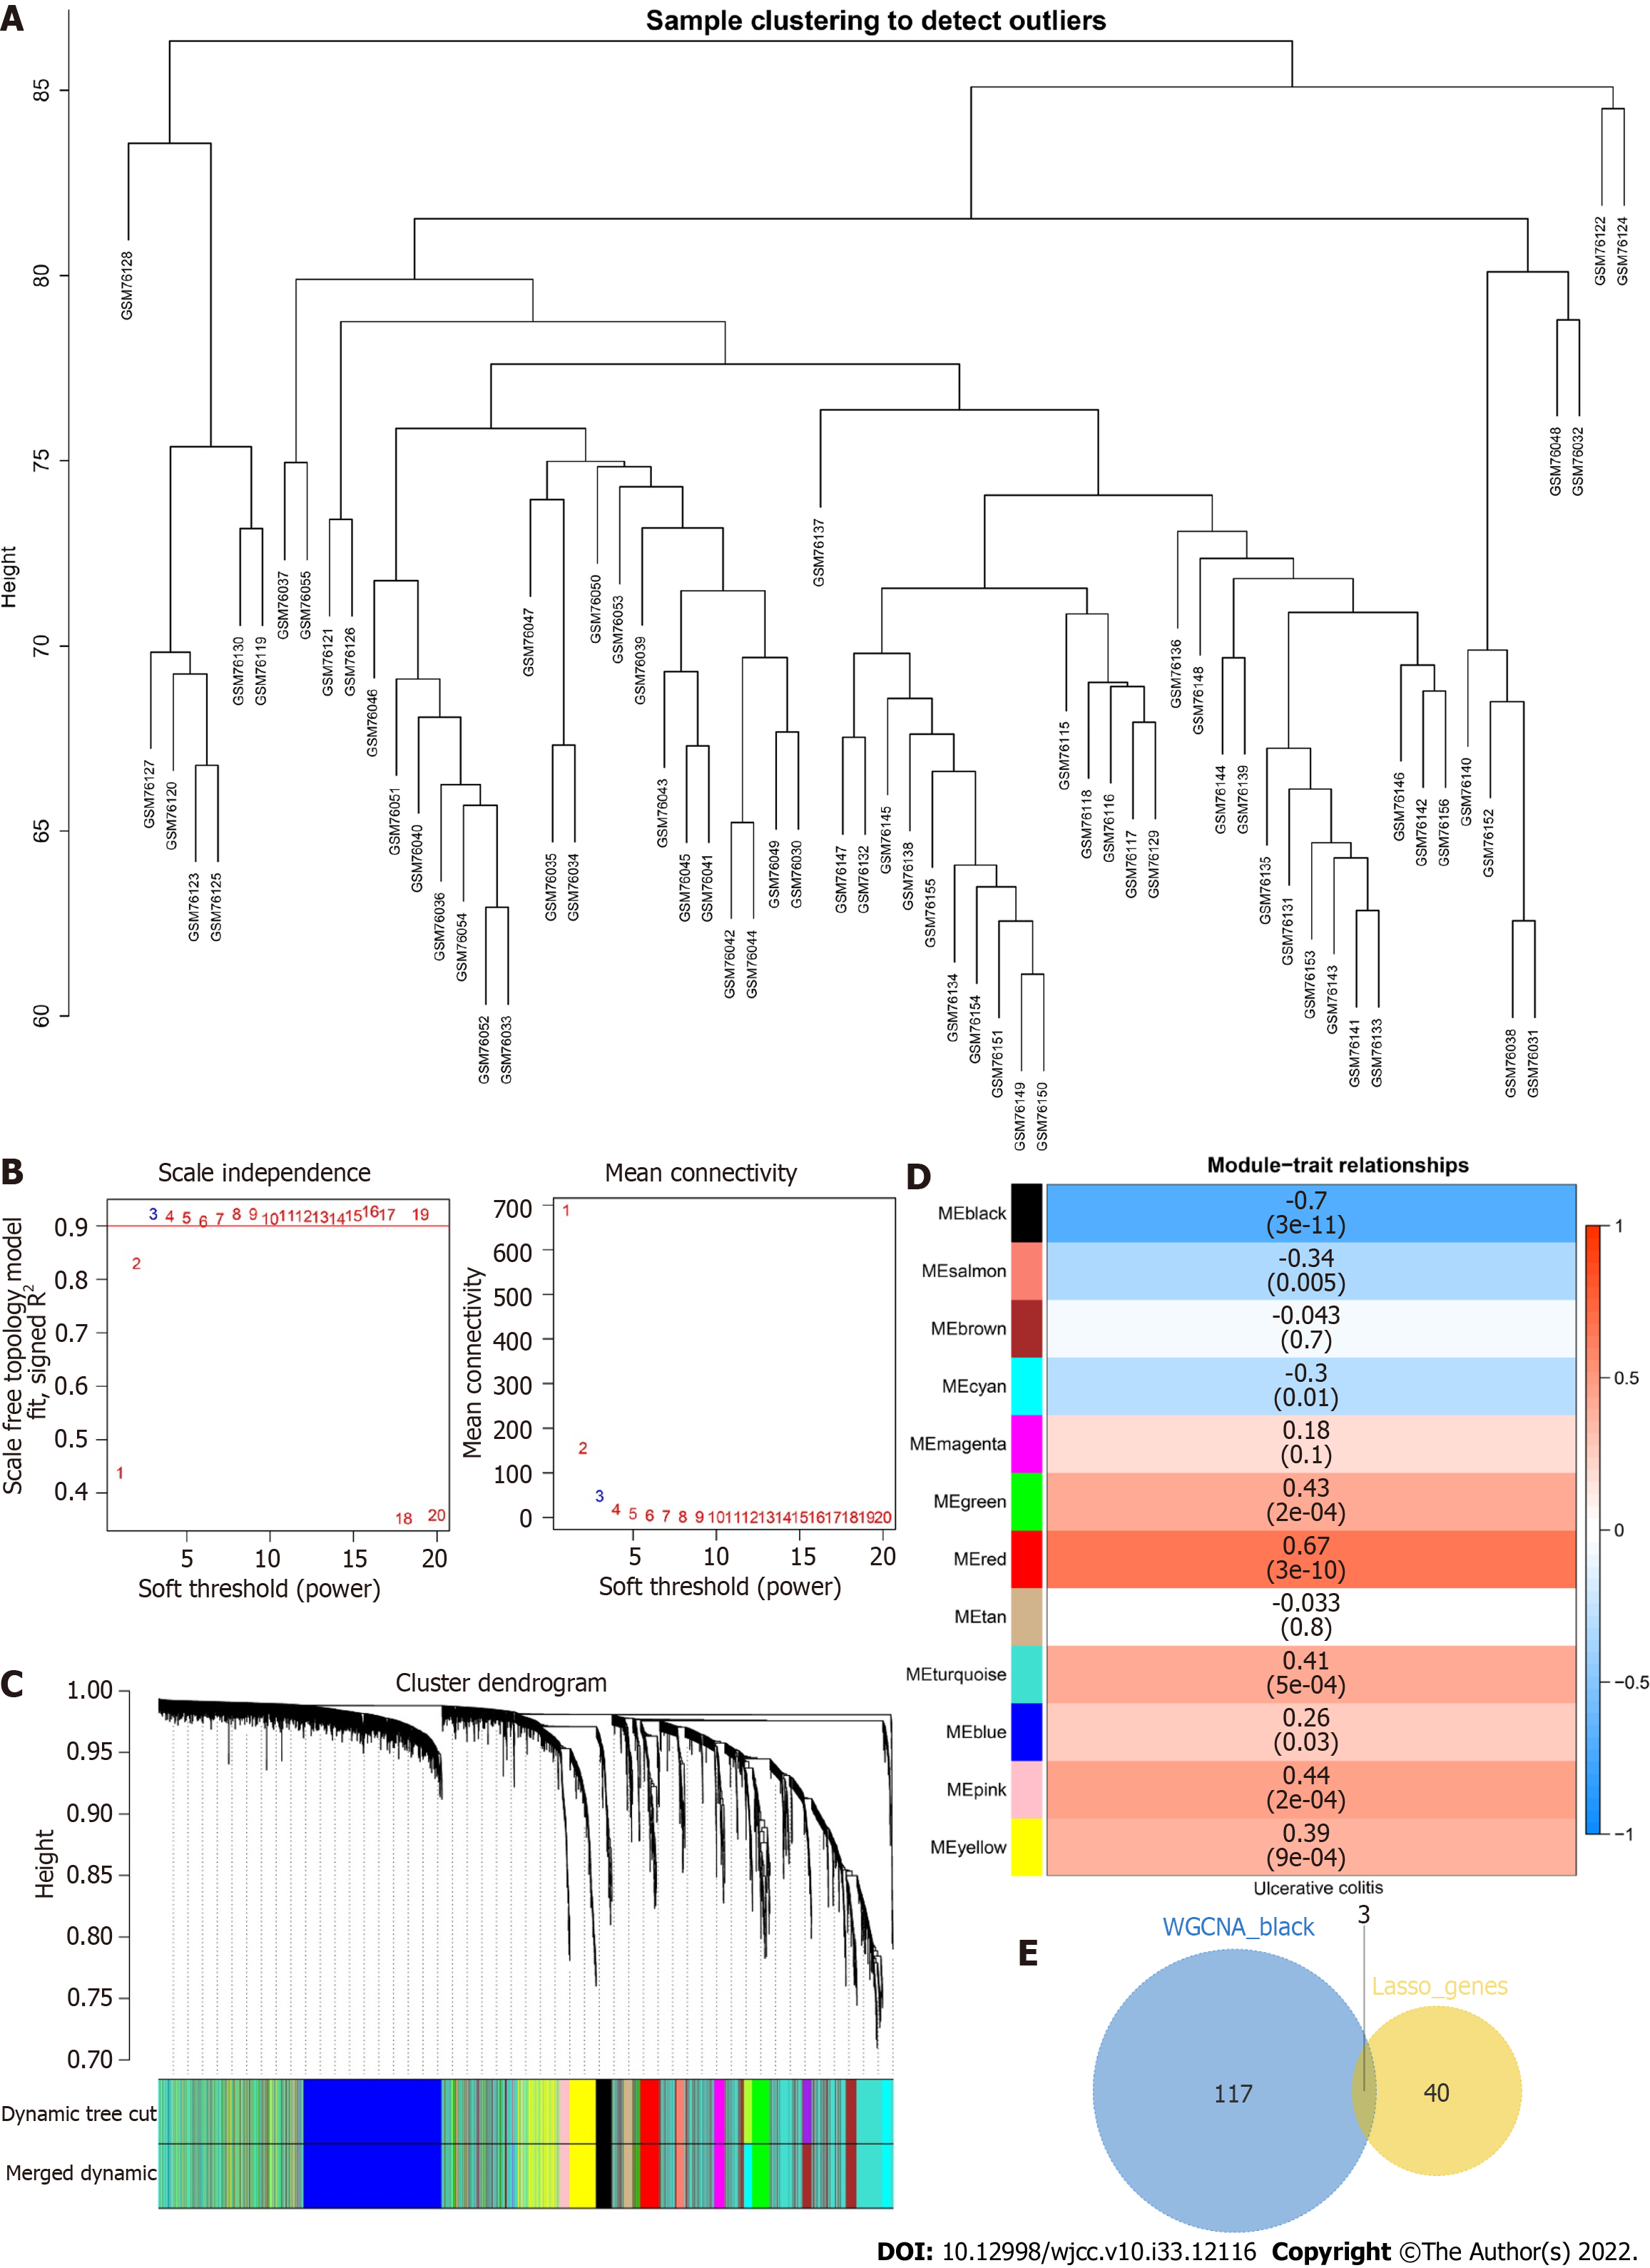
Figure 7 Construction of a weighted gene correlation network analysis network for ulcerative colitis.
A: Cluster dendrogram of the samples; B: Scale-free index and average connectivity of each soft threshold; C: Dendrogram of gene cluster. The different colors represent different modules; D: Heatmap of the correlations between module feature genes and ulcerative colitis. Blue indicates a negative correlation, and red indicates a positive correlation; E: Venn diagram of the weighted gene correlation network analysis black module with 43 least absolute shrinkage and selection operator genes.
- Citation: Dai YC, Qiao D, Fang CY, Chen QQ, Que RY, Xiao TG, Zheng L, Wang LJ, Zhang YL. Single-cell RNA-sequencing combined with bulk RNA-sequencing analysis of peripheral blood reveals the characteristics and key immune cell genes of ulcerative colitis . World J Clin Cases 2022; 10(33): 12116-12135
- URL: https://www.wjgnet.com/2307-8960/full/v10/i33/12116.htm
- DOI: https://dx.doi.org/10.12998/wjcc.v10.i33.12116


