Copyright
©The Author(s) 2022.
World J Clin Cases. Nov 26, 2022; 10(33): 12116-12135
Published online Nov 26, 2022. doi: 10.12998/wjcc.v10.i33.12116
Published online Nov 26, 2022. doi: 10.12998/wjcc.v10.i33.12116
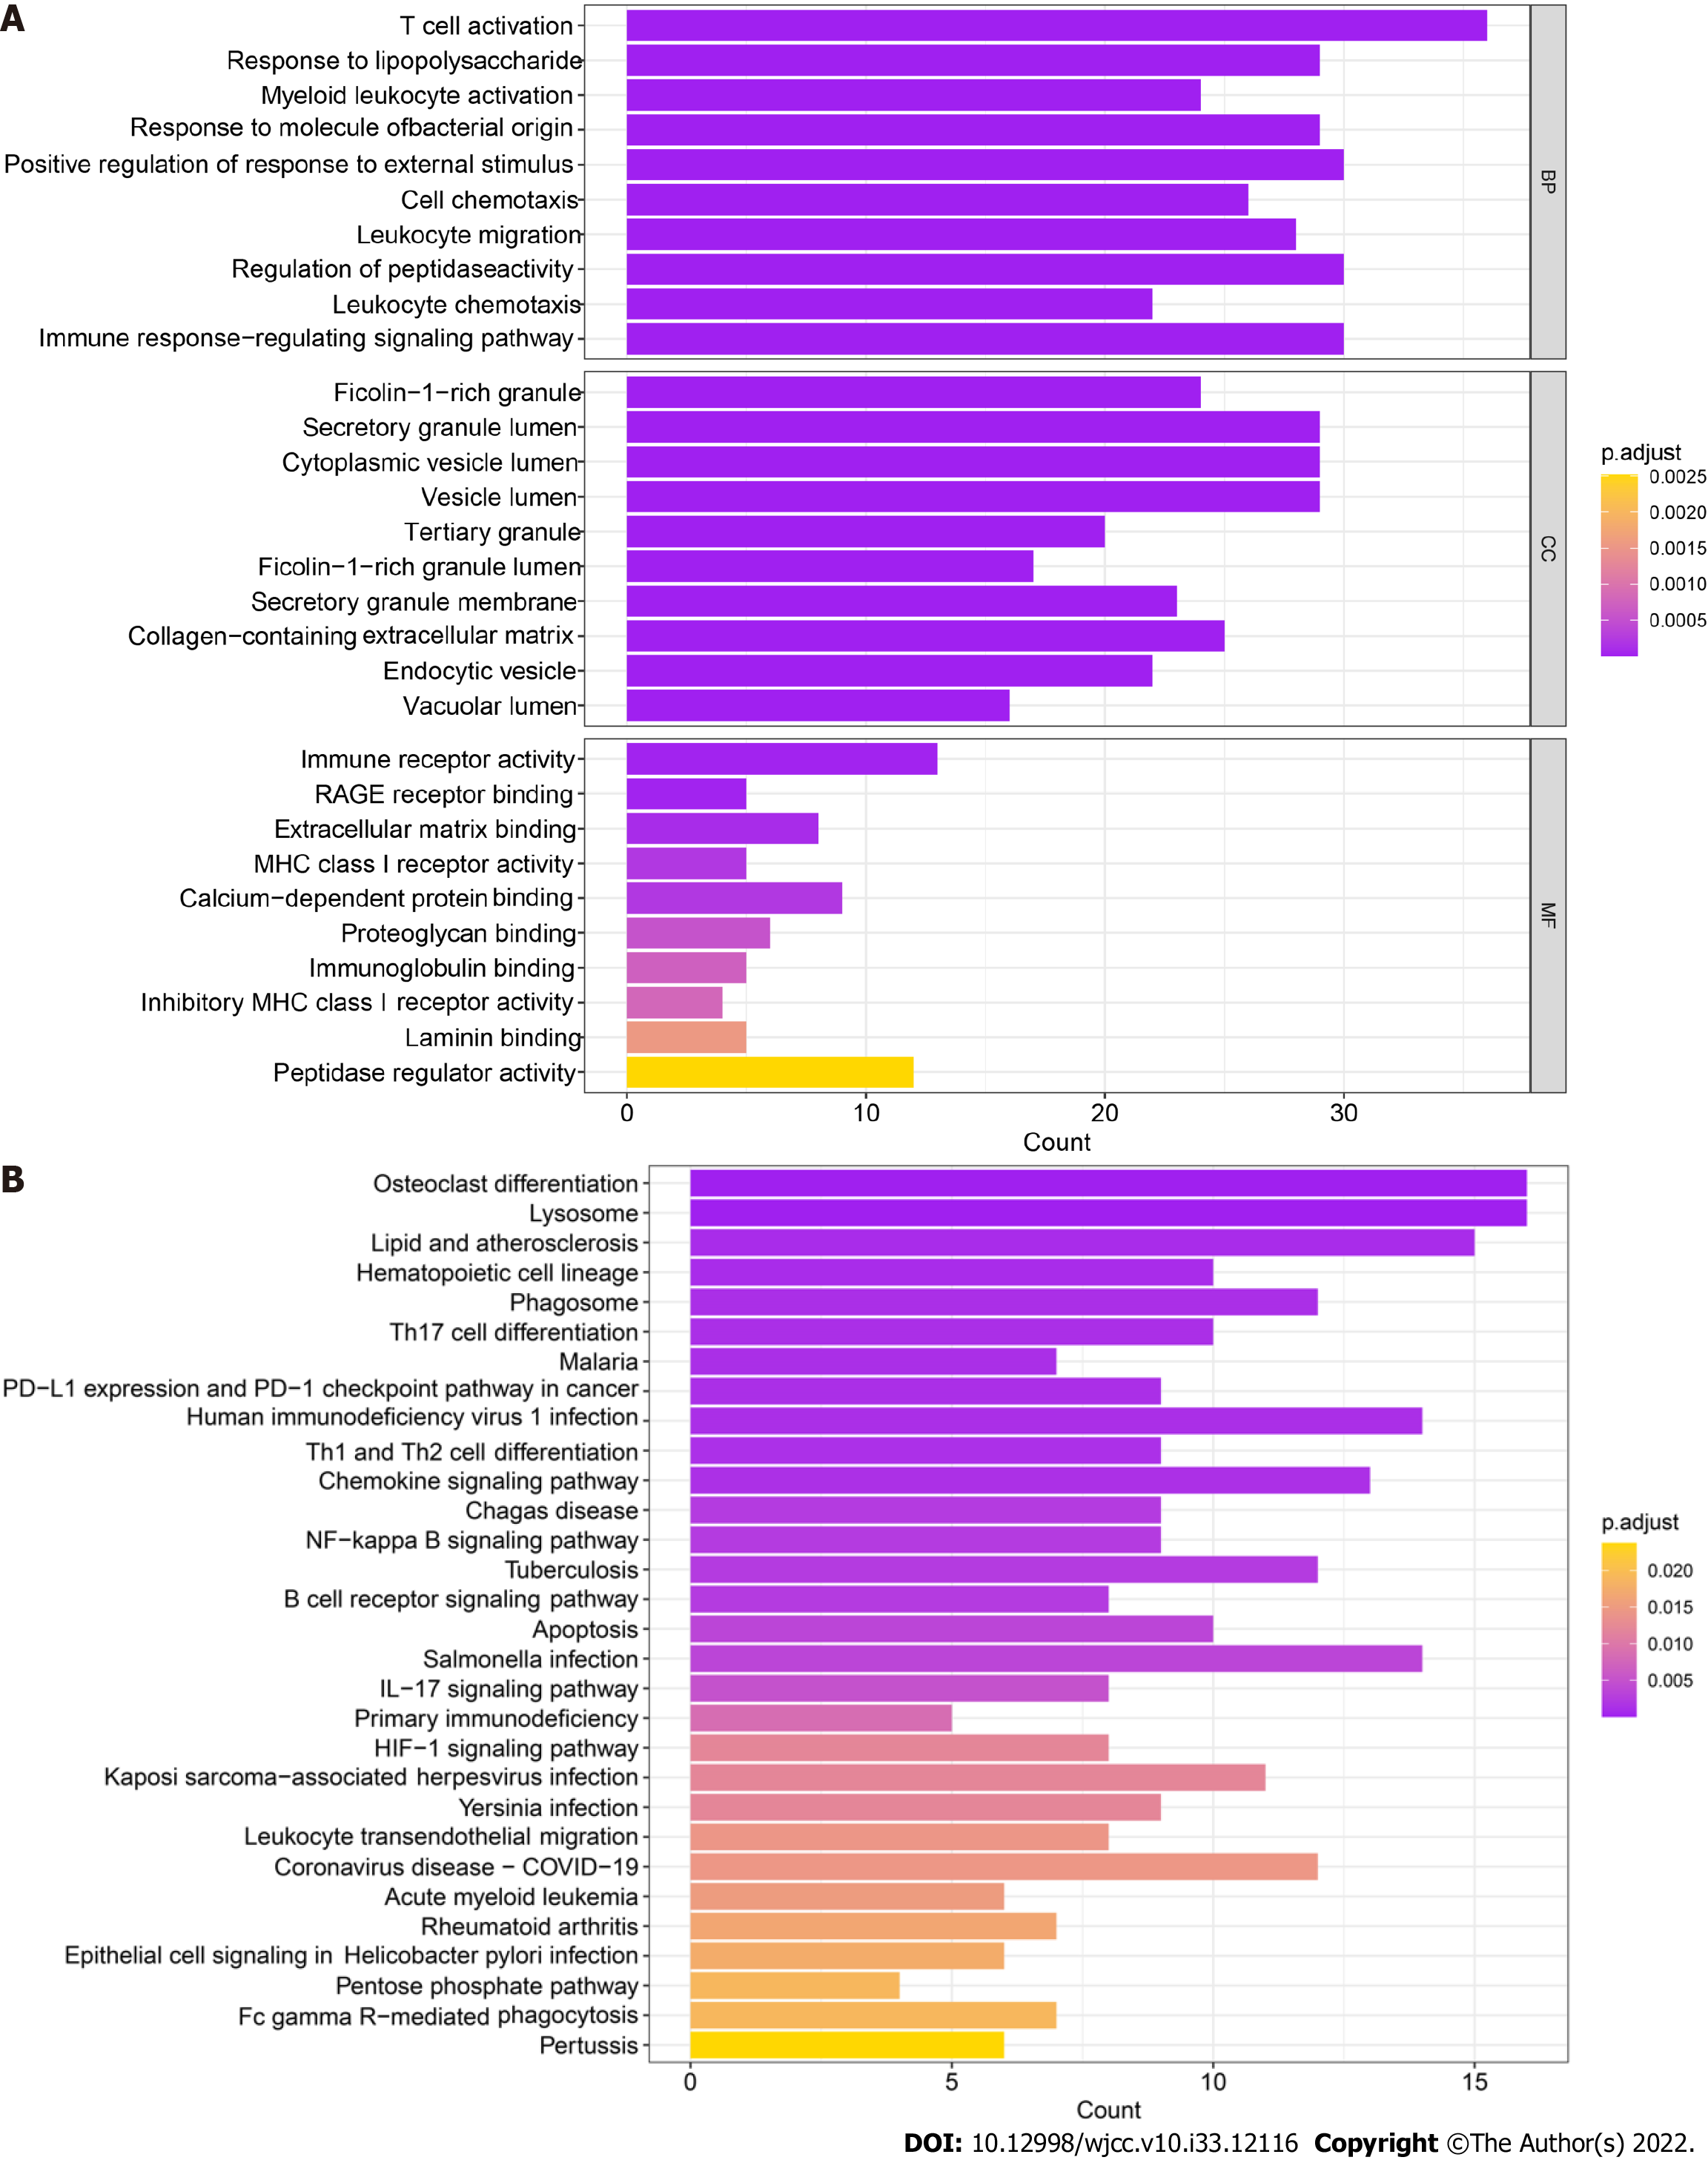
Figure 5 Functional enrichment of monocyte markers.
A: Gene Ontology enrichment analysis, including molecular function, cellular component and biological process analyses, of marker genes. The depth of the color indicates the strength of the adjusted P value; B: Kyoto Encyclopedia of Genes and Genomes enrichment analysis of marker genes. The depth of the color indicates the strength of the adjusted P value. MF: Molecular function; CC: Cellular component; BP: Biological process.
- Citation: Dai YC, Qiao D, Fang CY, Chen QQ, Que RY, Xiao TG, Zheng L, Wang LJ, Zhang YL. Single-cell RNA-sequencing combined with bulk RNA-sequencing analysis of peripheral blood reveals the characteristics and key immune cell genes of ulcerative colitis . World J Clin Cases 2022; 10(33): 12116-12135
- URL: https://www.wjgnet.com/2307-8960/full/v10/i33/12116.htm
- DOI: https://dx.doi.org/10.12998/wjcc.v10.i33.12116


