Copyright
©The Author(s) 2022.
World J Clin Cases. Nov 26, 2022; 10(33): 12116-12135
Published online Nov 26, 2022. doi: 10.12998/wjcc.v10.i33.12116
Published online Nov 26, 2022. doi: 10.12998/wjcc.v10.i33.12116
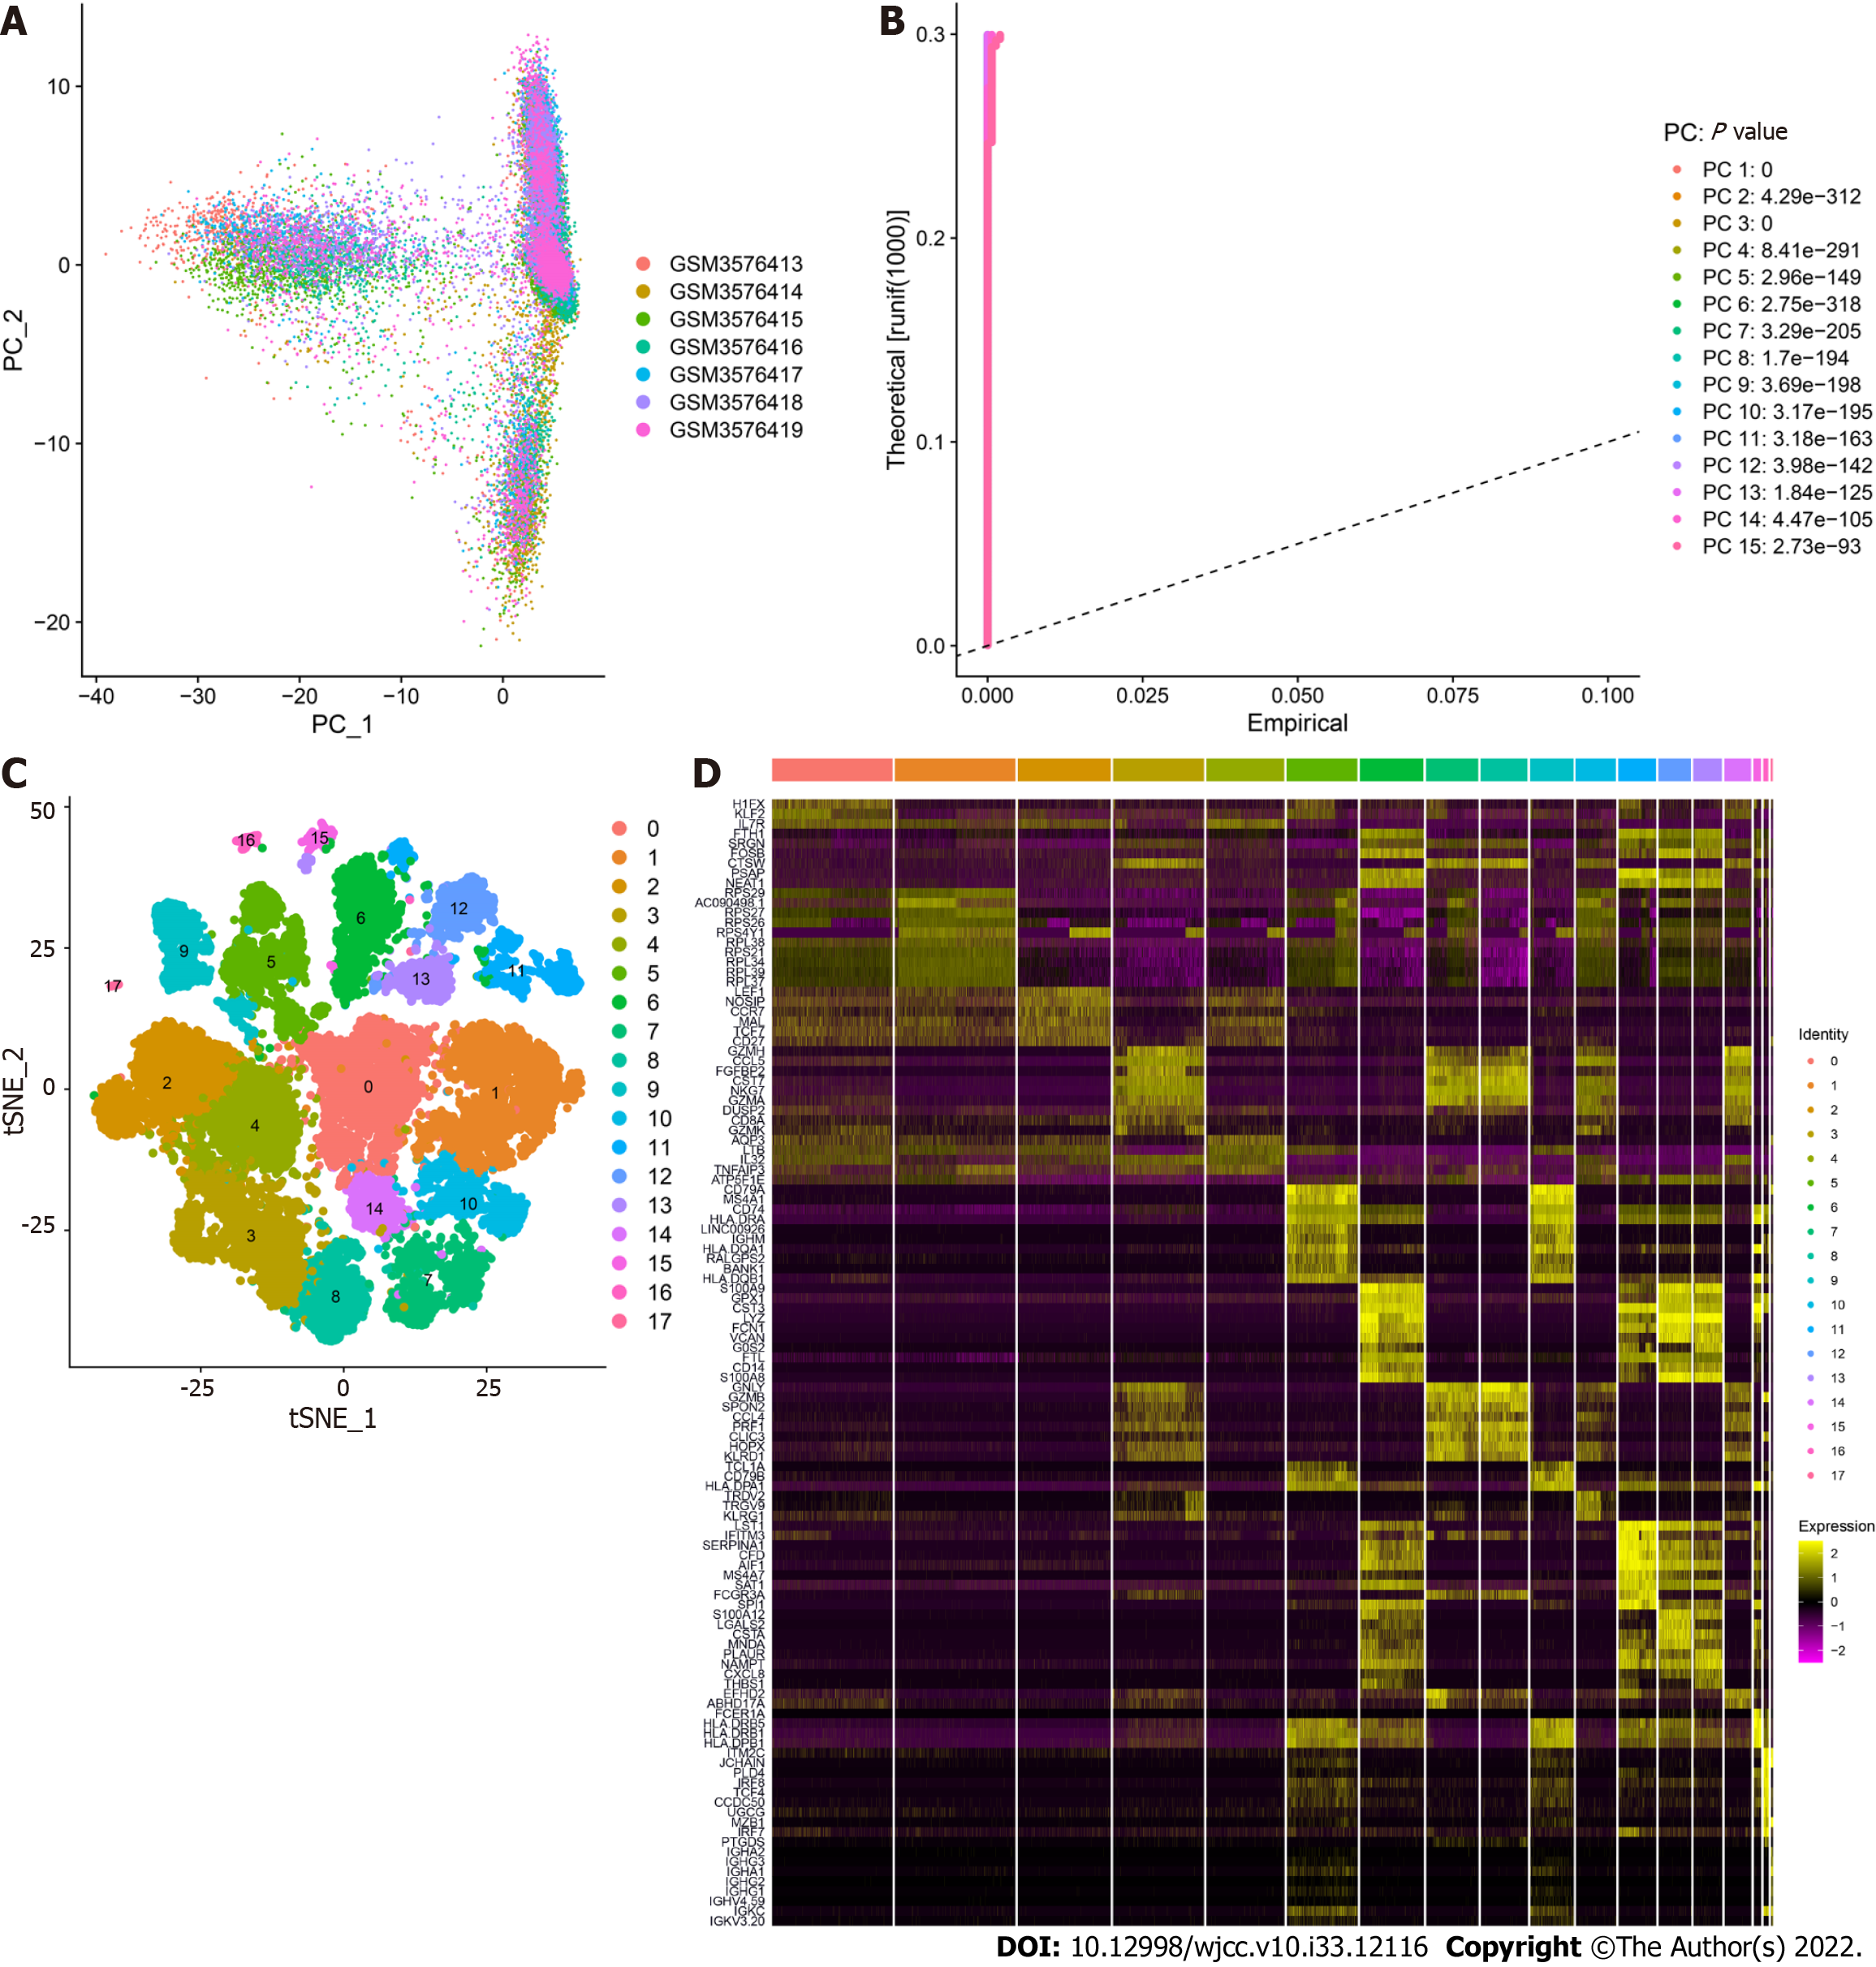
Figure 2 Clustering of peripheral blood mononuclear cell samples from ulcerative colitis patients.
A: Distribution of peripheral blood mononuclear cells. The dots represent cells, and the colors represent the samples; B: The P value corresponds to each principal component (PC), and the PC was determined based on the P value; C: According to the important components identified via PCA, the cells were divided into 17 clusters using the tSNE algorithm; D: Heatmap of the top 10 characteristic genes of each cluster.
- Citation: Dai YC, Qiao D, Fang CY, Chen QQ, Que RY, Xiao TG, Zheng L, Wang LJ, Zhang YL. Single-cell RNA-sequencing combined with bulk RNA-sequencing analysis of peripheral blood reveals the characteristics and key immune cell genes of ulcerative colitis . World J Clin Cases 2022; 10(33): 12116-12135
- URL: https://www.wjgnet.com/2307-8960/full/v10/i33/12116.htm
- DOI: https://dx.doi.org/10.12998/wjcc.v10.i33.12116


