INTRODUCTION
Reduced β cell mass is a fundamental characteristic of diabetes[1,2]. mTORC1 was previously found that could enhance β cell proliferation[3], but the underlying mechanism has yet to be fully understood. Rheb1, a GTP-binding protein and homologous protein of Ras in the Ras superfamily of small GTPases, primarily up-regulates mTORC1 signaling pathway[4,5]. Rheb1 switches between GDP-bound and GTP-bound states, activating mTOR when in the GTP-bound state[6]. mTORC1, involved in nutrient sensing, cell growth, and protein synthesis, has consistently been identified as a critical positive modulator of β cell mass and function[3,7].
AMPK signaling acts as the opposing signaling pathway to mTOR signaling, participating in energy regulation and nutrient sensing[8]. AMPK signaling represents the passive side of nutrient sensing and is involved in the inhibition of cell growth or proliferation, unlike the anabolic function of mTOR signaling[9]. Rheb1 has been shown to integrate Wnt and energy signals via a coordinated phosphorylation by AMPK and GSK3 to regulate cell growth[10]. Nevertheless, the role of Rheb1 in AMPK signaling in the islets or the pancreatic β cells is still unknown.
The sources of rodent β cells mainly include the proliferation of existing β cells, transdifferentiation from other cells (such as pancreatic ductal epithelial cells and pancreatic α cells)[11,12], and neogenesis[13]. β-cell dedifferentiation has recently been identified as one of the primary mechanisms for the failure of β cells[13]. GRB10, the upstream negative regulator of mTORC1, could promote β cell dedifferentiation and decrease β-cell mass by regulating mTORC1 signaling[14]. However, the role of Rheb1 in β-cell dedifferentiation remains unclear.
In this study, we demonstrated that Rheb1 regulates β cell proliferation through both mTORC1 and AMPK signaling. Neither activating AMPK nor inhibiting mTORC1 could fully reverse Rheb1-induced β cell proliferation; instead, the combined inhibition of AMPK and activation of mTORC1 could fully inhibit Rheb1-induced β cell proliferation. As a result, Rheb1 promotes β cell proliferation through both the activation of mTORC1 signaling and inhibition of AMPK pathway simultaneously. Additionally, we unexpectedly discovered that Rheb1 might maintain β cell identity by activating mTORC1 and Notch1 signaling.
MATERIALS AND METHODS
Human studies
Human pancreases were obtained from nondiabetic donors by the Department of Urological Organ/Liver Transplantation team at the Second Xiangya Hospital of Central South University. The human pancreas was trimmed by carefully cleaning away the surrounding fat tissue, lymph nodes, vessels, and membranes. Pancreatic ducts were cannulated and inflated by a 5-mL syringe. Hanks' balanced salt solution containing 1 mg/mL collagenase P was injected through the pancreatic duct. The amount of collagenase solution was equivalent to double the pancreatic weight. Pancreases were removed and incubated at 37 °C for approximately 20-30 min to allow complete digestion. The tubes were placed in an ice bath (4 °C) to inactivate collagenase P and preserve the islets. Digestion was stopped by the addition of Hanks buffer followed by rinsing the pancreases with RPMI-1640 medium three times. Isolated islets were selected with the aid of a pipette under a stereoscopic microscope from the medium and maintained in RPMI-1640 with 10% fetal bovine serum (FBS). The use of isolated human islets was approved by the Ethics Committee (protocol MSRC2016 LF).
Animal studies
bRheb1KO and pRheb1KO mice were produced by mating Rheb1 loxP (Rheb1 flox+/+) mice[3] with Ins2-Cre mice (generated by Dr Weiping Zhang’s lab) which has stable cre expression and activity in beta cells rather than hypothalamic neurons[15], or PDX1-Cre mice with C57BL/6J background (The Jackson Laboratory 014647), respectively. Homozygous Rheb1 flox+/+ were breed with Ins2-Cre mice, or PDX1-Cre mice to produce the first generation of heterozygous mice (Ins2-Cre+/−Rheb1 flox+/−; PDX1-Cre+/−Rheb1 flox+/−). The heterozygous mice were further breed with homozygous Rheb1 flox+/+ mice to generated bRheb1KO (Ins2-Cre+/−Rheb1 flox+/+) and pRheb1KO mice (PDX1-Cre+/−Rheb1 flox+/+) and its Rheb1 flox+/+ wild-type (WT) littermates. All animal studies were performed under a protocol approved by the Animal Care and Use Committee and in compliance with all relevant ethical regulations for animal testing and research (20240083).
Mouse islet isolation
Male mice, fasted overnight, were anesthetized via intraperitoneal injection of Avertin (1 mL per 40 g body weight). To inflate the pancreas, 3 mL of collagenase P solution [Sigma, St. Louis, MO; 1 mg/mL in Hank’s buffered salt solution (HBSS)] was injected. The pancreases were then excised and incubated at 37 °C for approximately 12 minutes to facilitate digestion. The process was halted by adding 30 mL of HBSS, followed by three washes with 20 mL of RPMI-1640 medium. Isolated islets were manually selected under a stereoscopic microscope and cultured in RPMI-1640 medium, either with or without 10% FBS, or in HEPES-buffered Krebs-Ringer bicarbonate solution (119 mmol/L NaCl, 4.74 mmol/L KCl, 2.54 mmol/L CaCl2, 1.19 mmol/L MgCl2, 1.19 mmol/L KH2PO4, 25 mmol/L NaHCO3, and 10 mmol/L HEPES at pH 7.4) containing 0.5% BSA at 37 °C.
Western blot analysis
Western blot analysis was performed to assess protein expression in lysates from islets or Rheb1 KO/OE MIN6 cells. Specific antibodies were used to detect Rheb1 (CST 13879S), Cyclin D1 (CST 5506S), Cyclin D2 (CST 3741S), phosphorylated S6 at Ser235 (CST 5364S), phosphorylated 4EBP1 at Thr37/46 (CST 9459S), total S6 (CST 2217S), and total 4EBP1 (CST 2855S).
Quantitative real-time PCR
Total RNA was extracted from human or animal islets and Rheb1 OE/KO MIN6 cells using TRIzol reagent (Invitrogen). Complementary DNA (cDNA) was synthesized with random primers (Roche) and ImProm-II reverse transcriptase (Promega). Quantitative real-time PCR was conducted in triplicate on a 7900HT system (Applied Biosystems) using SYBR Green Master Mix.
RNA interference
Islets or cells were maintained in antibiotic-free medium for 24 hours before transfection with either Rheb1 siRNA (RiboBio; siG161129043512) or scrambled siRNA (RiboBio) at a final concentration of 25 nM. Transfection was carried out using Lipofectamine™ 3000 (Thermo Fisher; L3000015) following the manufacturer's instructions. The next day, the transfection medium was replaced with standard culture medium.
Immunofluorescence and confocal microscopy
Mouse pancreases were systematically sectioned at a thickness of 10 µm along the head-to-tail axis, with tissue sections collected at 200 µm intervals. For each mouse, eight sections were selected. Immunofluorescence (IF) experiments were performed as previously described[14]. Mouse pancreatic sections were stained with an anti-insulin antibody (Sigma I2018) and examined using an Olympus IX70 inverted microscope. Images were captured with a Sport II digital camera. Insulin-positive β-cell clusters (islets) were outlined, and insulin-immunoreactive areas were quantified using the threshold function. The total tissue area was also measured by distinguishing stained regions from unstained areas. Islet size (μm2) and section area were analyzed with ImageJ software. For each pancreas, four to eight sections were examined, with data collected from eight non-overlapping fields, each measuring 1.5 × 106 μm2. β-cell area and size assessments were performed using ImageJ or Image-Pro Plus (Version 5.0, Media Cybernetics, Inc.). β-cell mass was calculated by multiplying the insulin-positive area/total pancreatic area with pancreatic weight. The β-cell/islet ratio was calculated as insulin-positive area/islet area. The proportion of α-cells was determined by glucagon staining and represented as glucagon-positive area/total islet area.
Adenovirus generation and adenoviral infection
Recombinant adenoviruses expressing GFP and mouse Rheb1 were constructed using the pAdEasy system. MIN6 cells, kindly provided by Dr. Zhuoxian Meng’s lab at Zhejiang University, were maintained in high-glucose DMEM supplemented with 10% FBS, 1% penicillin-streptomycin, and 50 μmol/L β-mercaptoethanol. Cells were infected with adenoviruses at a multiplicity of infection of 30. Infection efficiency was evaluated 24 hours later by detecting GFP fluorescence under a fluorescence microscope.
Generation of stable Rheb1 overexpression cell lines
The Rheb1 OE MIN6 cell line and its corresponding control were developed as follows: Full-length mouse Rheb1 cDNA (amino acids 1-185) was inserted into the PWPI plasmid from Addgene, which contains a C-terminal FLAG tag. The PWPI-Rheb1 construct and an empty vector were co-transfected into 293T cells (Invitrogen) along with packaging plasmids psPAX2 and PMDG2.0. Both control and Rheb1-OE cells were cultured in separate flasks to form independent clones. After 48 hours of transfection, viruses were harvested and used to infect MIN6 cells. Stable lines were selected using fluorescence-activated cell sorting. Rheb1 expression in these cell lines was confirmed by IF and immunoblotting.
Cell viability
CCK-8 kit was used to examine the effect of Rheb1 on MIN6 cell viability. MIN6 cell were treated with GFP or Rheb1OE adenovirus for 48 hours with or without rapamycin and AICAR treatment. 10 μL CCK-8 reagent (5 mg/mL, Sigma-Aldrich, St. Louis, MI, United States) was added to the 96-well plate and incubated cell at 37 °C for 2 hours. The 96-well plate was finally measured by the microplate meter at the 450 nm absorbance.
5-ethy-nyl-2’-deoxyuridine proliferation assay
The 5-ethy-nyl-2’-deoxyuridine (EdU) assay kit (Ribobio) was used to measure the proliferative ability of MIN6 cell. MIN6 cell were treated with GFP or Rheb1OE adenovirus for 48 hours with or without rapamycin and AICAR treatment and then cultured in medium-containing EdU (final concentration of 10 μm) at 37 °C for 2 hours. After washing with PBS 2 times, 4% paraformaldehyde was used to fix the MIN6 cell. The cells were then incubated with Hoechst 33342 stain for 30 minutes. The ratio of EdU-positive cells to the total number of cells was finally analyzed by Image-Pro Plus software.
Statistical analyses
In this study, statistical comparisons between two groups were performed using an unpaired, two-tailed Student’s t-test. For multiple group comparisons, Analysis of Covariance (ANOVA) followed by Tukey’s post-hoc test was employed. Normality was evaluated using the Shapiro-Wilk test, confirming that the data followed a normal distribution. Data are presented as mean ± SEM.
RESULTS
Rheb1 upregulates β cell mass and mTORC1 signaling
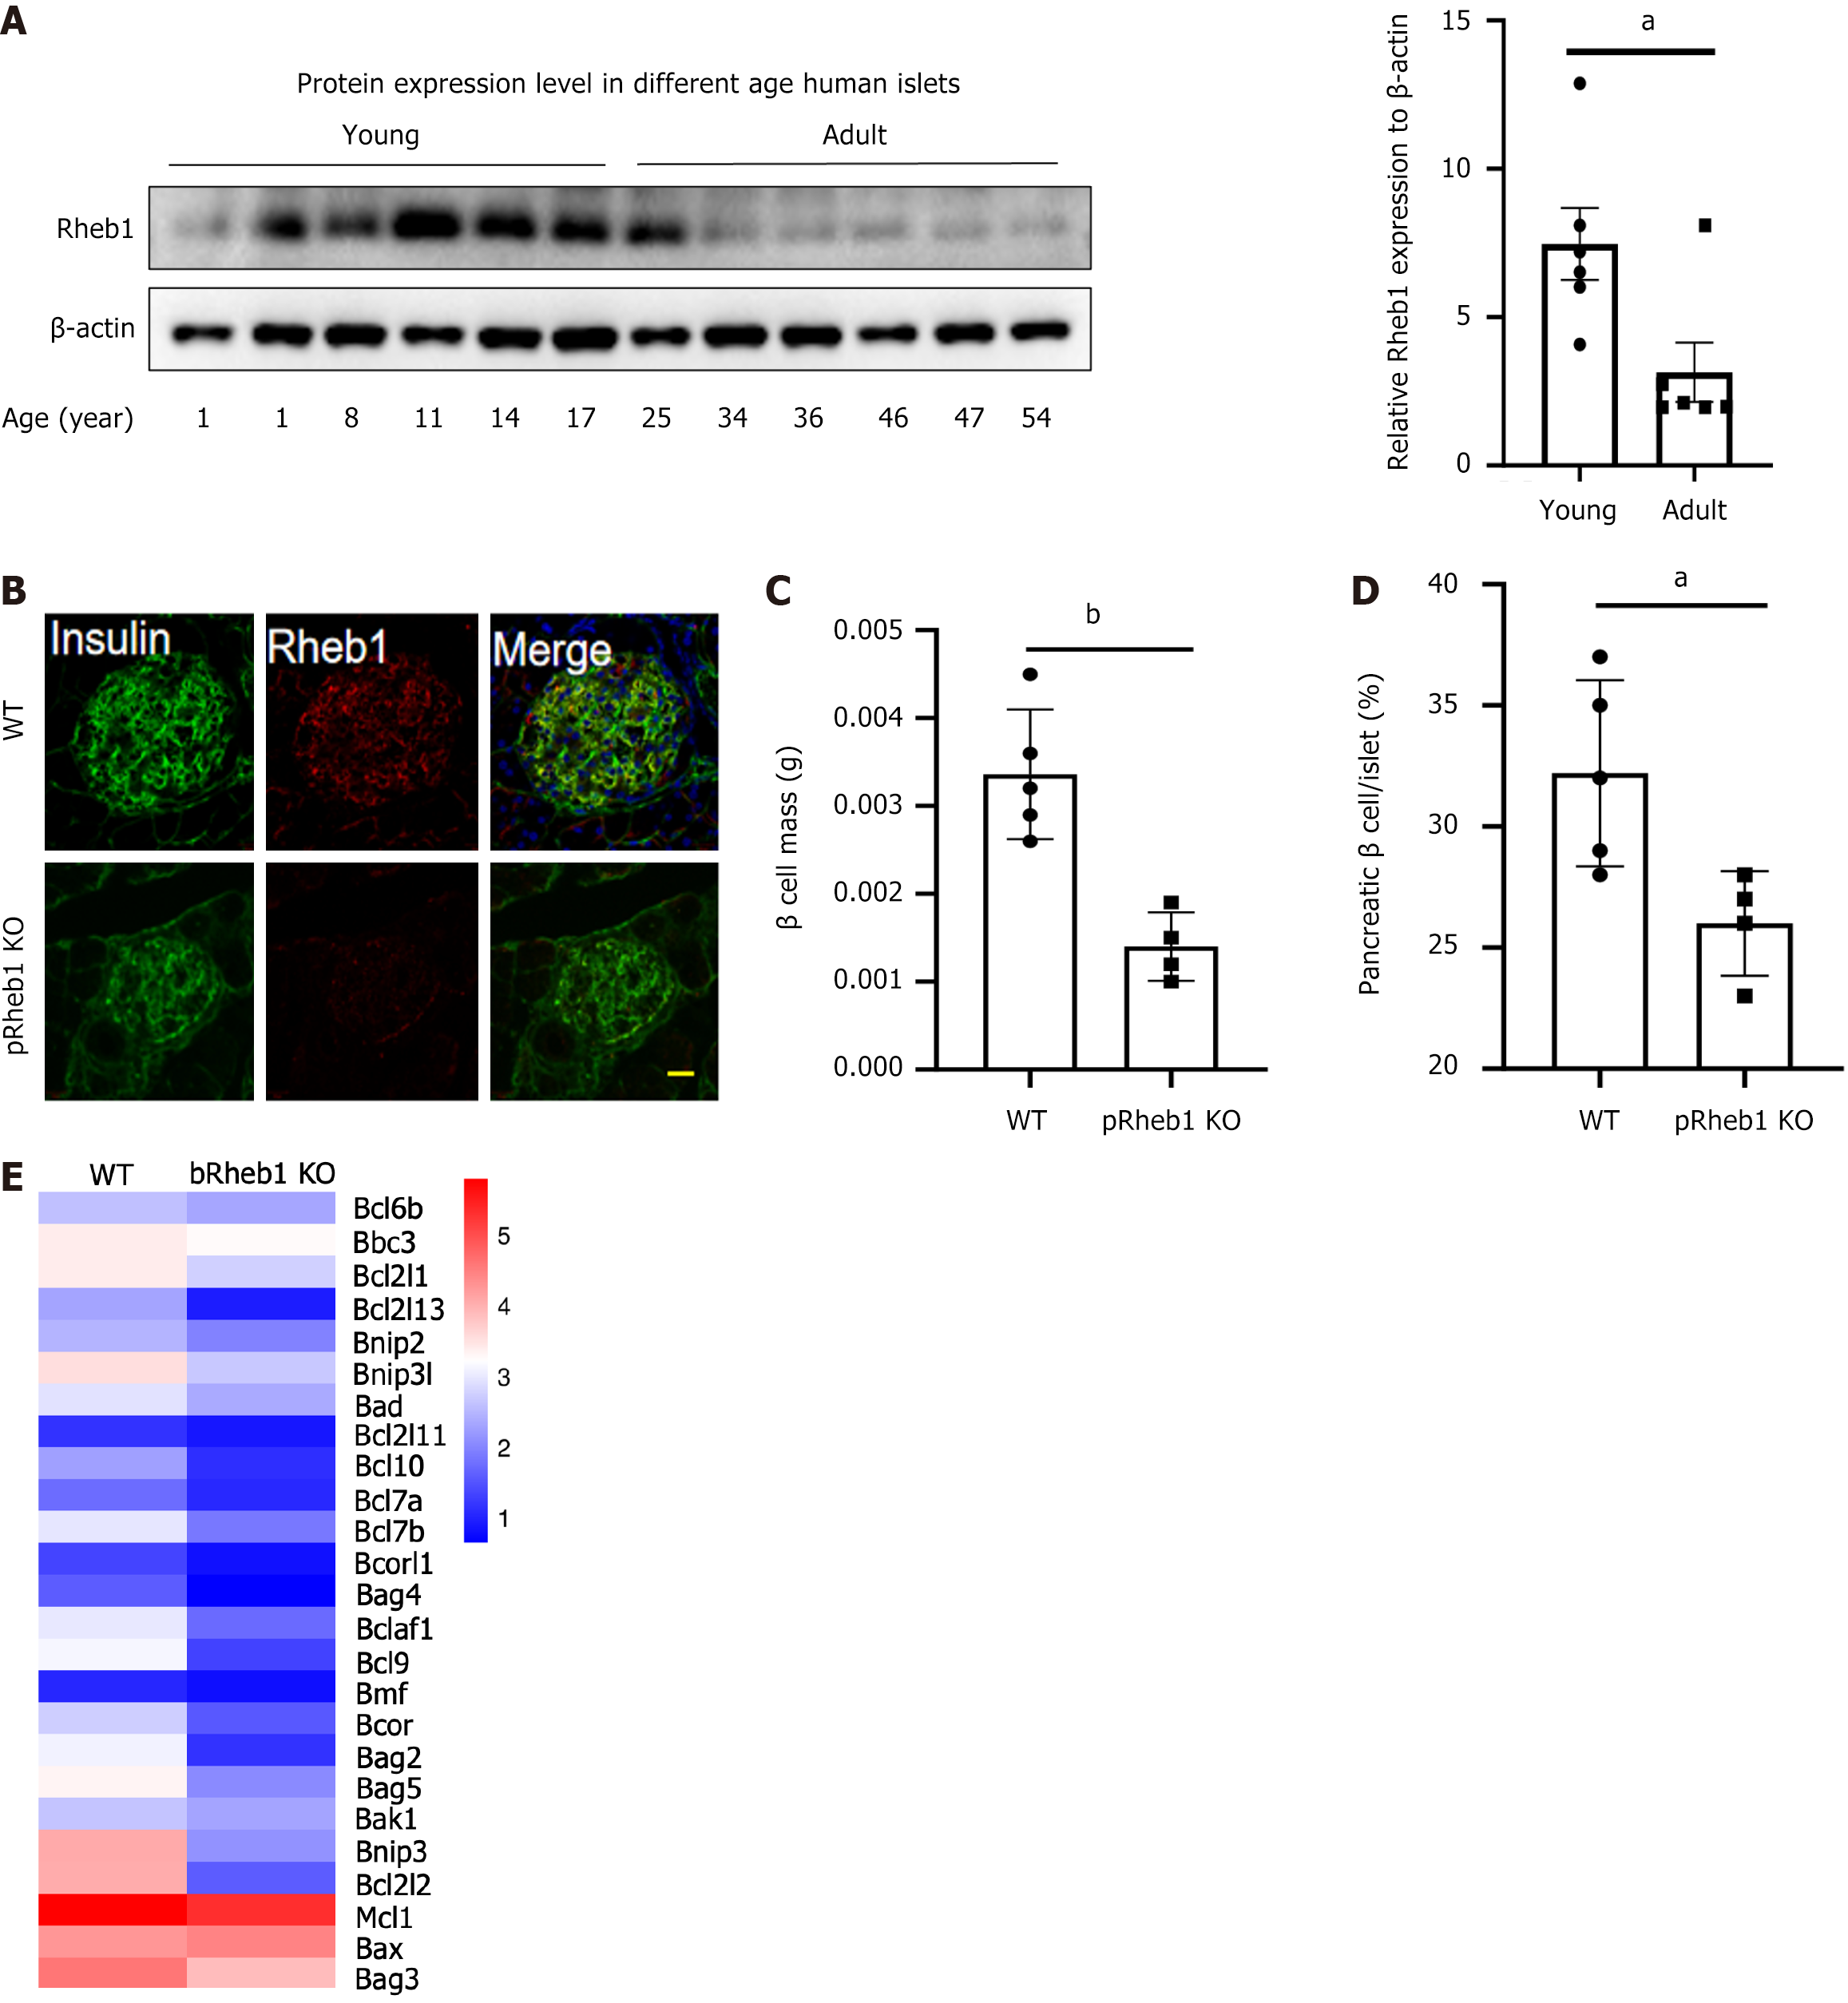
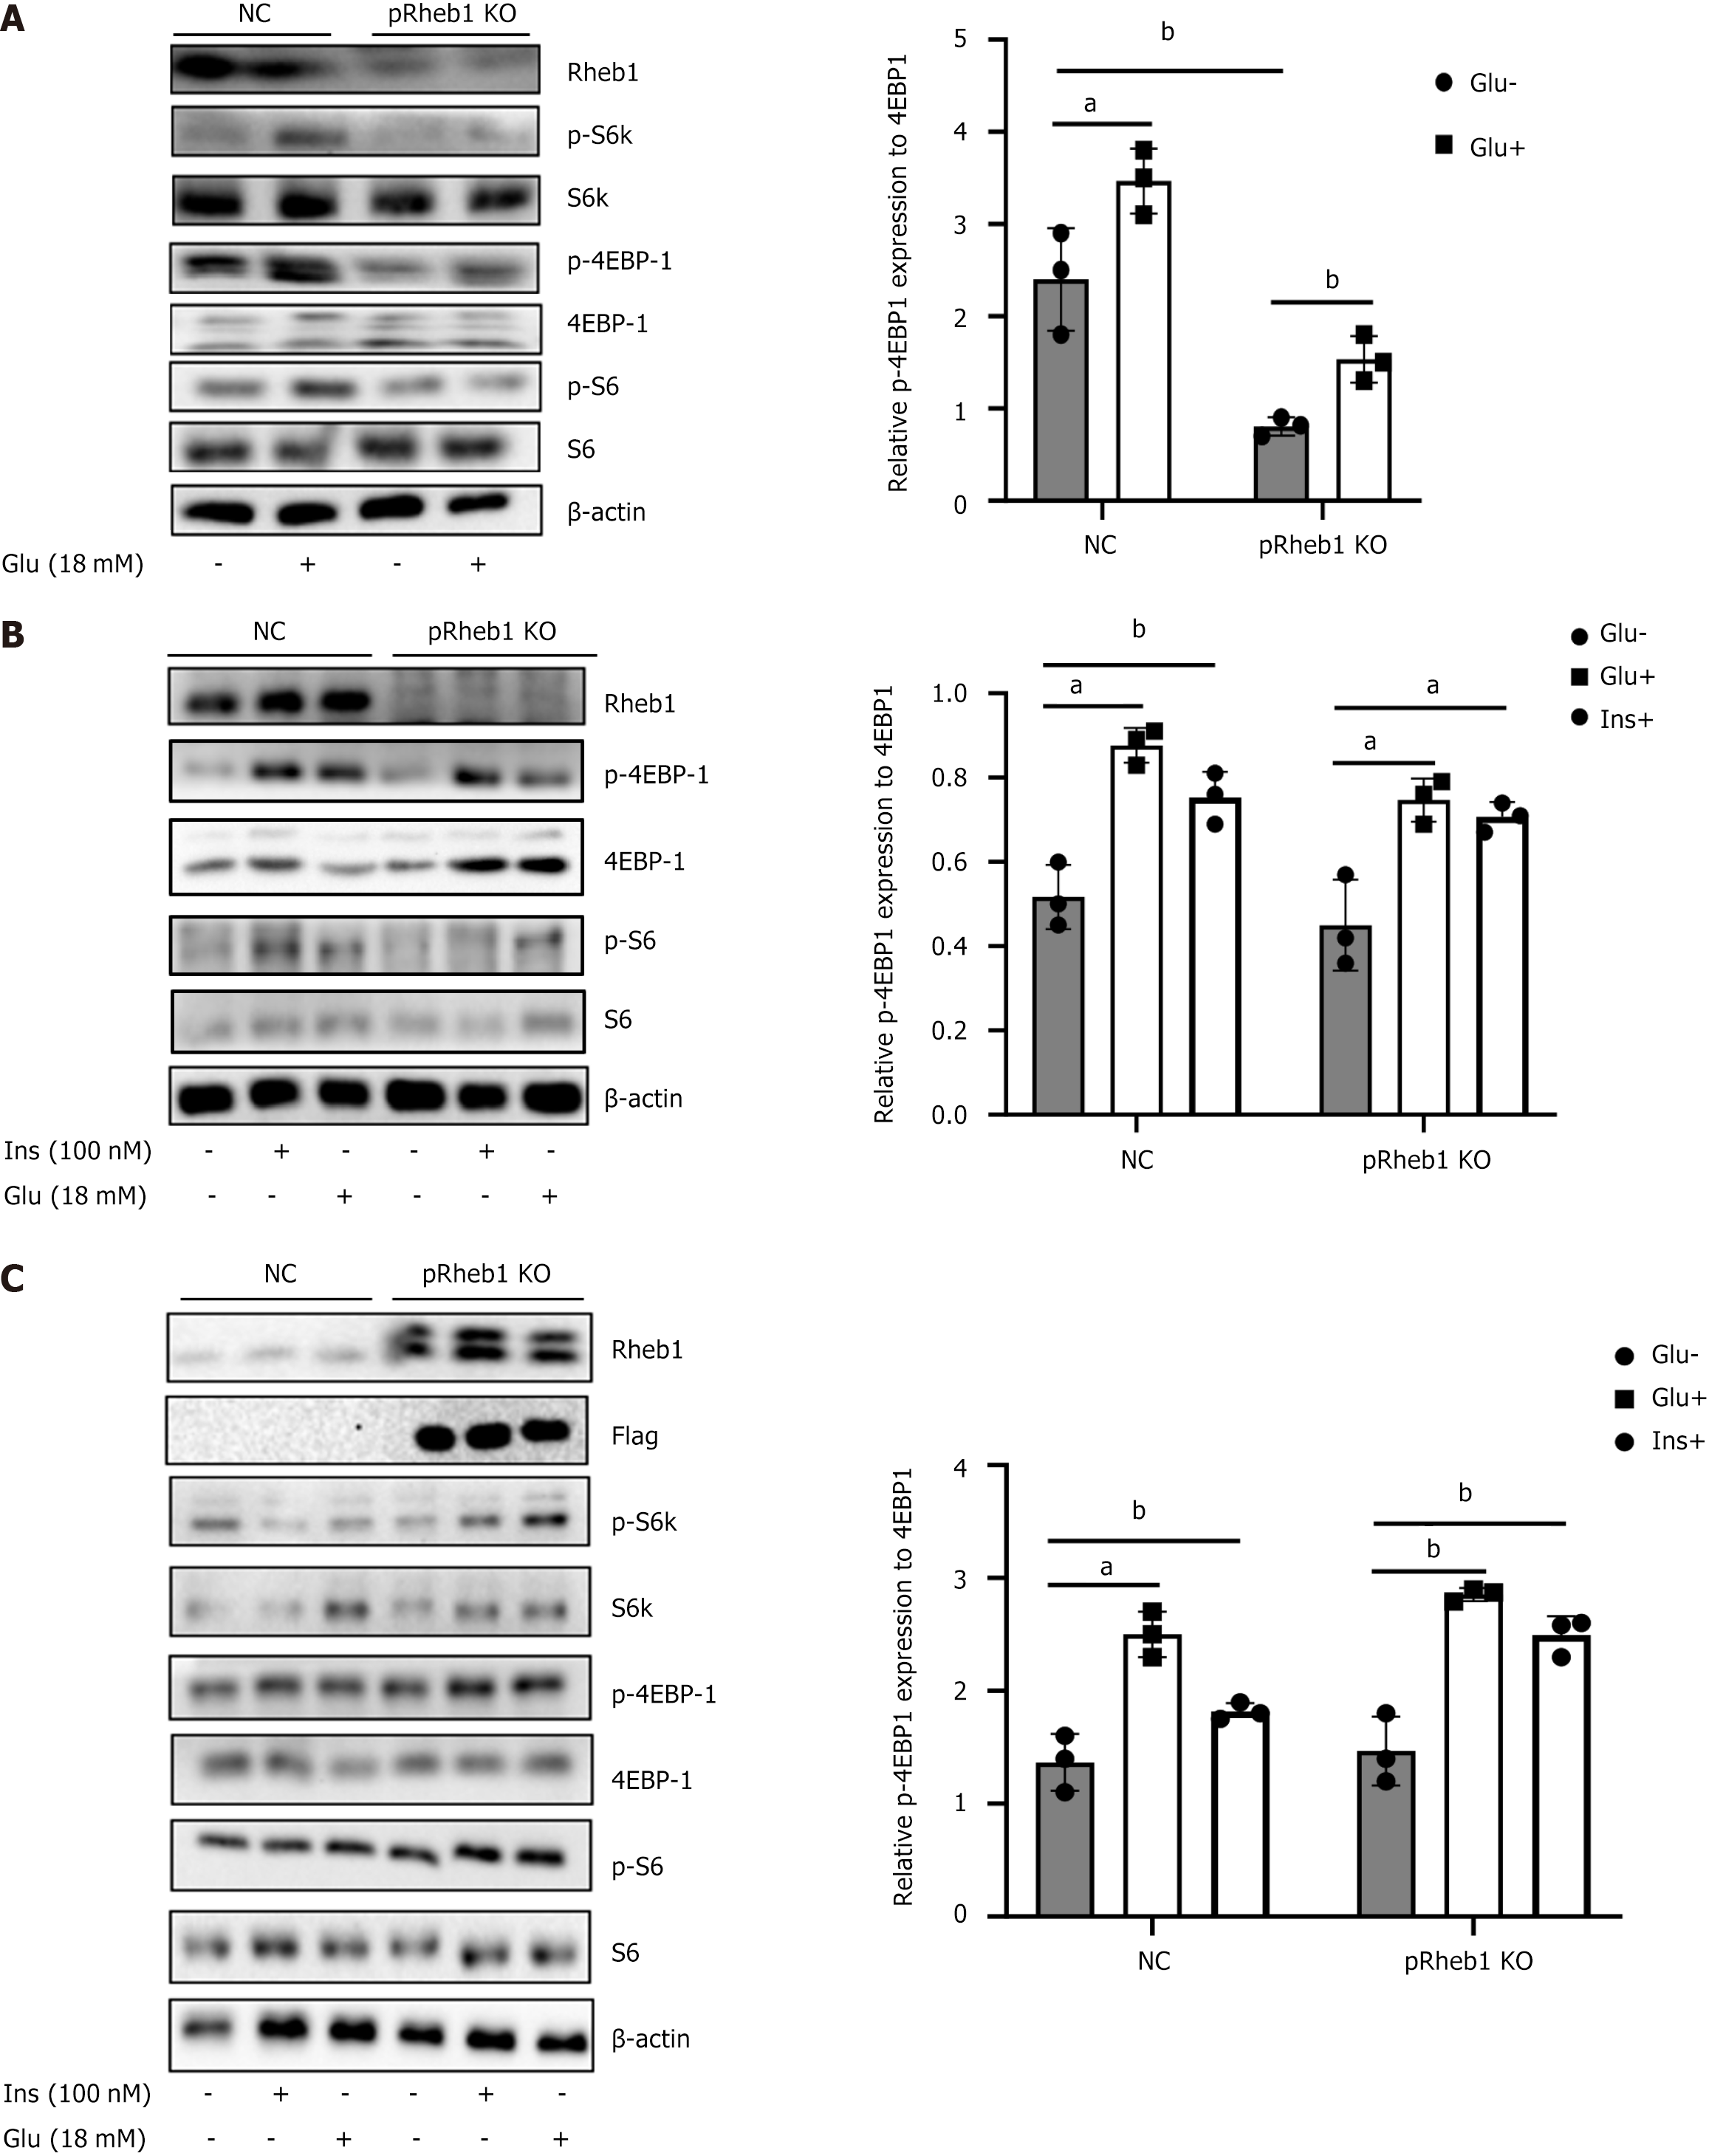
To figure out the potential role of Rheb1 in the physiology of islet β cells, Rheb1 protein level in human islets isolated from different age was examined. Interestingly, Rheb1 was significantly higher in young people (< 25 years) compared with adults (age more than 34 years; Figure 1A). pRheb1KO mice were successfully constructed as previously validated (Figure 1B). Sharply reduced β-cell mass (Figure 1C) with decreased percentage of β-cell in islets (Figure 1D) were found in the pRheb1KO mice. We also analyzed the anti-apoptotic genes of our RNA-seq results and found that these anti-apoptotic genes were decreased in bRheb1KO mice islets compared with WT islets (Figure 1E), which indicating that Rheb1 in islets may also positively regulate anti-apoptotic genes. Considering the direct role of Rheb1 on mTORC1 pathway, the mTORC1 signaling were examined and found that the downstream of mTORC1 signaling including p-S6 and p-4EBP1 were significantly inhibited in the islets of pRheb1KO mice either in the basal condition or the high glucose and insulin stimulation (Figure 2A and B). Consistent with this, the Rheb1 overexpression on the C57 mice islets also successfully activated the mTORC1 signaling with increased p-S6K, p-S6 and p-4EBP1 under high glucose or insulin stimulation (Figure 2C).
Figure 1 Rheb1 upregulates β cell mass and mTORC1 signaling.
A: Rheb1 expression in the islets isolated from people with different age; B: Immunofluorescence staining of Rheb1 (red) and insulin (as a β-cell marker; green) in pancreatic sections of 8-week-old male pRheb1KO mice (n = 3) and wild-type (WT) mice (n = 3). Scale bars: 10 μm; C and D: Average β-cell mass and β-cell size in pancreatic sections of 2-month-old male pRheb1KO (n = 4) and WT mice (n = 5) subjected to insulin staining; E: Anti-apoptotic genes from RNA-seq of islets of bRheb1KO mice (n = 3) and WT mice (n = 3), of which is reanalyzed from our previous RNA-seq data[3]. All data are represented as the mean ± SD, aP < 0.05, bP < 0.01. WT: Wild-type.
Figure 2 Rheb1 activates mTORC1 signaling in islets.
A: The expression of mTORC1 signaling and its downstream in the islets isolated from pRheb1KO (n = 2) and Flox (n = 2) with or without glucose stimulation; B: The expression of mTOC1 signaling and its downstream in the islets isolated from pRheb1KO (n = 3) and Flox (n = 3) with or without glucose and insulin stimulation; C: Western blot analysis of C57 islets treated with GFP (n = 3) or Rheb1OE (n = 3) adenovirus for 48 hours with or without glucose and insulin stimulation. All data are represented as the mean ± SD, aP < 0.05, bP < 0.01. NC: Negative control.
Rheb1 promotes β cell proliferation only partly through mTORC1
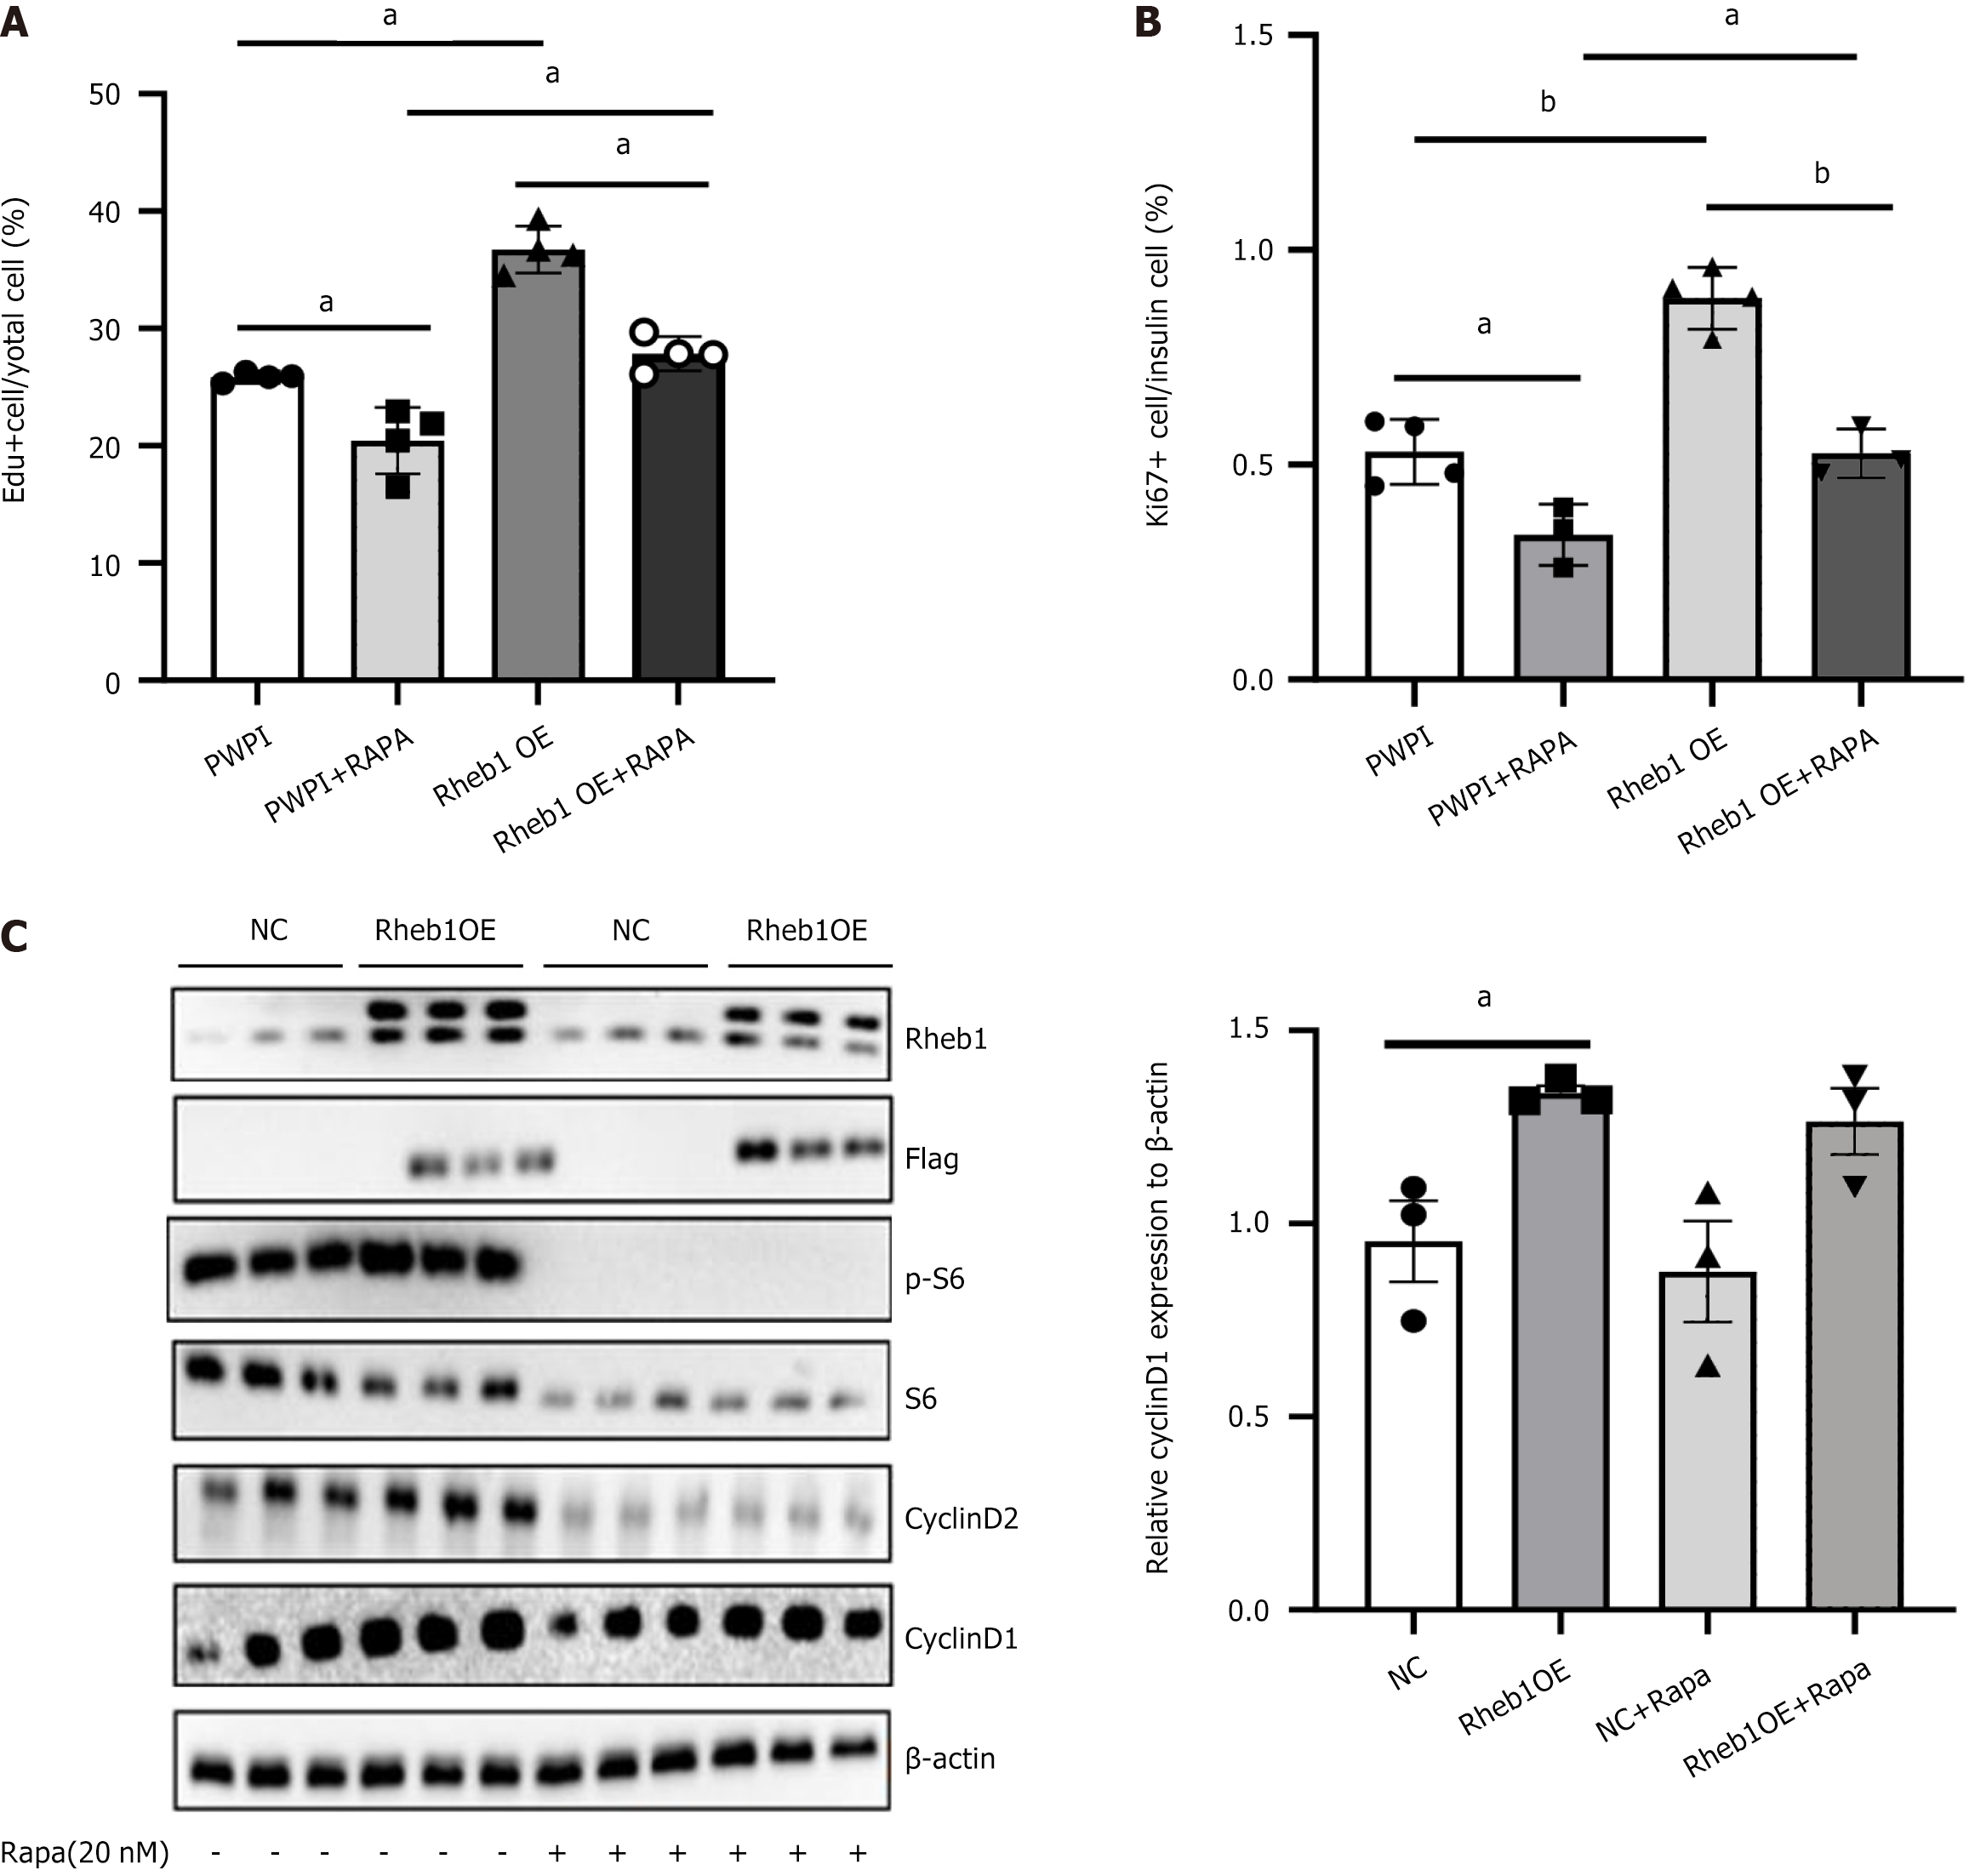
Rapamycin, the inhibitor of mTORC1, were treated on MIN6 cells or the C57 mice islets to figure out whether mTORC1 signaling mainly mediated the Rheb1 effect on β-cell proliferation. Surprisingly, although rapamycin reduced the proliferated ratio, the percentage of Edu+ cell was not totally inhibited upon the rapamycin stimulation in the MIN6 cells (Figure 3A). Consistent with this, the proportion of Ki67+/insulin+ cells in C57 mice islets treated with GFP and Rheb1OE adenovirus also wasn’t totally reduced after rapamycin treatment (Figure 3B). And, we found that rapamycin only reversed the increased protein level of the level of CyclinD2 in the Rheb1 overexpression of the C57 mice islets group (Figure 3C), of which Cyclin D1 was not affected at all during rapamycin treatment (Figure 3C). These results indicated that Rheb1 upregulates β-cell proliferation not only depend on mTORC1 signaling by Cyclin D2, other pathways or regulators may also participate this process.
Figure 3 Rheb1 promotes β cell proliferation only partly depend on the mTORC1.
A: The population of 5-ethy-nyl-2’-deoxyuridine + cells of MIN6 cells treated with PWPI or Rheb1OE lentivirus with or without rapamycin treatment; B: The population of Ki67+ cells of insulin+ islet treated with GFP or Rheb1OE adenovirus with or without rapamycin treatment; C: Western blot analysis of C57 mice islets treated with GFP or Rheb1OE adenovirus for 48 hours with or without rapamycin treatment (n = 3/group). All data are represented as the mean ± SD, aP < 0.05, bP < 0.001. NC: Negative control; Edu: 5-ethy-nyl-2’-deoxyuridine.
AMPK and mTORC1 signaling participate jointly in the β cell proliferation
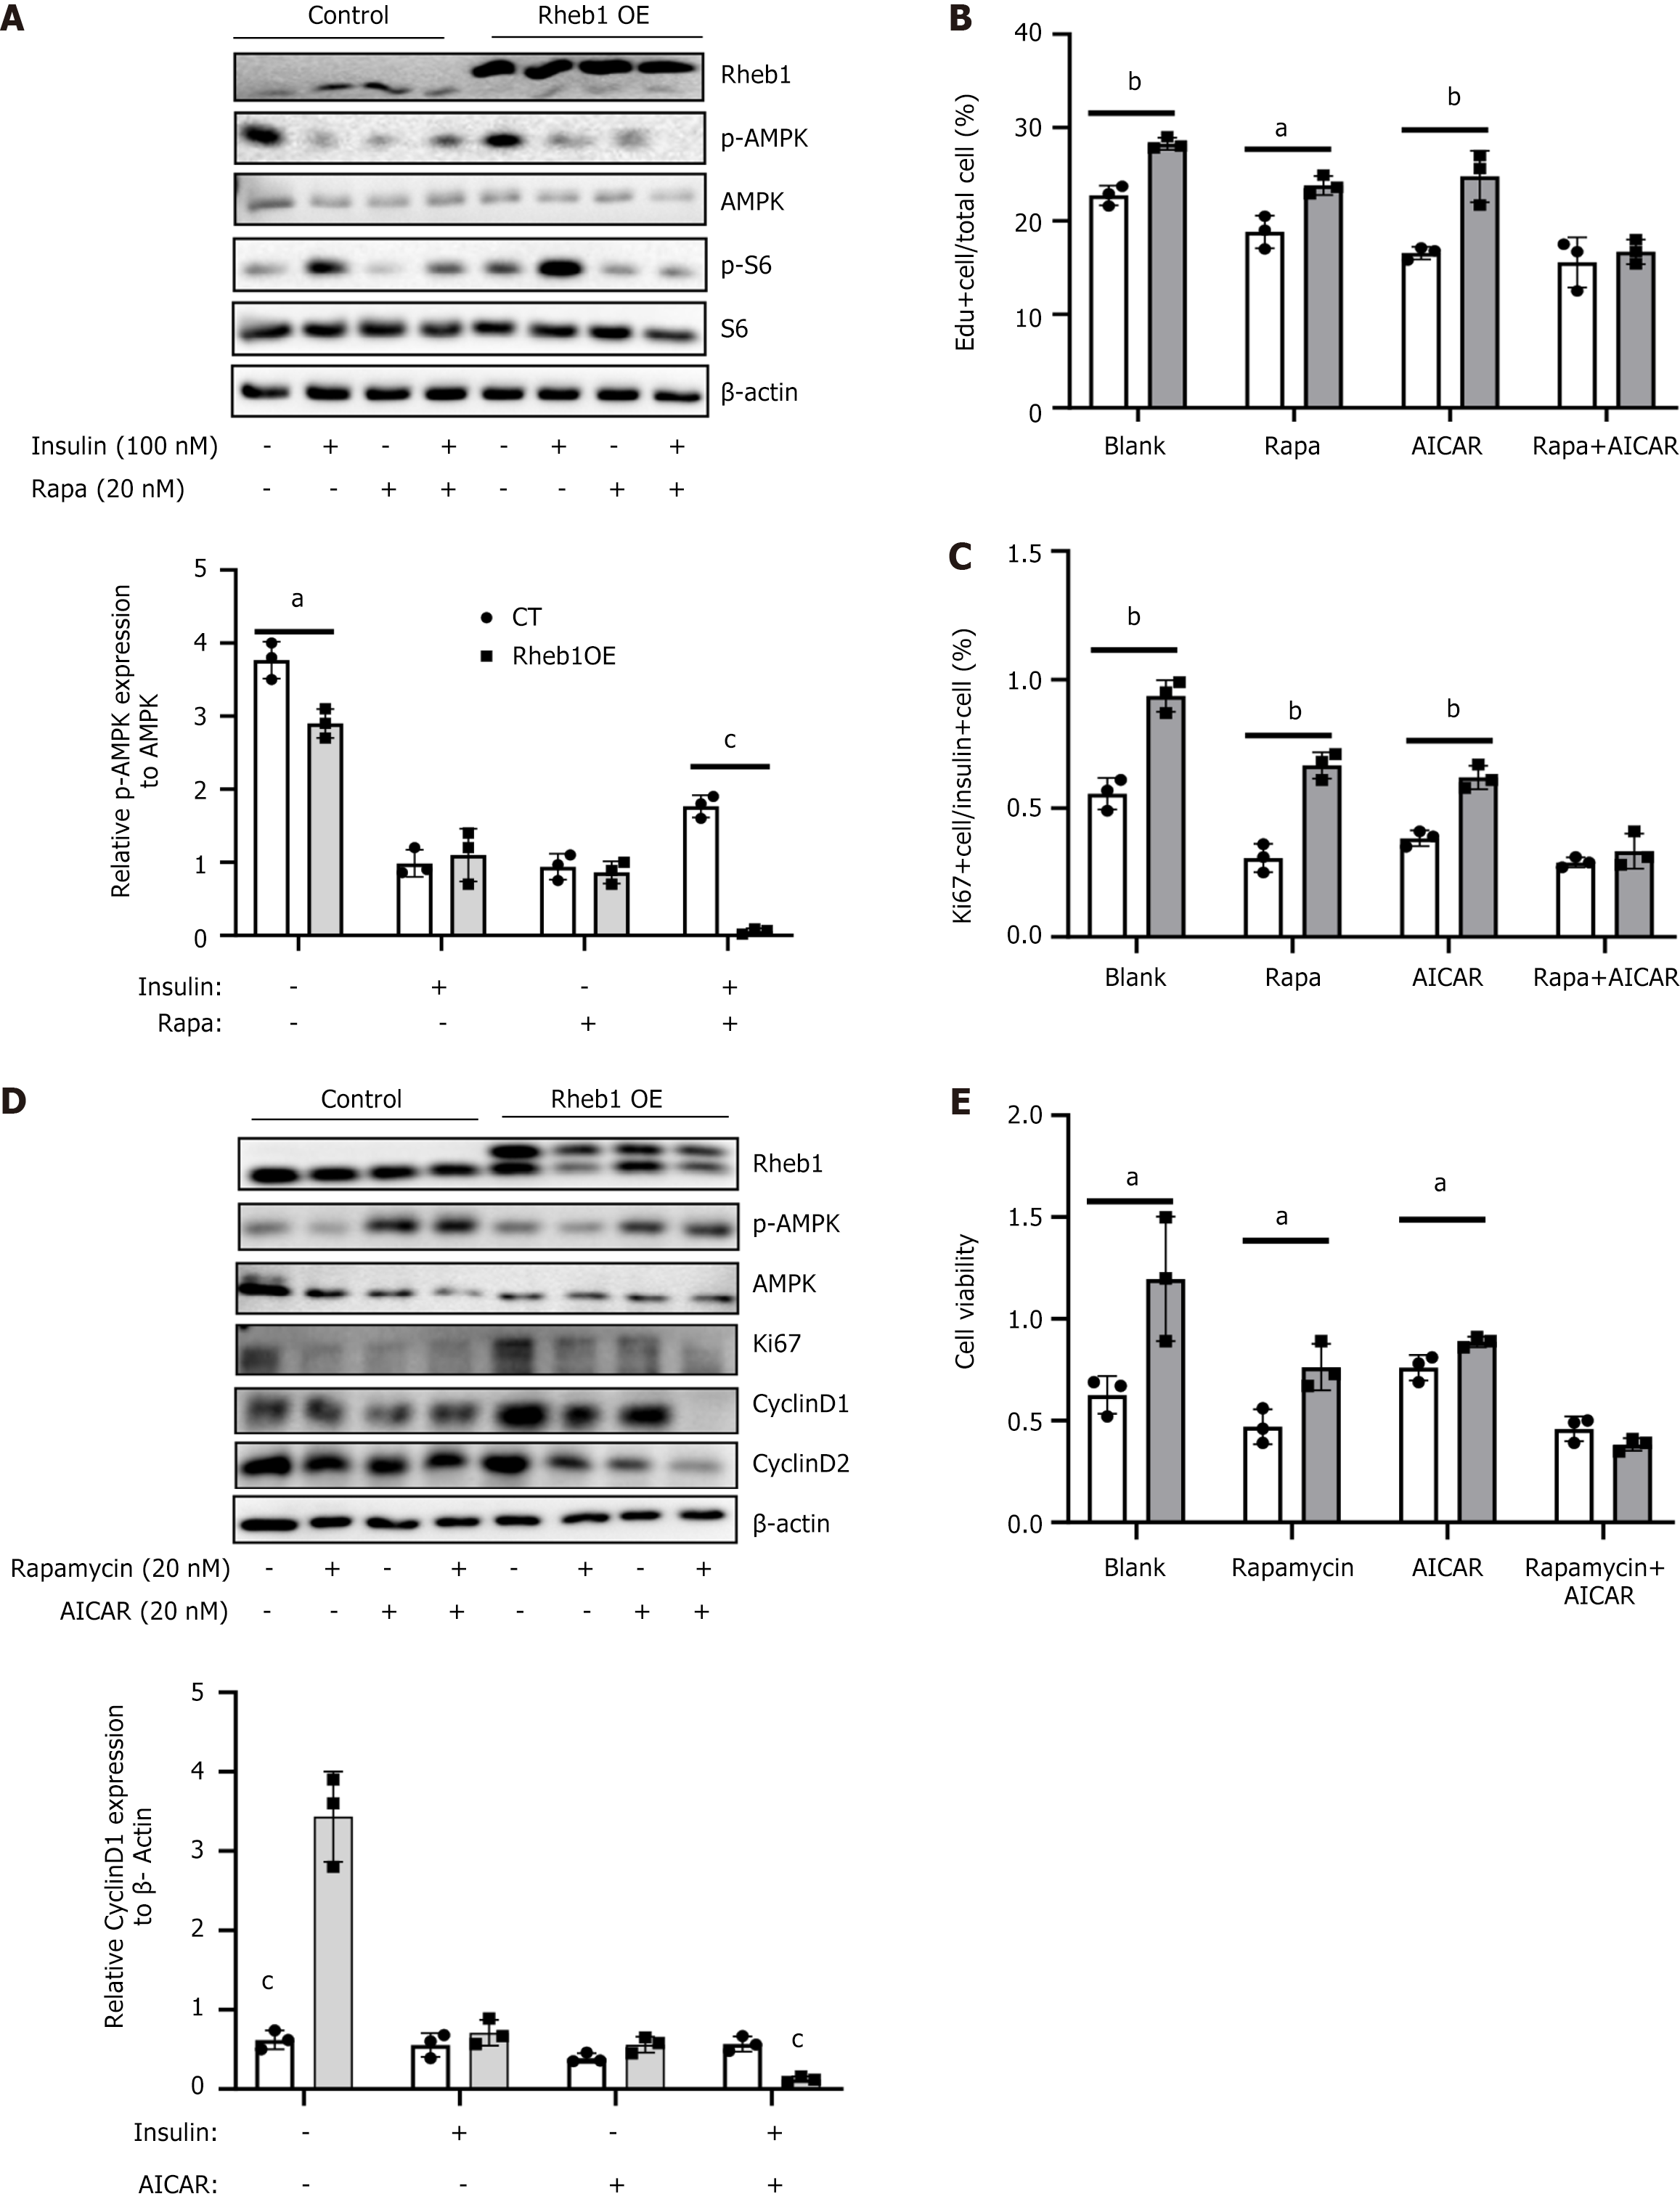
Apart from mTORC1 signaling, Rheb1 was also the important regulator for several vital pathways including Wnt, AMPK and Notch pathways. Among these pathways, as AMPK signaling and mTORC1 were opposing pathways regulating cell growth and nutrient sensing[8], we therefore further examined whether AMPK also participate the role of Rheb1 in β-cell proliferation. Upon the insulin and rapamycin, P-AMPK were significantly inhibited by the Rheb1 overexpression (Figure 4A), suggesting that Rheb1 could promotes mTORC1 signaling activation and inhibit AMPK signaling simultaneously in MIN6 cell. Moreover, only by treating AICAR (an AMPK activator) and rapamycin together could block β-cell proliferation ratio (Figure 4B), proliferated markers (Figure 4C and D) and cell vitality (Figure 4E) which had been enhanced by Rheb1 overexpression. Neither AICAR nor rapamycin could fully inhibit the cell proliferation (Figure 4B-E). AICAR plus rapamycin treatment could inhibit almost all the proliferation marker including Cyclin D1 and Cyclin D2 which has been enhanced by Rheb1 overexpression (Figure 4D). These results demonstrated that Rheb1 influence β-cell proliferation via both AMPK and mTORC1 signaling.
Figure 4 Rheb1 regulates β cell proliferation via mTORC1 and AMPK signaling simultaneously.
A: The expression of AMPK signaling and its downstream in the MIN6 cell treated with GFP or Rheb1OE adenovirus for 48 hours with or without rapamycin treatment; B: The population of 5-ethy-nyl-2’-deoxyuridine + cells of MIN6 cell treated with GFP or Rheb1OE adenovirus for 48 hours with or without rapamycin and AICAR treatment; C: The population of Ki67+ cells of insulin+ islet treated with GFP or Rheb1OE adenovirus with or without rapamycin and AICAR treatment; D: Western blot analysis of MIN6 cell treated with GFP or Rheb1OE adenovirus for 48 hours with or without rapamycin and AICAR treatment; E: Cell vitality analysis of MIN6 cell treated with GFP or Rheb1OE adenovirus for 48 hours with or without rapamycin and AICAR treatment. All data are represented as the mean ± SD, aP < 0.05, bP < 0.01, cP < 0.001.
Rheb1 maintains β-cell identity balance through mTORC1 and Notch1 signaling
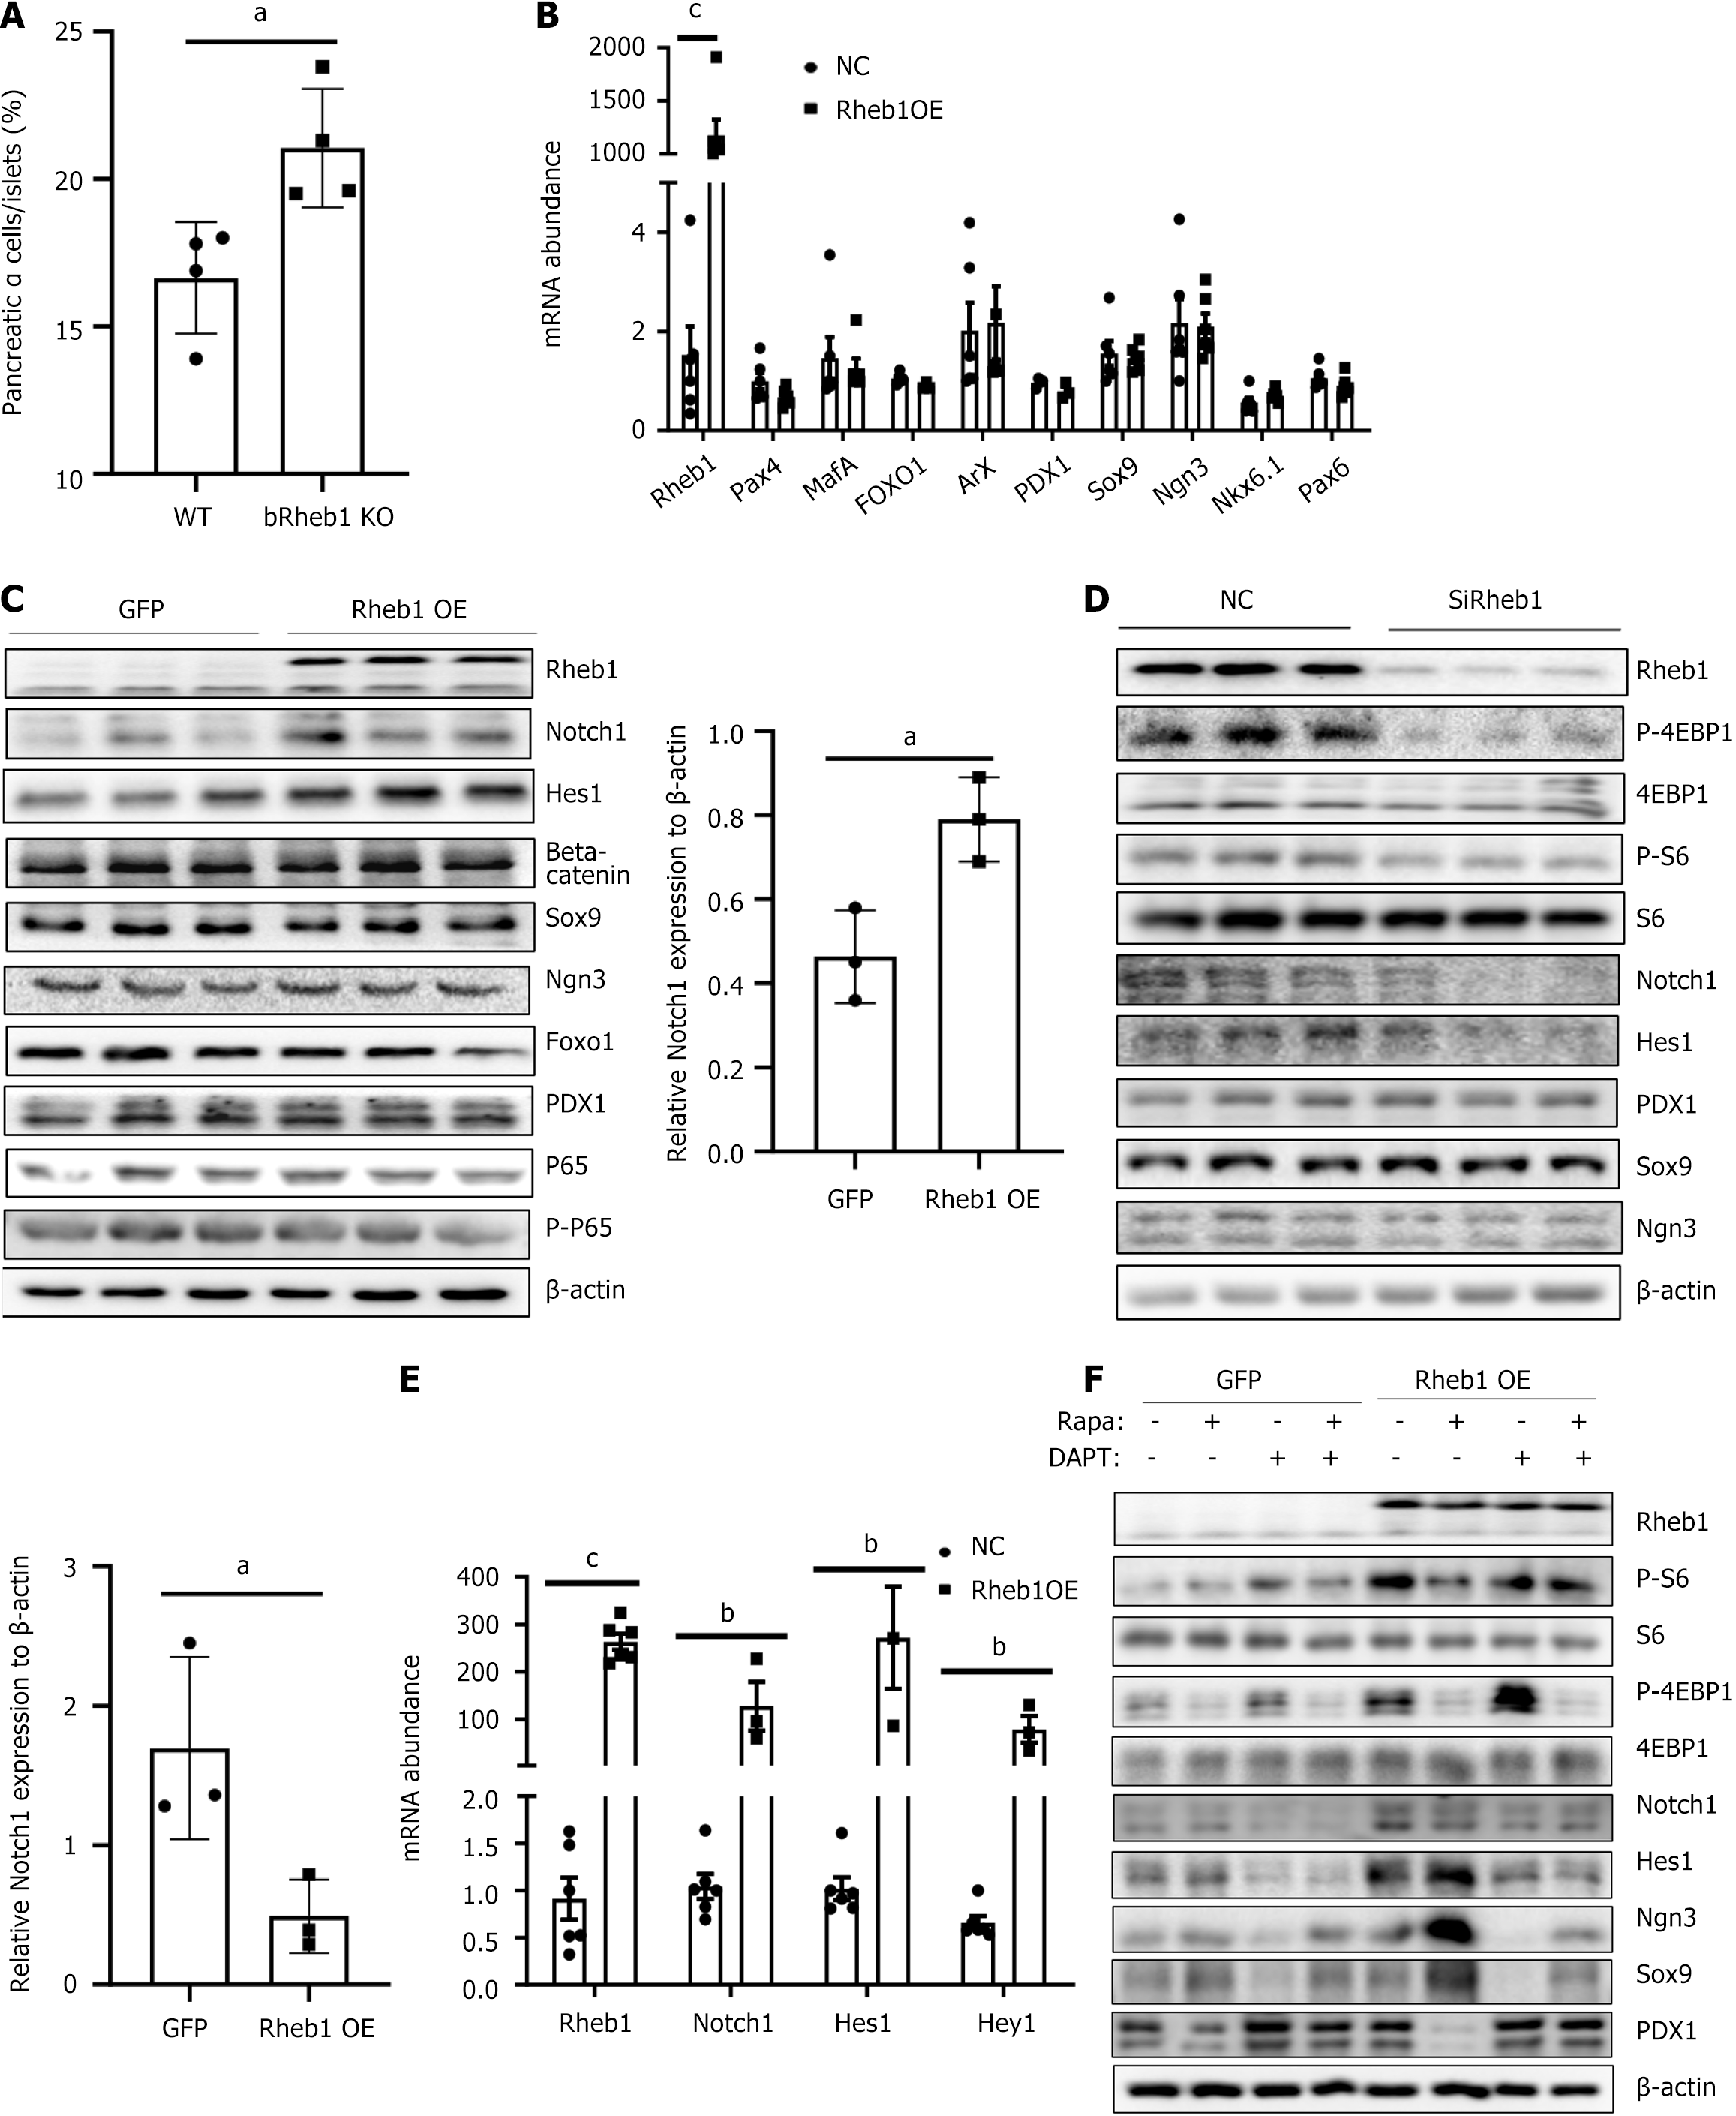
Increased percentage of α cells was appeared in bRheb1KO mice (Figure 5A). Increased α cells proportion in bRheb1KO mice were demonstrated by the percentage of glucagon-stained positive of islets. It is unknown whether Rheb1 may regulate β-cell identity by β cell dedifferentiation and transdifferentiation. Recently, mTORC1 has been demonstrated to play a major role in the maintenance of β-cell identity[14]. To determine whether Rheb1 affects β-cell identity through mTORC1 signaling, we investigated β-cell dedifferentiation in Rheb1-overexpressed or -deficient MIN6 cells. Surprisingly, markers of β-cell dedifferentiation including Ngn3, Sox9, PDX1 and Foxo1 were not significantly changed in either Rheb1 knockdown or overexpressed MIN6 cells (Figure 5B-D), indicating Rheb1 may regulate other pathways and thus counteract the effect of mTORC1 signaling on β-cell dedifferentiation. Several dedifferentiation-related pathways such as Notch1[16], Wnt[17] and NF-κB[18] have been reported. However, only Notch1 rather other pathways including Wnt and NF-κB was regulated by the Rheb1 in β cells (Figure 5C-E). Further studies showed that rapamycin increased the expression of precursor makers including Ngn3 and Sox9 in Rheb1 OE MIN6 cells, while DAPT plays the opposite role and reduced Ngn3 and Sox9 expression in Rheb1 OE MIN6 cells (Figure 5F). The above results indicate that Rheb1 keeps β-cell identity may be related with both mTORC1 and Notch1 signaling.
Figure 5 Rheb1 keeps β-cell identity balance through mTORC1 and Notch1 signaling.
A: Average α-cell proportion in pancreatic sections of 2-month-old male bRheb1KO and WT mice subjected to glucagon staining (n = 4/group); B and C: The mRNA (B) and protein (C) levels of β-cell dedifferentiation related markers in MIN6 cell infected with GFP or Rheb1 adenovirus; D: Western blot analysis of MIN6 cell treated with a Rheb1-specific siRNA or a siRNA control for 48 hours; E: The mRNA levels of Notch pathway in MIN6 cells infected with GFP or Rheb1OE adenovirus for 48 hours; F: Western blot analysis of MIN6 cell infected with GFP or Rheb1OE adenovirus, treated with different levels of rapamycin and DAPT. All data are represented as the mean ± SD, aP < 0.05, bP < 0.01, cP < 0.001. NC: Negative control; WT: Wild-type.
Rheb1 positively regulates transcription factor HNF4α in β cells
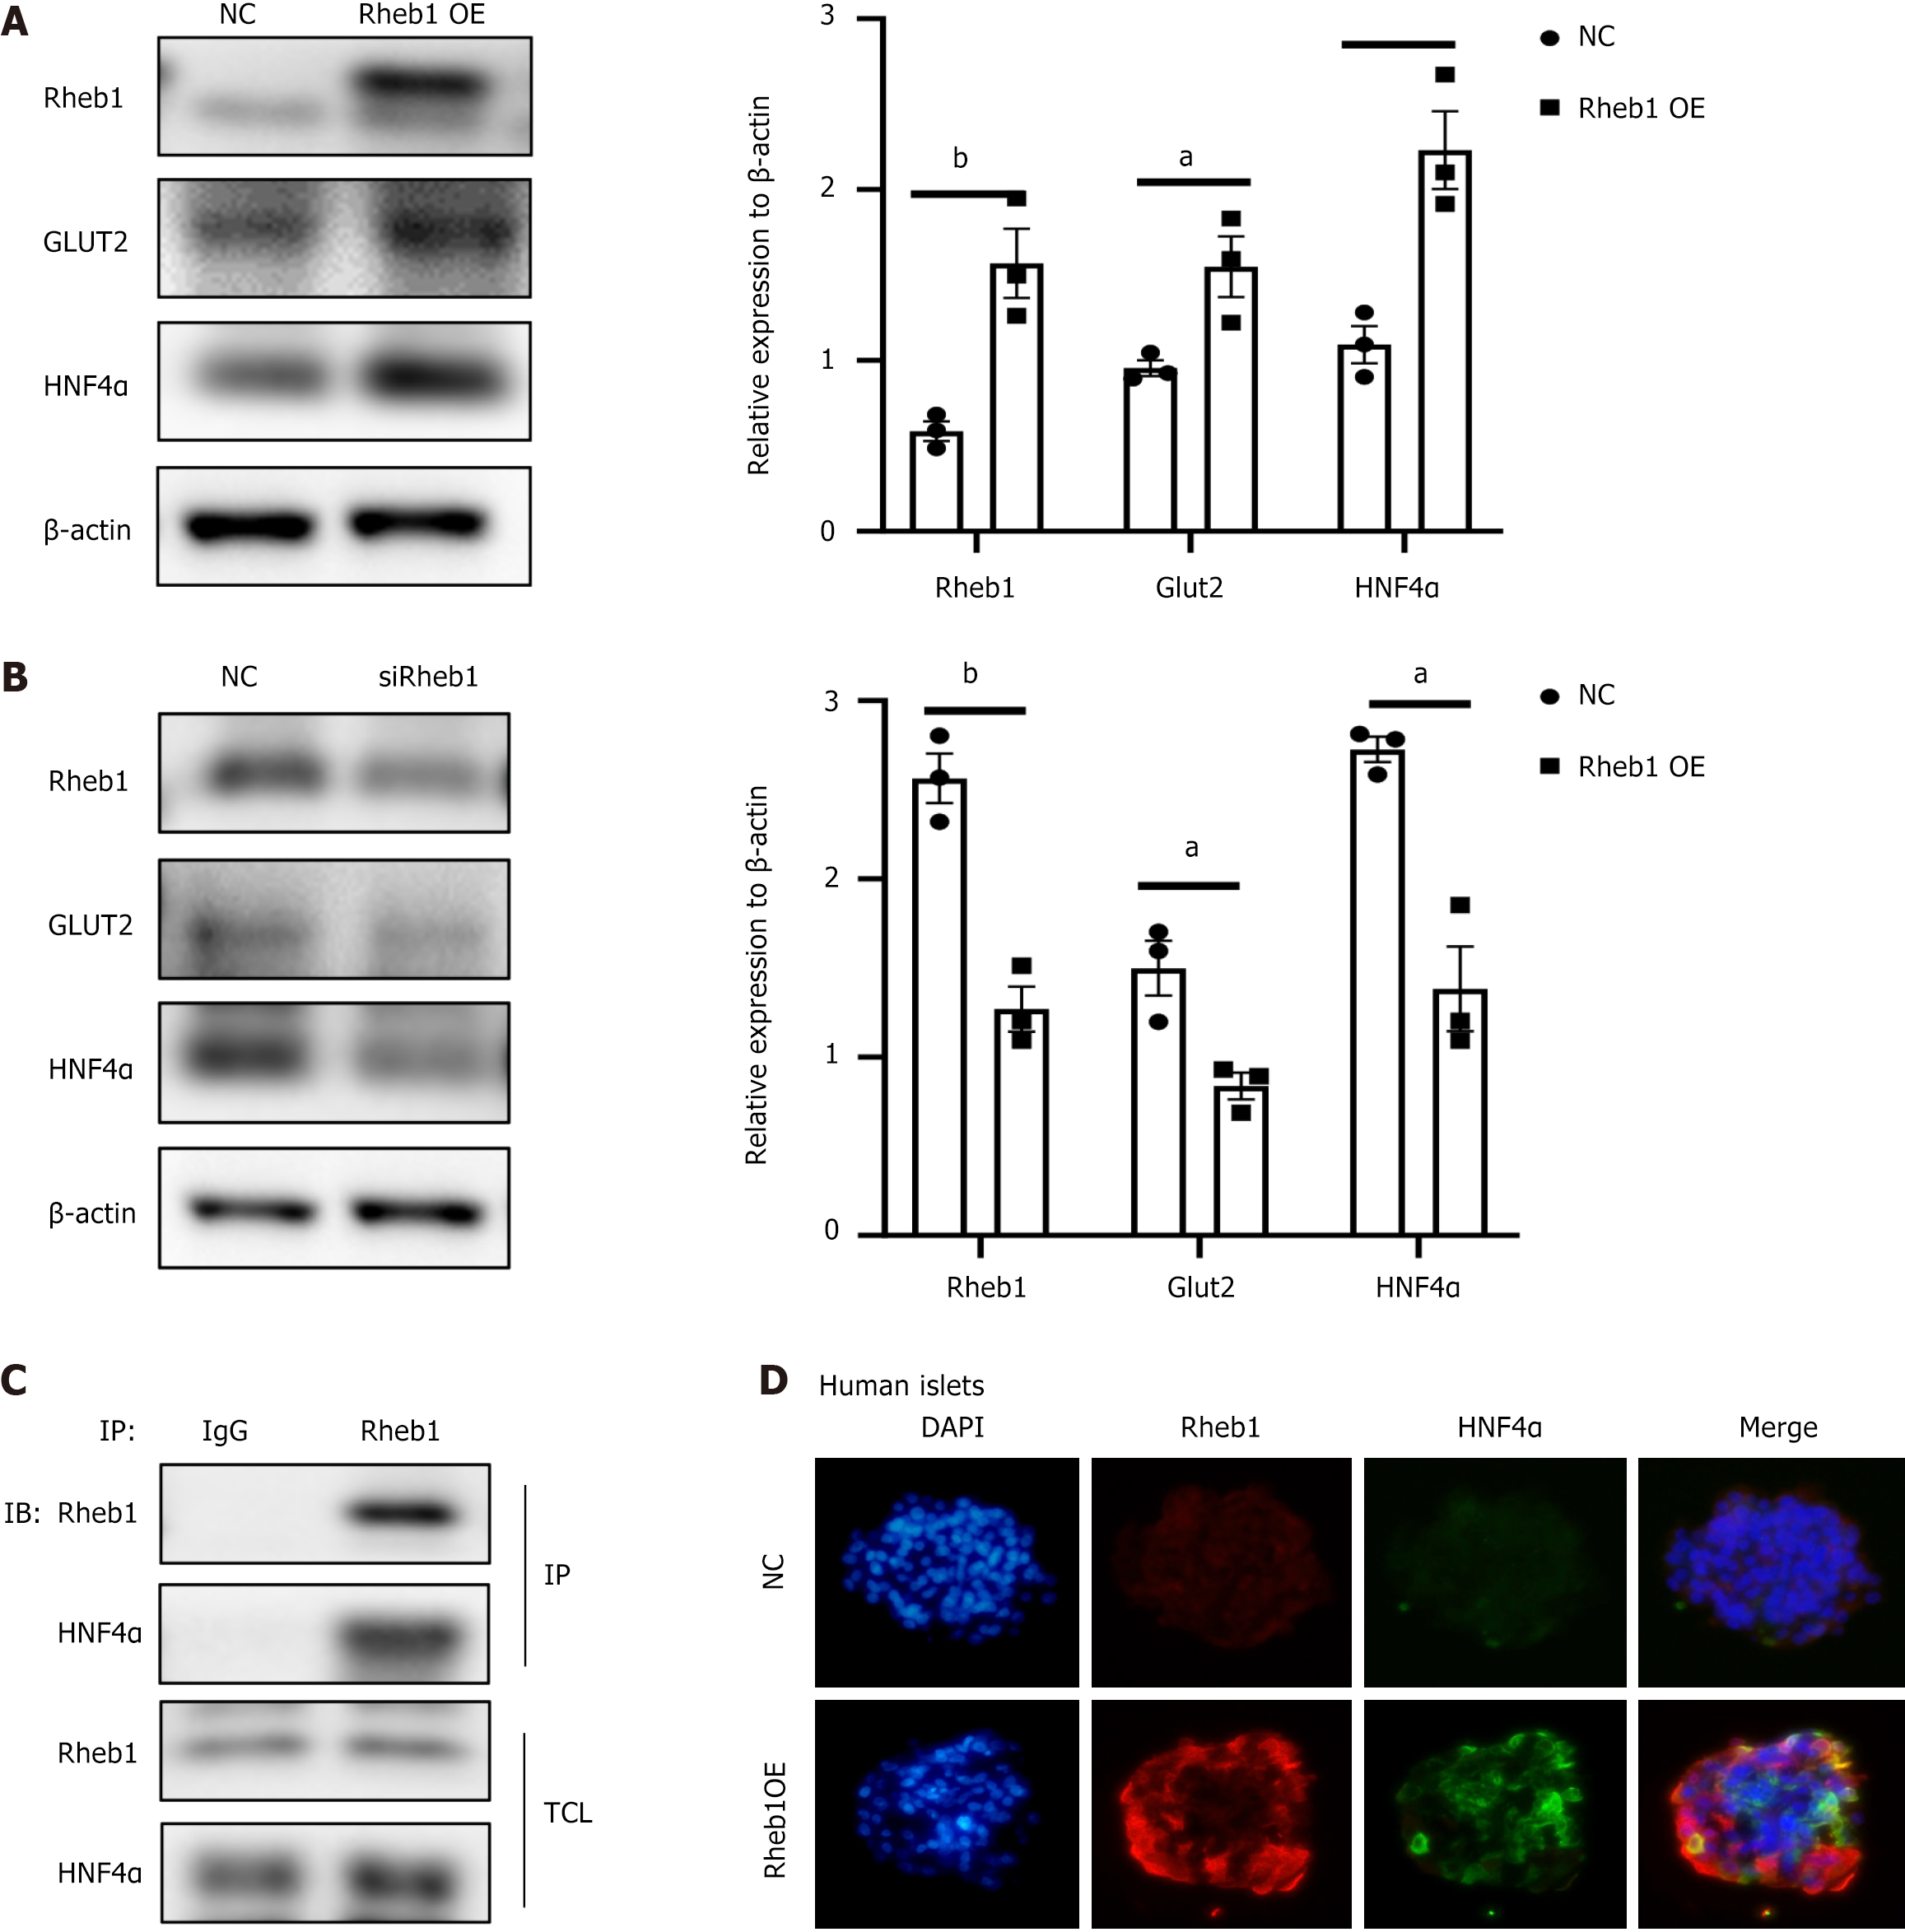
Recent study has engineered and identified 20 genes related with T2DM risk, and found that HNF4α was the most important gene to regulate β-cell development and functionality[19]. Loss of HNF4α in human embryonic stem cell-derived β-like cells significantly affect β-cell development and differentiation[19]. To examine the Rheb1 on β-cell development, we investigated the effect of Rheb1 on HNF4α in MIN6 cells. Overexpression Rheb1 in MIN6 cells greatly increased HNF4α (Figure 6A), knockout of Rheb1 decreased HNF4α protein level (Figure 6B). We further determine the interaction between Rheb1 and HNF4α by co-IP test, of which results demonstrated that Rheb1 interacted physically with HNF4α (Figure 6C). To figure out the effect of Rheb1 on HNF4α in human islets, Rheb1 adenovirus was used to overexpressed Rheb1 in human islets and we found that the level of HNF4α was following increased in the human islets (Figure 6D). Therefore, Rheb1 may be a significant mediator for HNF4α and β-cell development and functionality.
Figure 6 Rheb1 regulates transcription factor HNF4α.
A: Protein expression level of HNF4α was increased in Rheb1 overexpressed MIN6 cells (n = 3); B: Protein expression level of HNF4α was decreased in Rheb1 knockout MIN6 cells; C: The interaction between Rheb1 and HNF4α were analyzed by co-IP in MIN6 cells; D: After overexpression Rheb1 in human islets for 48 hours, immunofluorescence staining of Rheb1 and HNF4α in human islets. All data are represented as the mean ± SD, aP < 0.05, bP < 0.01. NC: Negative control.
DISCUSSION
Diabetes was characterized with β cell dysfunction and insufficient insulin content, the mechanism of which is deterioration in β cell function and reduction of β cell mass[20]. Under pathophysiological condition, β cell proliferation and differentiation would increase to meet the augment demands[21,22]. Original Rheb1, the upstream stimulator of mTOR signaling, activates mTOR signaling to promote protein synthesis and cell growth[23]. There are evidences showing that mTOR signaling pathway plays a crucial role in the regulation of β cell proliferation, mass and insulin production[24,25]. Our results showed that disruption of Rheb1 in the pancreas reduce the proliferation of β cell and Cyclin D1 and D2 were all decreased. Surprisingly, Rapamycin alone could not fully block Rheb1 O/E induced cell proliferation (Figure 3A), only combined with AICAR could totally reversed the Rheb1 induced proliferation ratio (Figure 4B) or marker (Figure 3C and D).
In contrast to the role of another key sensor of the mTORC1 complex, AMPK, the sensor of adenine nucleotides, is activated when intracellular ATP is in low energy states[9]. AMPK plays a significant role in cell growth, autophagy, and cell polarity by regulating growth and reprogramming metabolism[26]. AMPK function has been broadly studied in metabolic tissues including liver, adipose tissue and muscle[27,28], while its physiological function in β cells is relatively understudied[29]. The loss of LKB1-AMPK axis in mice showed impaired β-cell function and glucose homeostasis[30,31], yet no direct evidence for β cell proliferation. Moreover, it is still unknown whether Rheb1 is the upstream of AMPK in the pancreatic β cells. For tumorigenesis, Rheb1 could activate AMPK signaling to regulate tumor proliferation via mTORC1-independent mechanisms[32]. Unlike the role in the tumorigenesis, our study first showed that Rheb1 could inhibit the level of AMPK signaling in islets and pancreatic β cells (Figure 4A and C). Moreover, treatment of AICAR (the activator of AMPK signaling) could reversed the Rheb1-induced proliferation (Figure 4B and D), indicating that Rheb1 would regulate β-cell proliferation via both AMPK and mTORC1 signaling and Rheb1 may be a better target for promoting β-cell proliferation and mass. The relationships between Rheb1 and mTORC1 signaling, AMPK and Notch1 signaling are delicate and complex. Rheb1 is a direct activator of mTORC1. In its GTP-bound form, Rheb1 directly interacts with and activates mTORC1, which is crucial for cell growth, protein synthesis, and metabolism. The activity of Rheb1 is negatively regulated by the TSC1/2 complex, which acts as a GAP for Rheb1, converting it from its active GTP-bound state to its inactive GDP-bound state, thus inhibiting mTORC1 signaling[33]. When cellular energy levels are low (high AMP/ATP ratio), AMPK is activated and phosphorylates TSC2, enhancing its GAP activity, which in turn inhibits Rheb1 and mTORC1[32]. Rheb1 also interacts with the Notch signaling pathway, which is critical for cell fate determination and differentiation. While the direct molecular interactions between Rheb1 and Notch signaling are less well-characterized, some studies suggest that Rheb1 can influence Notch signaling, potentially through the modulation of mTORC1 activity[34]. Recent study also showed that inhibition of the mTORC1 pathway could suppress the growth of Notch1-activated human biliary cancer cells[35], while none of results were conducted in pancreatic β cells. Therefore, Rheb1 may integrate and switch the activation of mTORC1 signaling, AMPK and Notch signaling mainly through the TSC-mTORC1, while more studies in β-cell field are needed to figure out.
Our results demonstrated that Rheb1 can directly interacted with HNF4α, which is an important mediator for β-cell development and differentiation[36,37]. Mutation in HNF4α in human also leads to the rare subtype T2DM-MODY1, characterized by usually early onset in childhood and adolescence and β-cell dysfunction rather than insulin resistance[38], which is consistent with the phenotype of our pRheb1KO and bRheb1 mice. Considering the significant effect of Rheb1 on HNF4α, we speculated that Rheb1 may also influence β-cell development by HNF4α regulation. However, more studies are needed to examine the role of Rheb1 on β-cell development and differentiation, or β-cell replication in the future. Moreover, proximity Ligation Assay (PLA) is a powerful technique to visualize protein-protein interactions at a single-molecule level within cells. Further PLA analysis should be conducted to further confirm the interaction between Rheb1 and HNF4α. Direct research connecting Rheb1 or mTOR with HNF4α in metabolic diseases or diabetes is not well-documented in available literature. Our study found that Rheb1 could directly interact with HNF4α. AMPK, an energy sensor, can influence the transcriptional activity of HNF4α, especially under metabolic stress conditions[39,40]. Notch1 and HNF4α were crucial organ development in regulating hepatoblasts differentiated into hepatocytes or intrahepatic biliary epithelial cells[41]. With respect to liver development, Notch1 directed the progenitor hepatoblasts cells into BFC while HNF4α specify hepatocytes. Our results found that Rheb1 could upregulated Notch1 and interacted with HNF4α in β cells, but the connection between Notch1 and HNF4α remains unclear as yet and need more valuable investigation in the future. Therefore, the interaction between HNF4α and mTOR, AMPK, Notch1 signaling may be the research direction of the influence of Rheb1 on the β cell activity and function in mice.
The mTORC1 signaling pathway has been shown to play a major role in the maintenance of β-cell identity and inhibition of β-cells transdifferentiated into α-cells under hyperglycemia[14]. Surprisingly, we found that β-cell-specific deleting Rheb1 does not affect β-cell identity (Figure 5). We therefore examined whether Rheb1 also effect other β-cell dedifferentiation associated pathways such as Notch1[16], Wnt[17] and NF-κB[18] pathway. Interestingly, we found that Rheb1 regulates Notch1 pathway in pancreatic β-cells, which is known to have a mutual restrictive effect with mTORC1 signaling pathway in β-cell dedifferentiation (Figure 5). However, the remained Wnt and NF-κB signaling showed no reaction upon Rheb1 activation (Figure 5). These findings suggest the role of Rheb1 on β-cell identity may depend on the outcome of different cellular signaling pathway interactions. Rheb1 was demonstrated to related with Wnt signaling in Gene set enrichment analysis of the progression of pancreatic adenocarcinoma[42], and Rheb1 tend to be essential for NF-κB signaling activation in HEK 293T cells[43]. Our study showed different results that Rheb1 has no effect on Wnt and NF-κB signaling in pancreatic β cells, which may be due to tissue specificity. And the increased population of α cell mass was observed in bRheb1KO mice (Figure 5A). Specifically, hyperglycemia is known to promote the proliferation of pancreatic α cells and its produced glucagon contents, which often companied with decreased pancreatic β cell[44]. Considering the increased α cell mass in our bRheb1KO mice, more investigation should be conducted to rule out the possibility of high glucose regulation on α cell mass.
There are several limitations existed in our study. First, although our study hypotheses that Rheb1 may keep the β-cell identity balance through mTORC1 and Notch1 signaling, these results were conducted from MIN6 cells and the specific results of DAPT inhibitor need more support from other inhibitors avoiding the limitation of the non-specific target. Although the MIN6 cell line is a valuable tool for studying insulin secretion and beta cell function, its use in translational research is limited by species differences, tumorigenic origins, and simplifications of human pancreatic physiology. More evidences of mice and clinical experiments are needed to prove our results. For example, the β-cell lineage tracing models (e.g., Ins1Cre/+; Rosa26-EYFP mice) crossed with bRheb1KO mice would be future direction to further approve the effect of Rheb1 on β-cell identity balance. Additionally, our presented results indicate that Rheb1 or mTORC1 signaling in β-cells improves β-cell function and proliferation. However, in other tissues, Rheb1 and mTORC1 signaling have been found to promote fibroblast activation and contributes to kidney fibrosis, implicated in progressive renal disease[45]. Therefore, the methods to stimulate mTORC1 specifically in β cells would greatly reduce this risk of unwanted mTORC1 signaling in other tissues. However, there have no specific method to specifically active mTORC1 in β cells up to now. SAD-A, one of AMPK-related family kinases, which only expressed in pancreas and brain, could be a unique mediator of mTORC1 signaling in islet β-cells[46]. Loss of SAD-A impaired β-cell size and insulin secretion function in mice[46]. However, the relationship between SAD-A and Rheb1 remain largely unknown and SAD-A also have unique effect on neuronal polarization[47]. Therefore, the method to specially stimulate Rheb1 and mTORC1 in β cells properly still remain large challenge in the future. Last but not least, the long-term effects of Rheb1 have not been observed in our animal study, more long-term researches are needed in future research.


