Copyright
©The Author(s) 2025.
World J Diabetes. Jun 15, 2025; 16(6): 104973
Published online Jun 15, 2025. doi: 10.4239/wjd.v16.i6.104973
Published online Jun 15, 2025. doi: 10.4239/wjd.v16.i6.104973
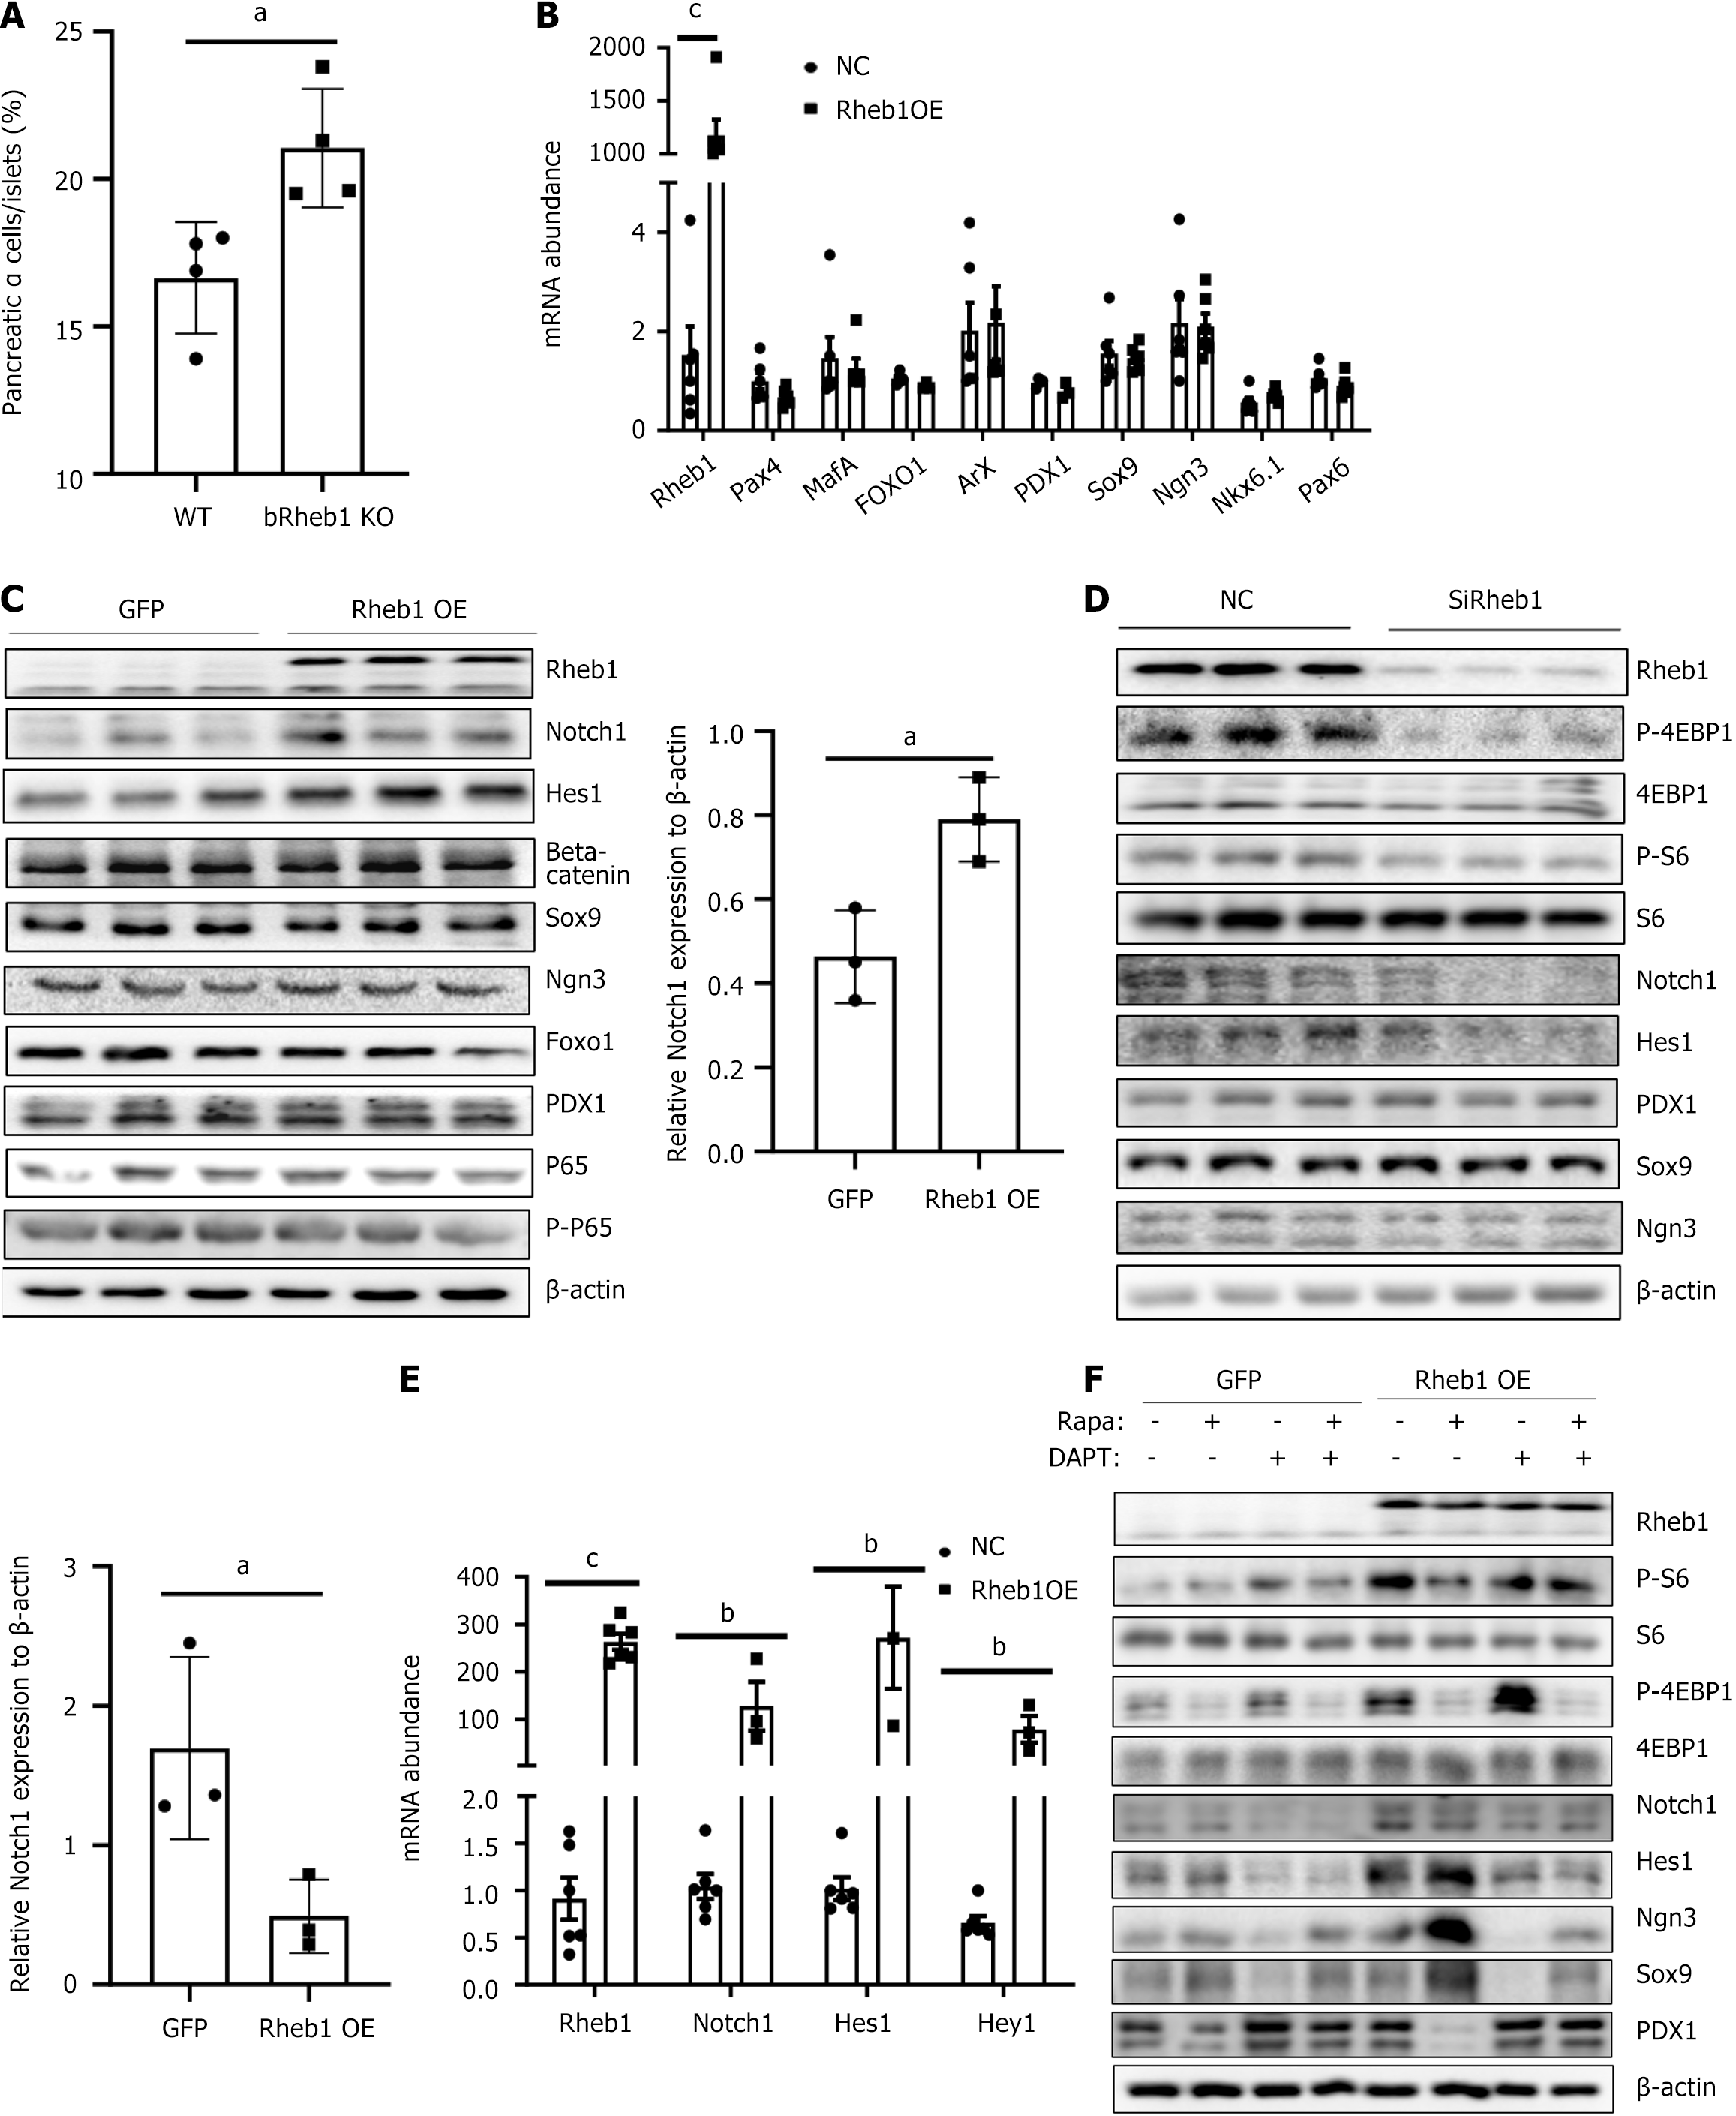
Figure 5 Rheb1 keeps β-cell identity balance through mTORC1 and Notch1 signaling.
A: Average α-cell proportion in pancreatic sections of 2-month-old male bRheb1KO and WT mice subjected to glucagon staining (n = 4/group); B and C: The mRNA (B) and protein (C) levels of β-cell dedifferentiation related markers in MIN6 cell infected with GFP or Rheb1 adenovirus; D: Western blot analysis of MIN6 cell treated with a Rheb1-specific siRNA or a siRNA control for 48 hours; E: The mRNA levels of Notch pathway in MIN6 cells infected with GFP or Rheb1OE adenovirus for 48 hours; F: Western blot analysis of MIN6 cell infected with GFP or Rheb1OE adenovirus, treated with different levels of rapamycin and DAPT. All data are represented as the mean ± SD, aP < 0.05, bP < 0.01, cP < 0.001. NC: Negative control; WT: Wild-type.
- Citation: Yang Y, Song WJ, Zhang JJ. Ras homolog enriched in brain 1 regulates β cell mass and β cell function via mTORC1/AMPK/Notch1 pathways. World J Diabetes 2025; 16(6): 104973
- URL: https://www.wjgnet.com/1948-9358/full/v16/i6/104973.htm
- DOI: https://dx.doi.org/10.4239/wjd.v16.i6.104973


