Copyright
©The Author(s) 2025.
World J Diabetes. Jul 15, 2025; 16(7): 104512
Published online Jul 15, 2025. doi: 10.4239/wjd.v16.i7.104512
Published online Jul 15, 2025. doi: 10.4239/wjd.v16.i7.104512
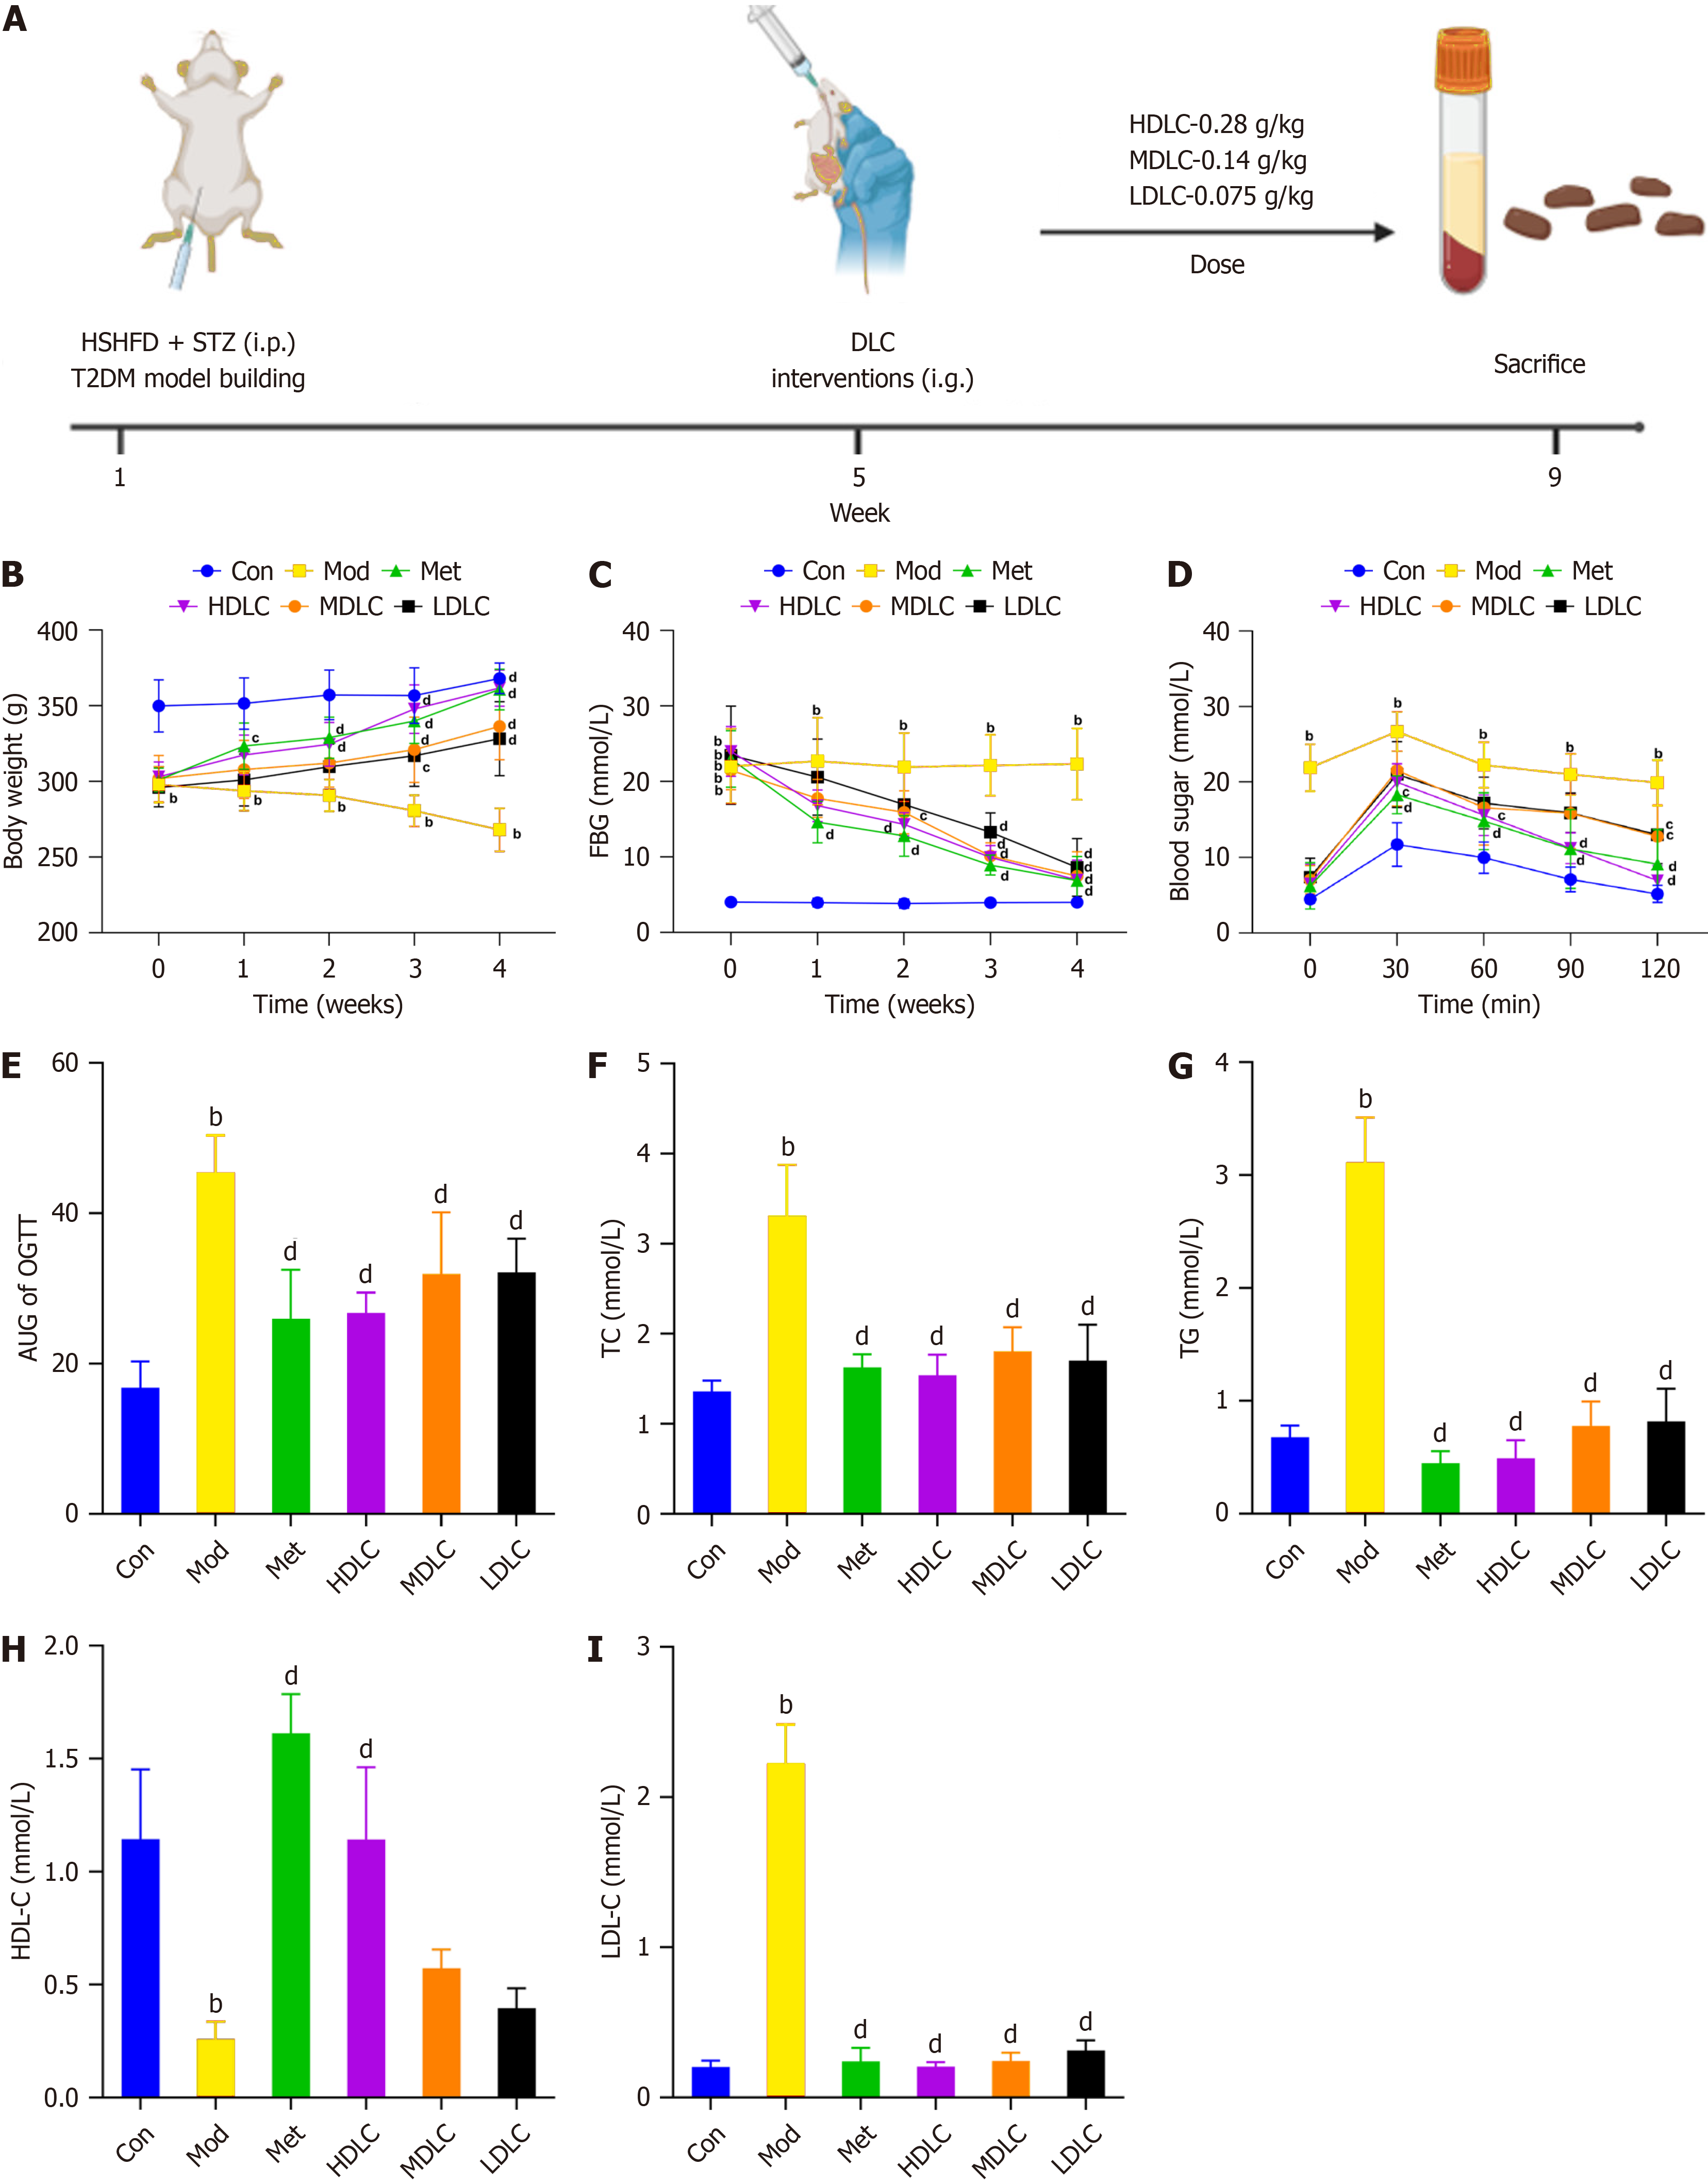
Figure 1 Influence of Dimocarpus longan Lour leaf components on type 2 diabetes mellitus rats.
A: Experimental protocol for the treatment of type 2 diabetes mellitus (T2DM) rats by Dimocarpus longan Lour leaf components (DLC); B: DLC treatment mitigated weight loss in T2DM rats; C: DLC therapy reduced fasting blood glucose levels in T2DM rats; D and E: The area under the curve of oral glucose tolerance test was lowered in T2DM rats following DLC treatment; F-I: Alterations in blood lipids post-DLC therapy. Results were expressed as mean ± SD (n = 6). aP < 0.05 vs the control (Con) group; bP < 0.01 vs the Con group; dP < 0.01 vs the model group. HDL-C: High-density lipoprotein cholesterol; Con: Control group; Mod: The model group; Met: The metformin group; HDLC: The high-dose group; MDLC: The medium-dose group; LDLC: The low-dose group; AUC: Area under the curve; OGTT: Oral glucose tolerance test. Figure 1A created with BioRender.com (Supplementary material).
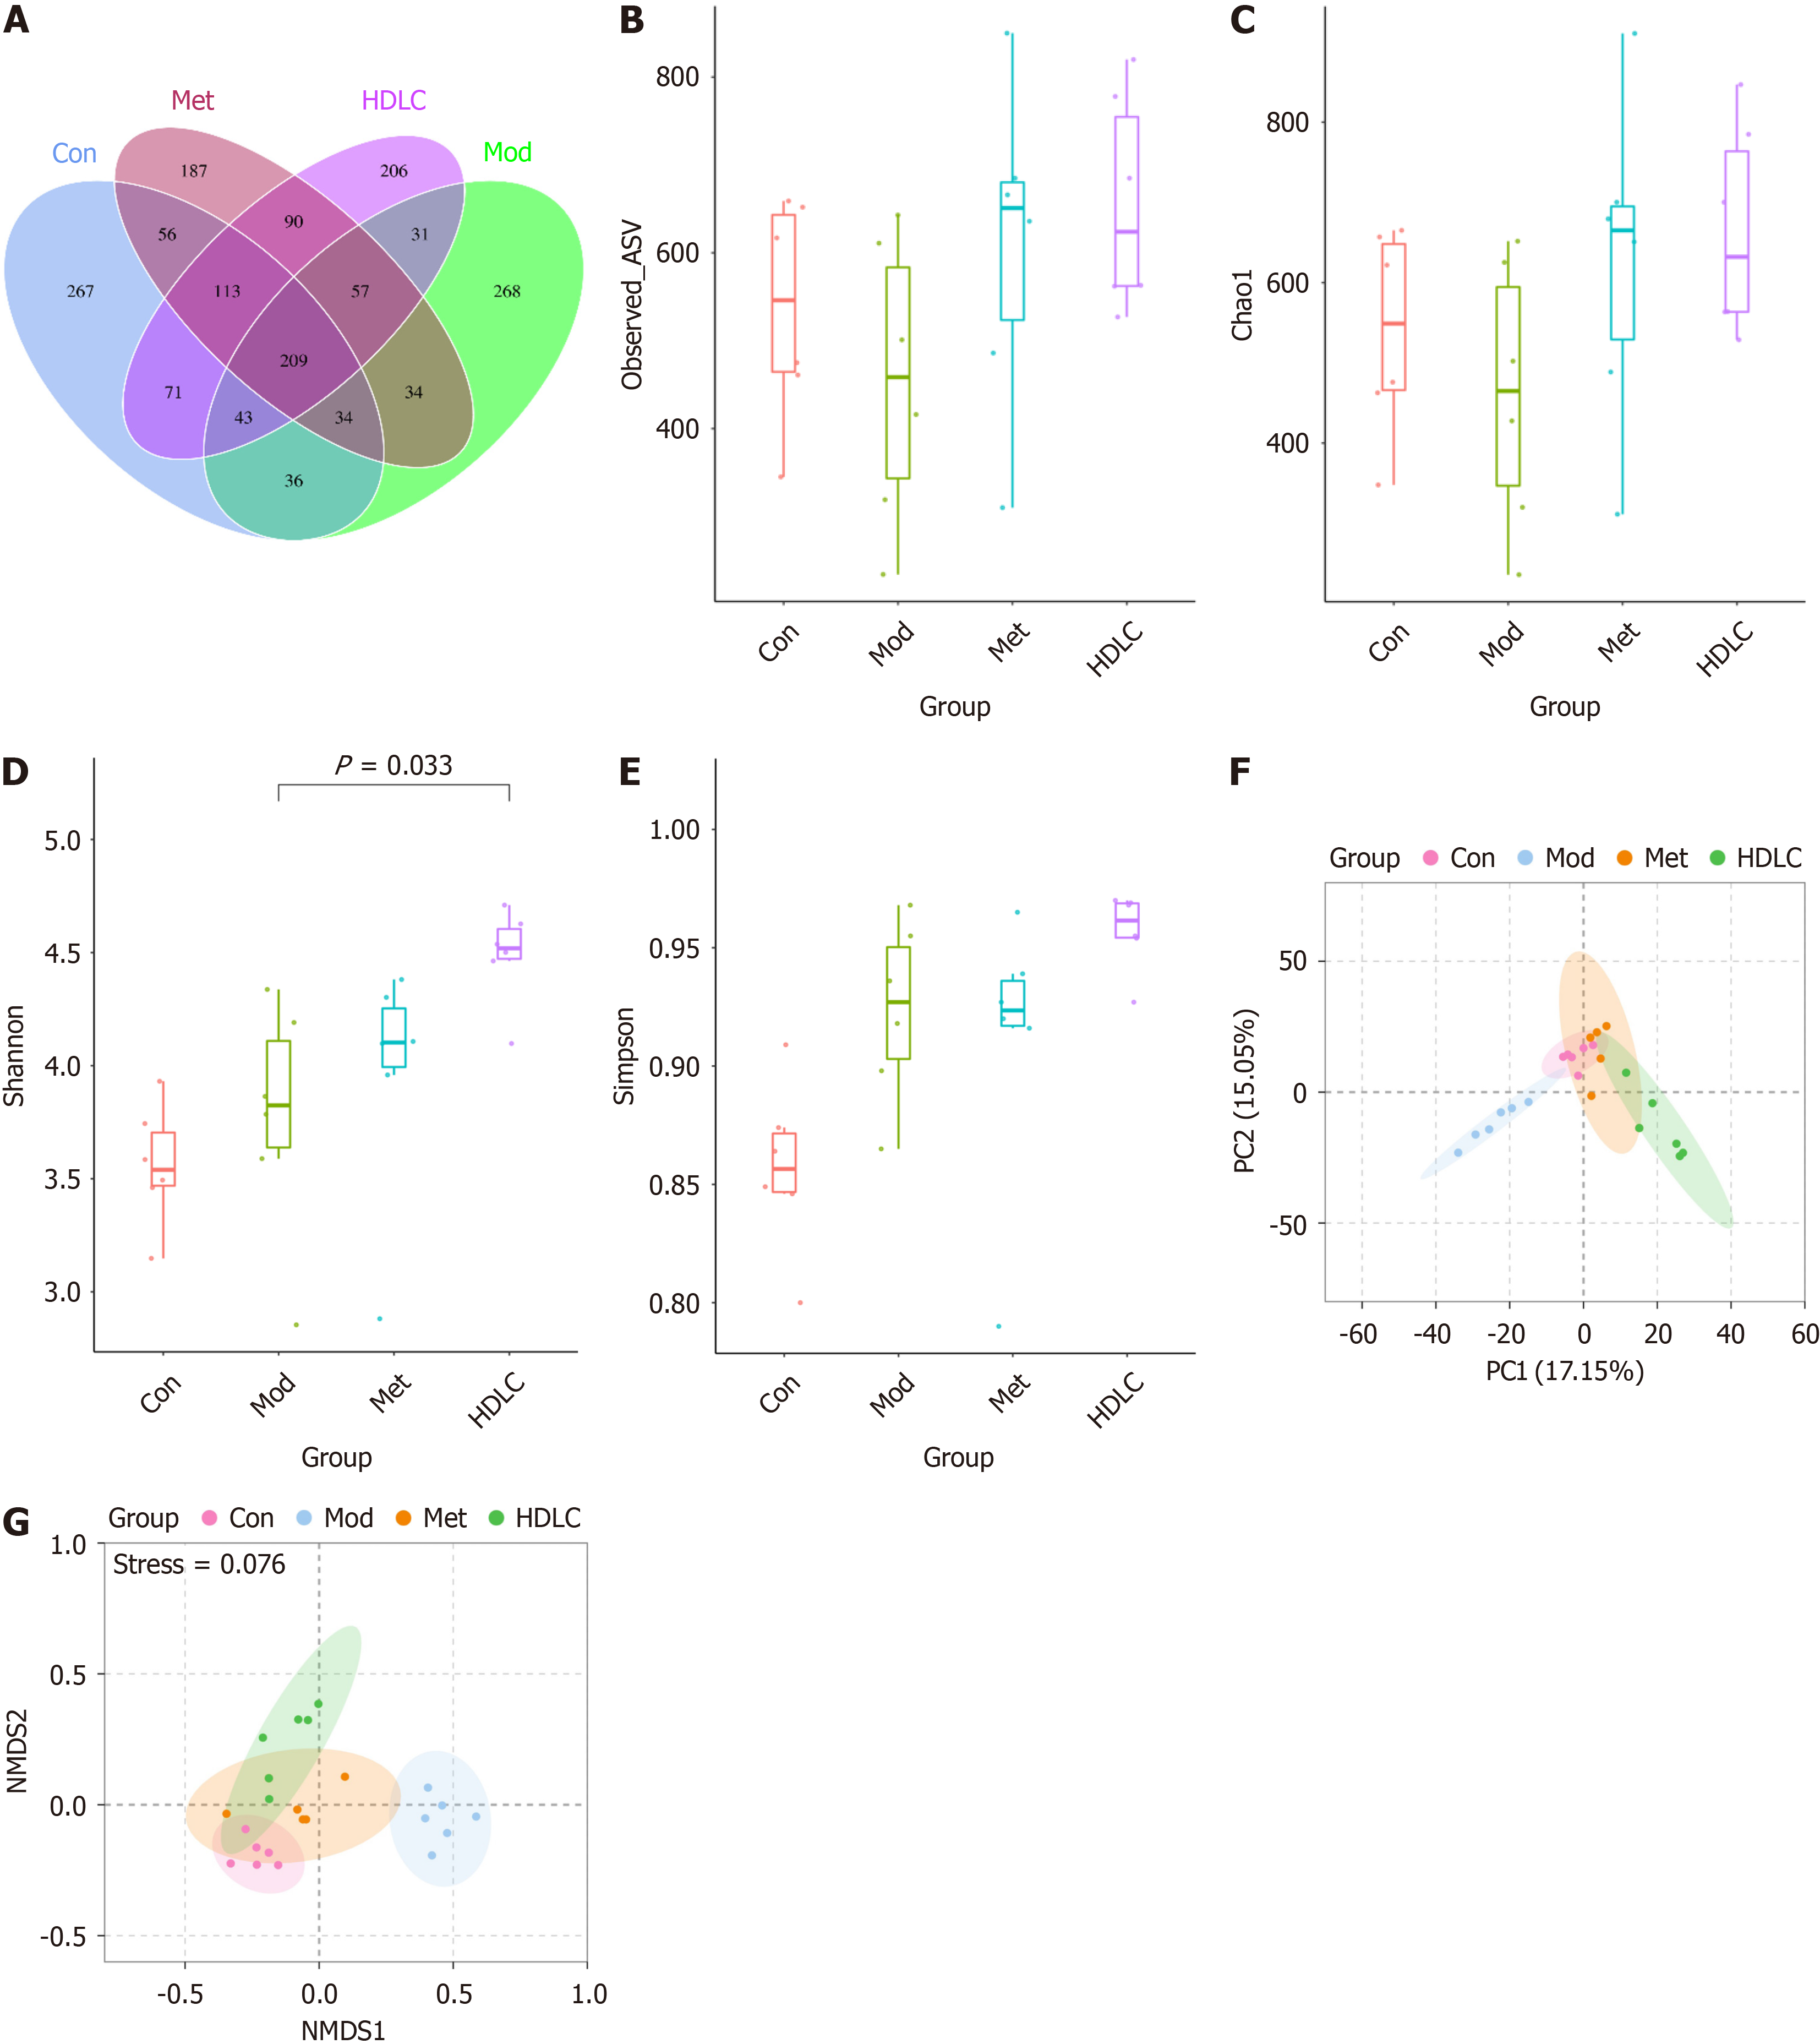
Figure 2 Impact of Dimocarpus longan Lour leaf components on gut microbial diversity in type 2 diabetes mellitus rats.
A: Venn diagram; B: Observed-amplicon sequence variant index; C: Chao1 index; D: Shannon index; E: Simpson index; F: Bray Curtis-based principal component analysis; G: Bray Curtis-based nonparametric multidimensional scaling. Results were expressed as mean ± SD (n = 6). All variations were assessed via one-way ANOVA with Tukey-Kramer post hoc analysis; multiple comparisons were adjusted using the Benjamini–Hochberg false discovery rate method. Con: Control group; Mod: The model group; Met: The metformin group; HDLC: The high-dose group; ASV: Amplicon sequence variant.
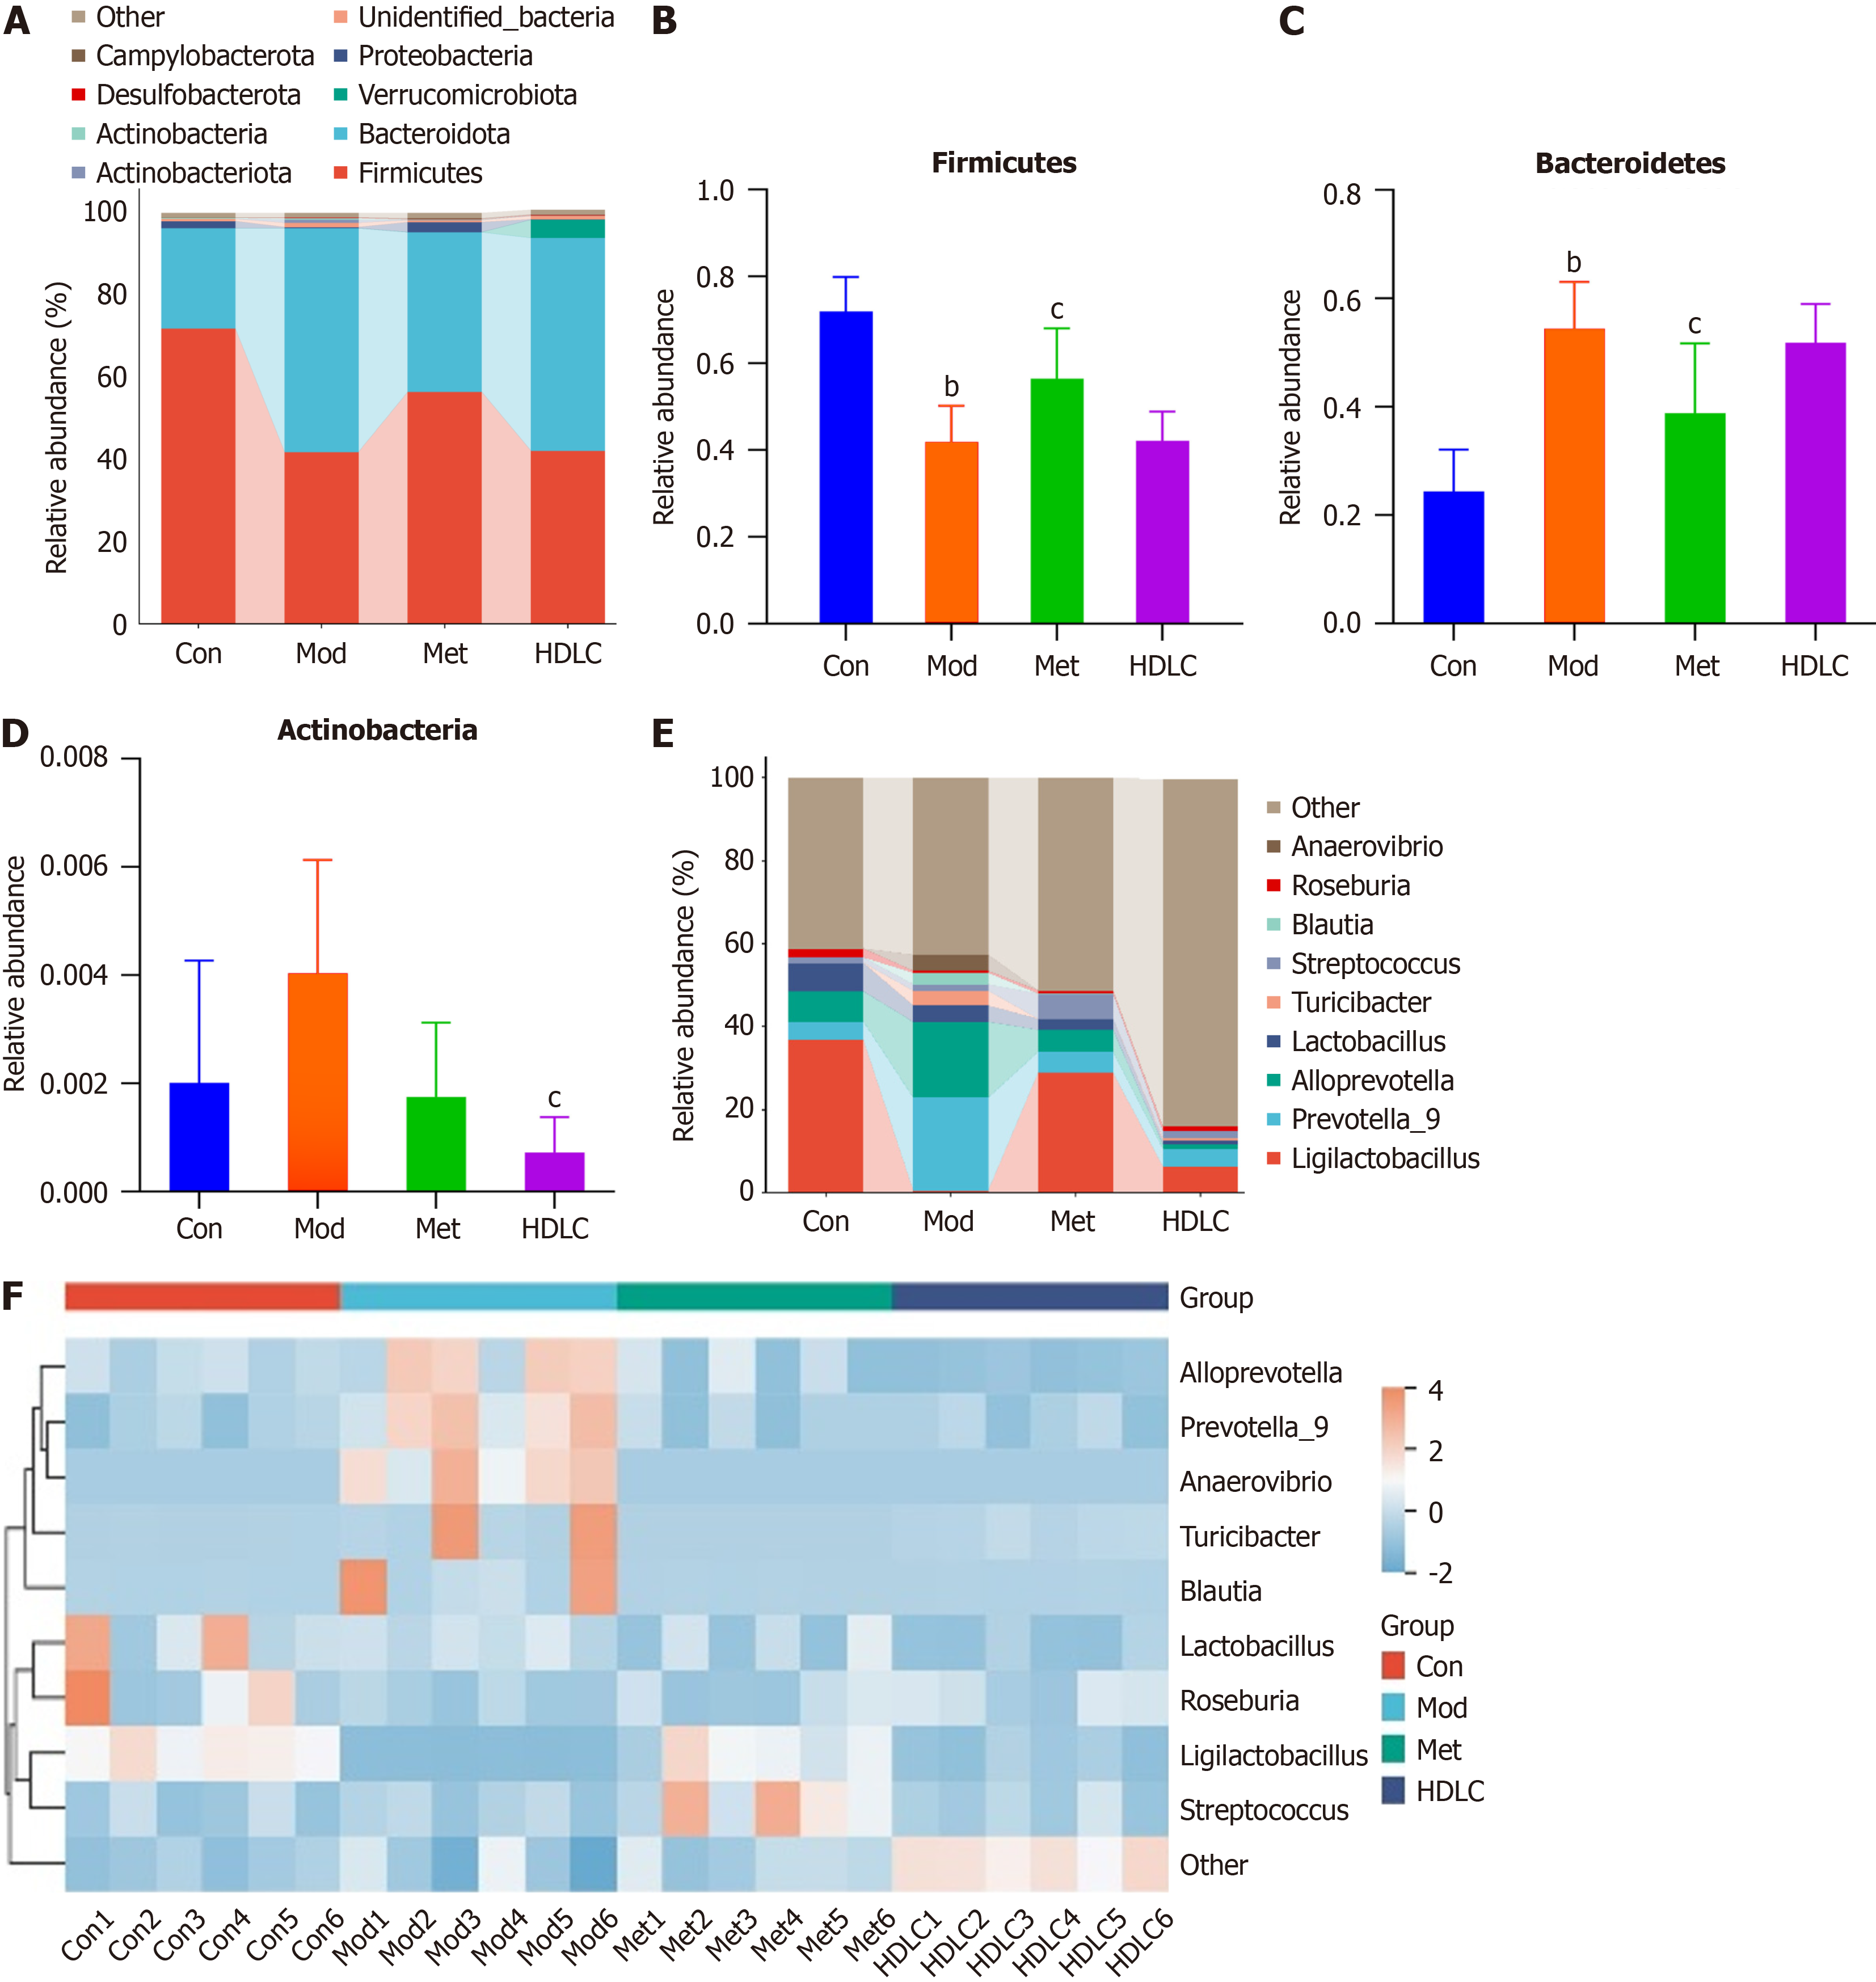
Figure 3 Alterations in the microbial composition at the phylum and genus levels.
A: The proportion of intestinal microbiota at the phylum level; B: The proportion of Firmicutes; C: The proportion of Bacteroidetes; D: The proportion of Actinobacteria; E: The proportion of gut microbiota at the genus levels; F: Community heatmap analysis on genus level. Results were expressed as mean ± SD (n = 6). bP < 0.01 vs the control group; cP < 0.05 vs the model group. Con: Control group; Mod: The model group; Met: The metformin group; HDLC: The high-dose group.
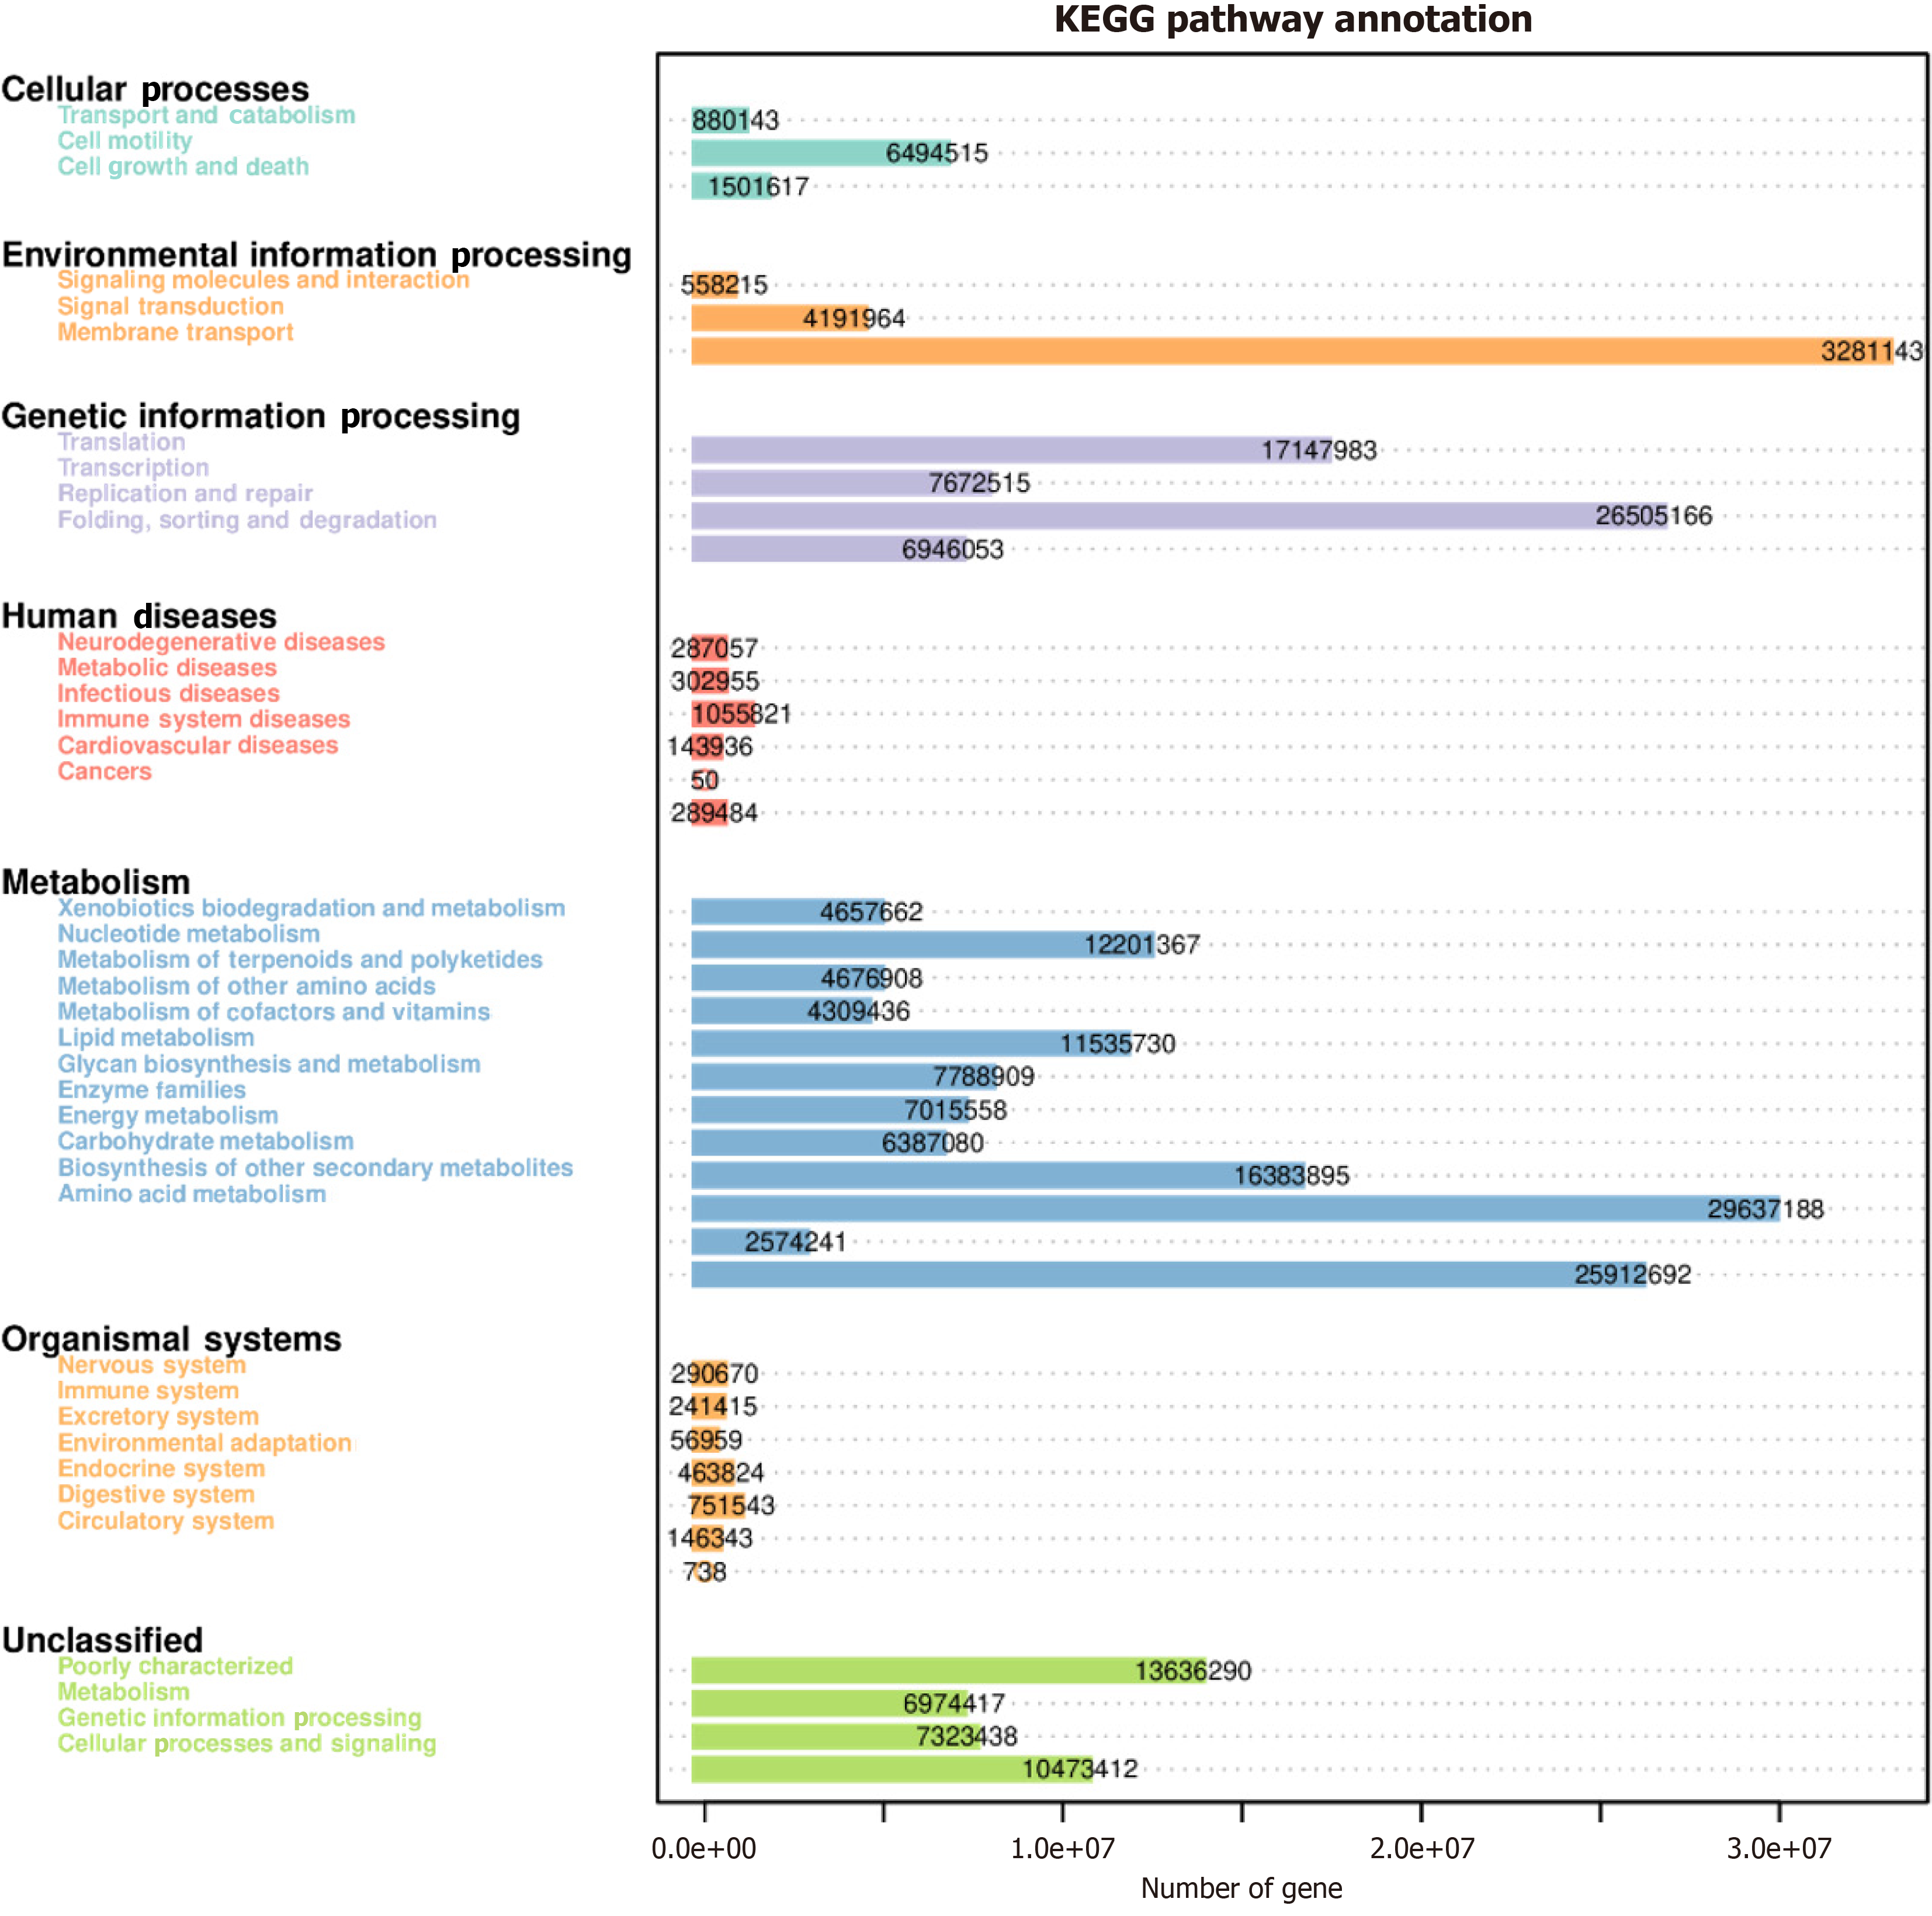
Figure 4 Functional predictive analytics.
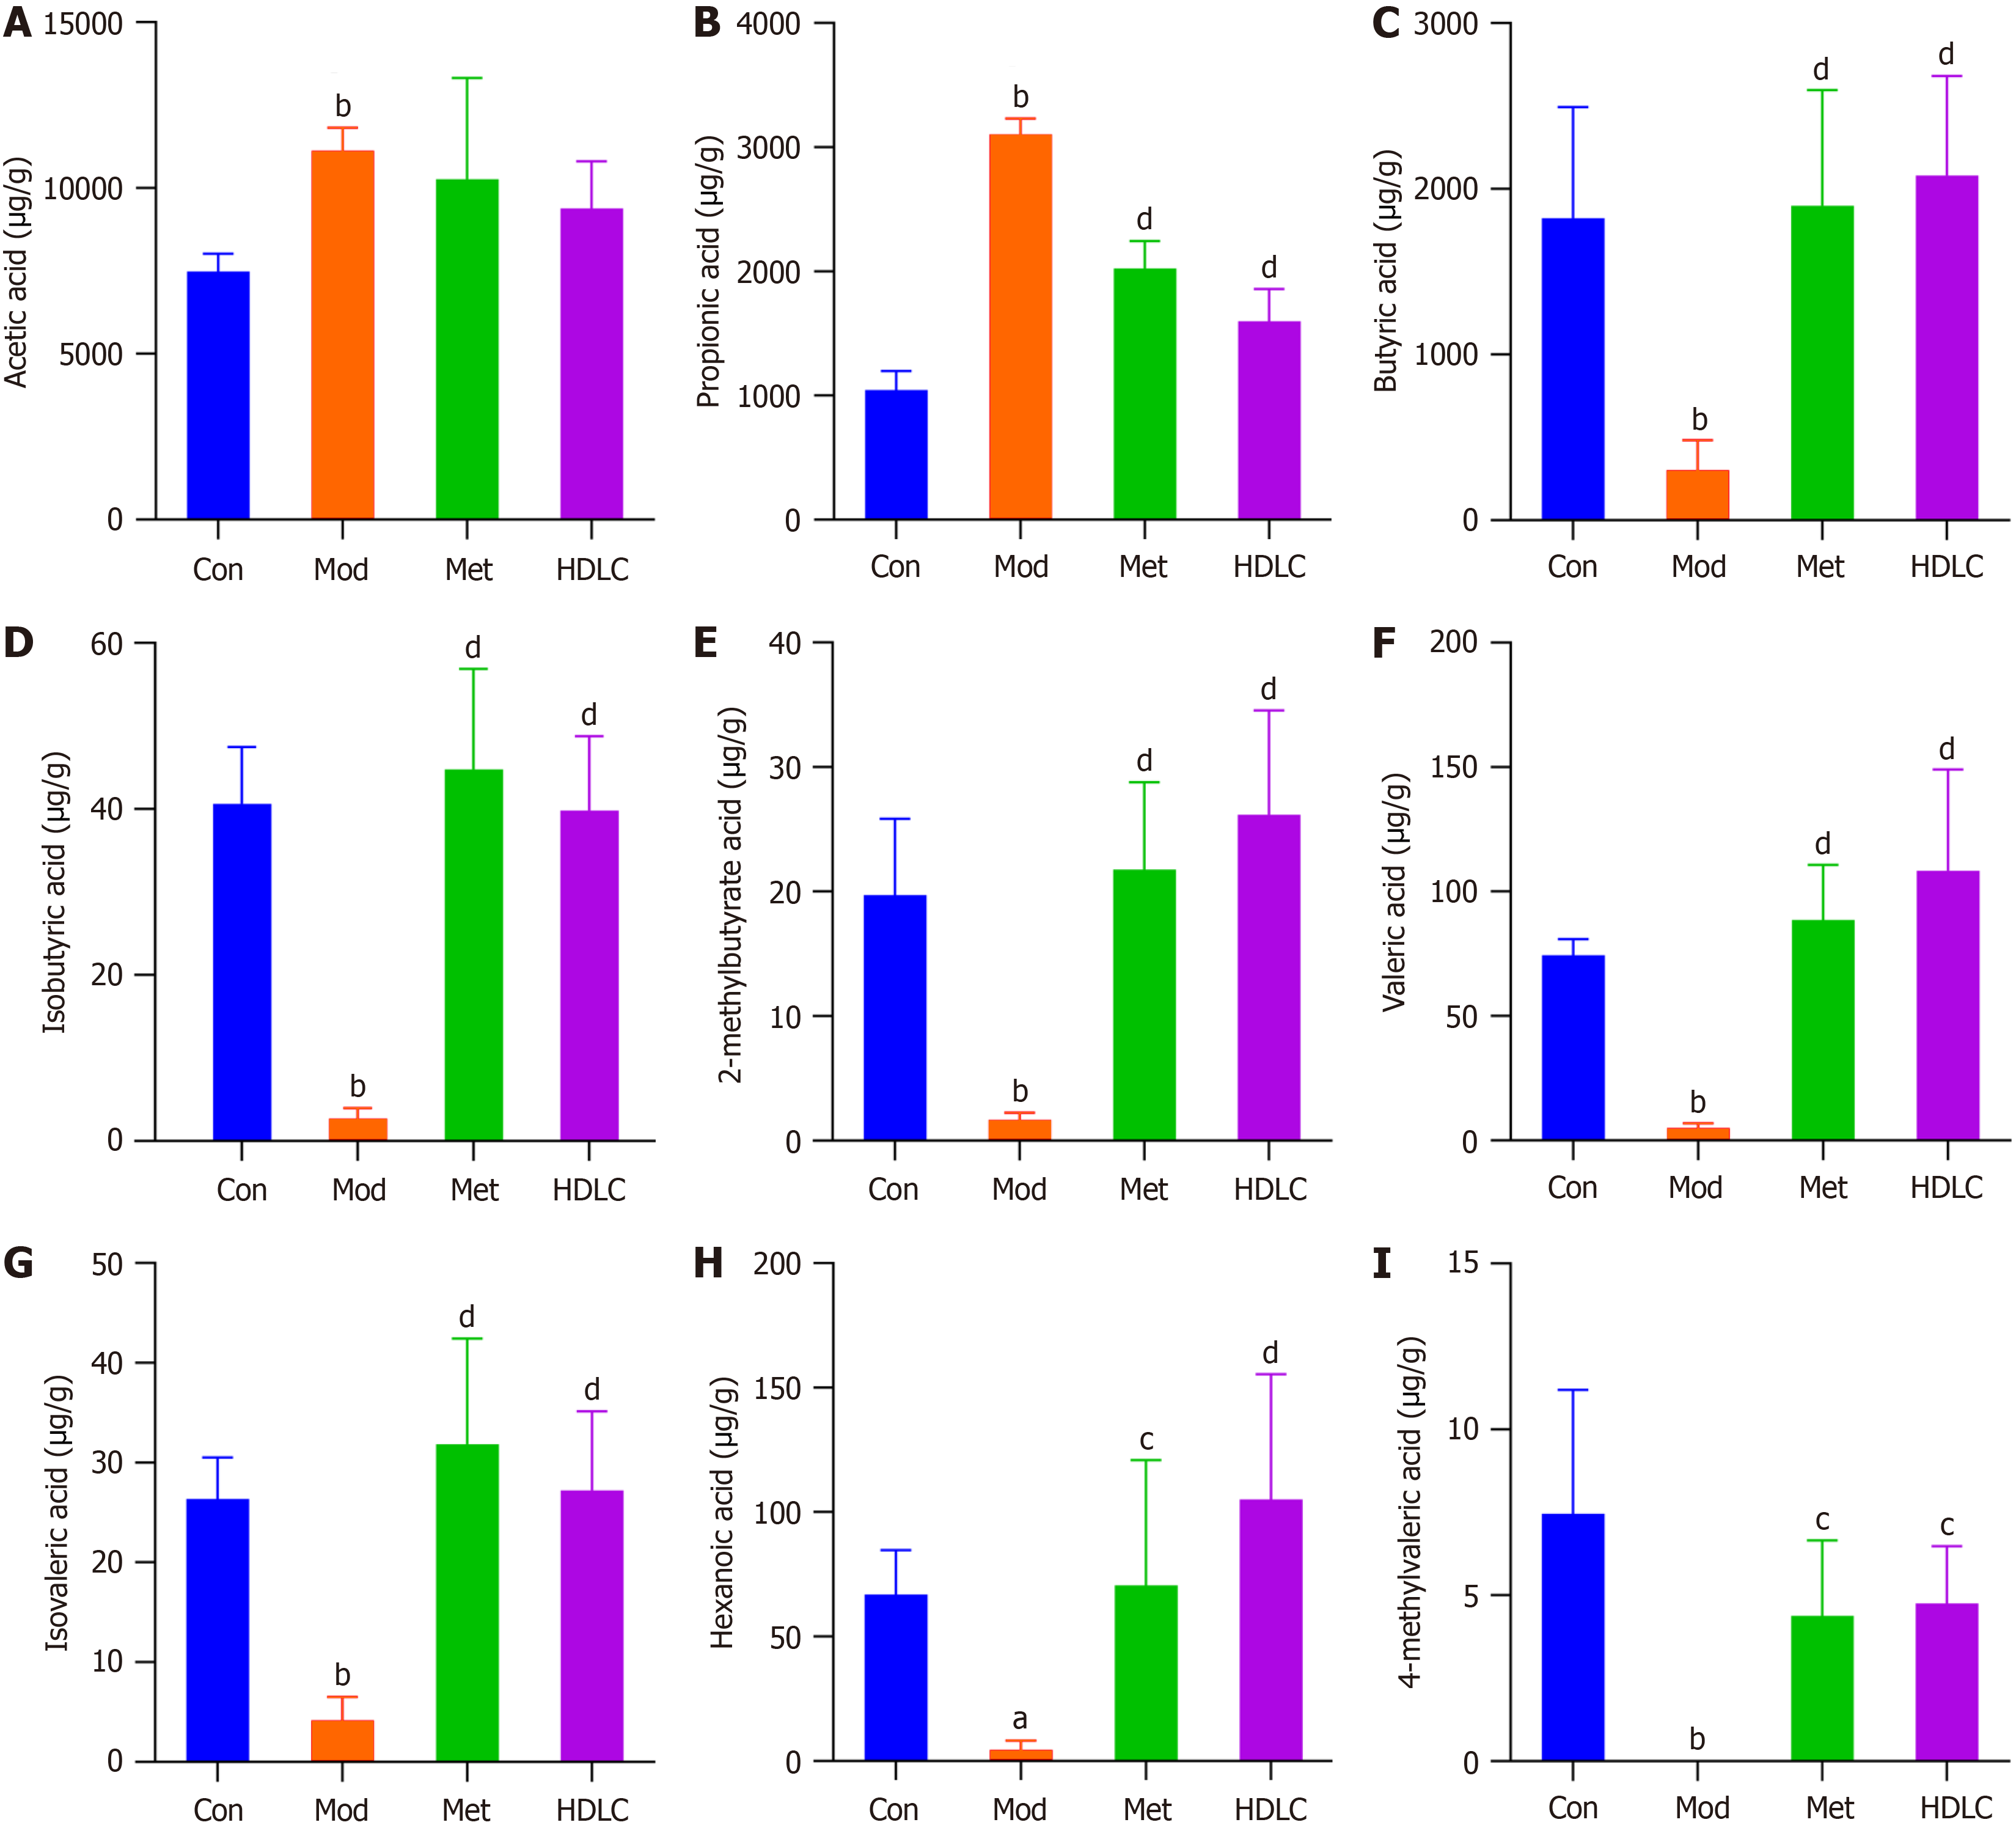
Figure 5 Effects of Dimocarpus longan Lour leaf components on short-chain fatty acids in type 2 diabetes mellitus rats.
A: Acetic acid; B: Propionic acid; C: Butyric acid; D: Isobutyric acid; E: 2-Methylbutyrate acid; F: Valeric acid; G: Isovaleric acid; H: Hexanoic acid; I: 4-Methylvaleric acid. Results were expressed as mean ± SD (n = 6). aP < 0.05 vs the control (Con) group; bP < 0.01 vs the Con group; cP < 0.05 vs the model (Mod) group; dP < 0.01 vs the Mod group. Con: Control group; Mod: The model group; Met: The metformin group; HDLC: The high-dose group.
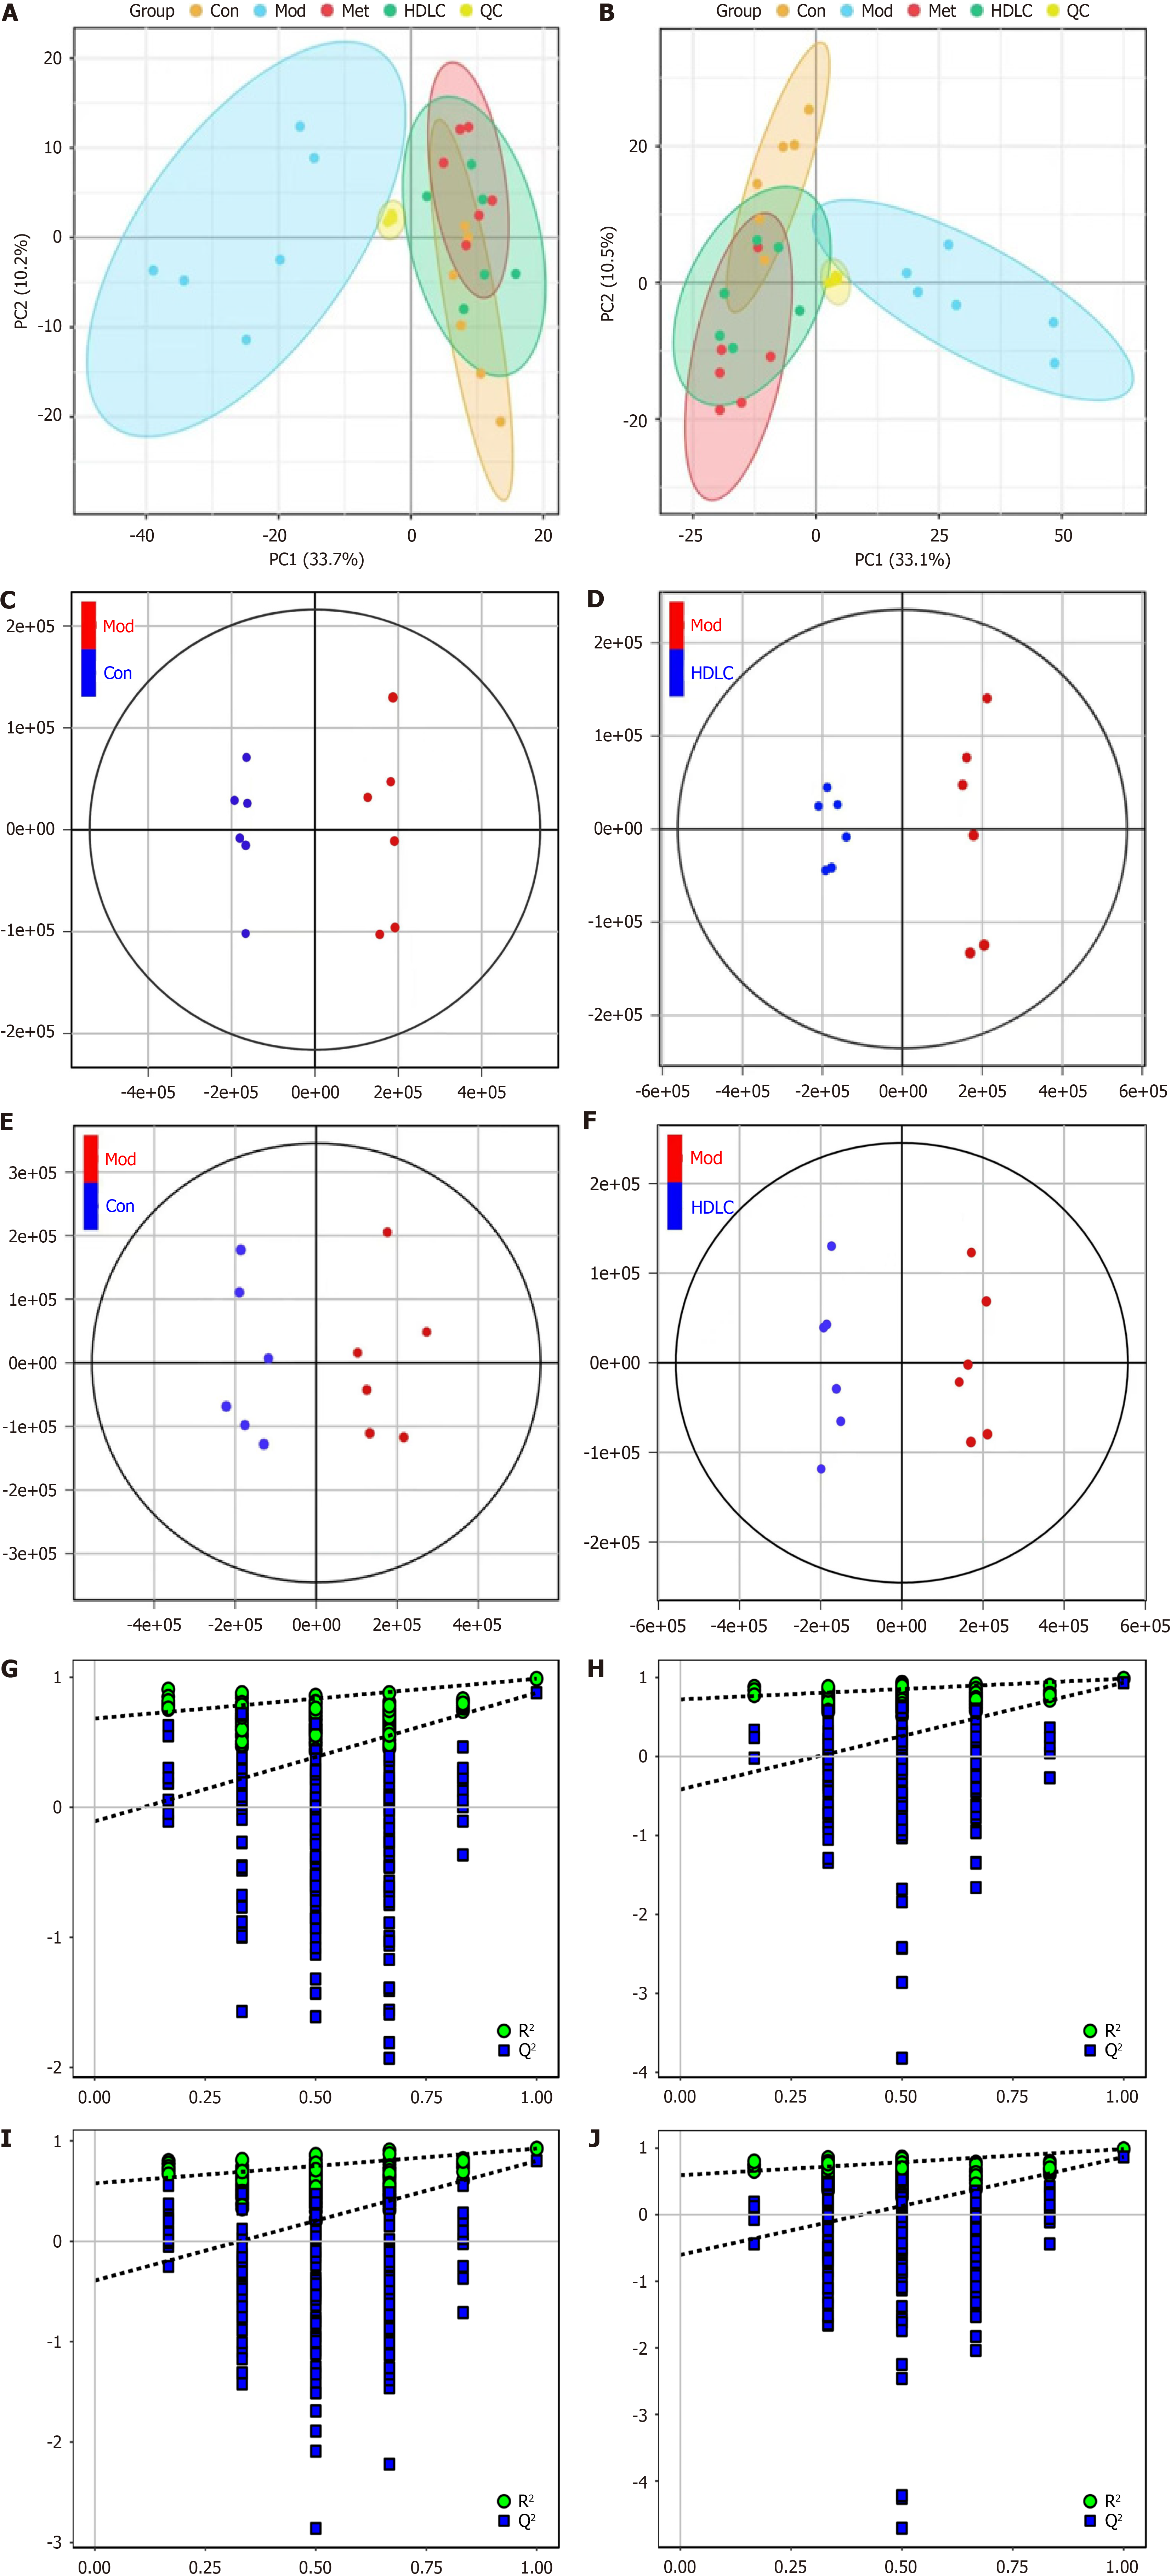
Figure 6 Multivariate statistical analysis (n = 6).
A: Principal component analysis (PCA) score plot (positive ion mode); B: PCA score plot (negative ion mode); C and D: Orthogonal partial least squares - discriminant analysis (OPLS-DA) score plot (positive ion mode); E and F: OPLS-DA score plot (negative ion mode); G and H: OPLS-DA model validation in positive ion mode via permutation test (n = 200); I and J: OPLS-DA model validation in negative ion mode via permutation test (n = 200). R2Y (model interpretability) and Q2Y (predictive power) are critical metrics for OPLS-DA. A robust model is confirmed when R2Y > Q2Y. Con: Control group; Mod: The model group; Met: The metformin group; HDLC: The high-dose group.
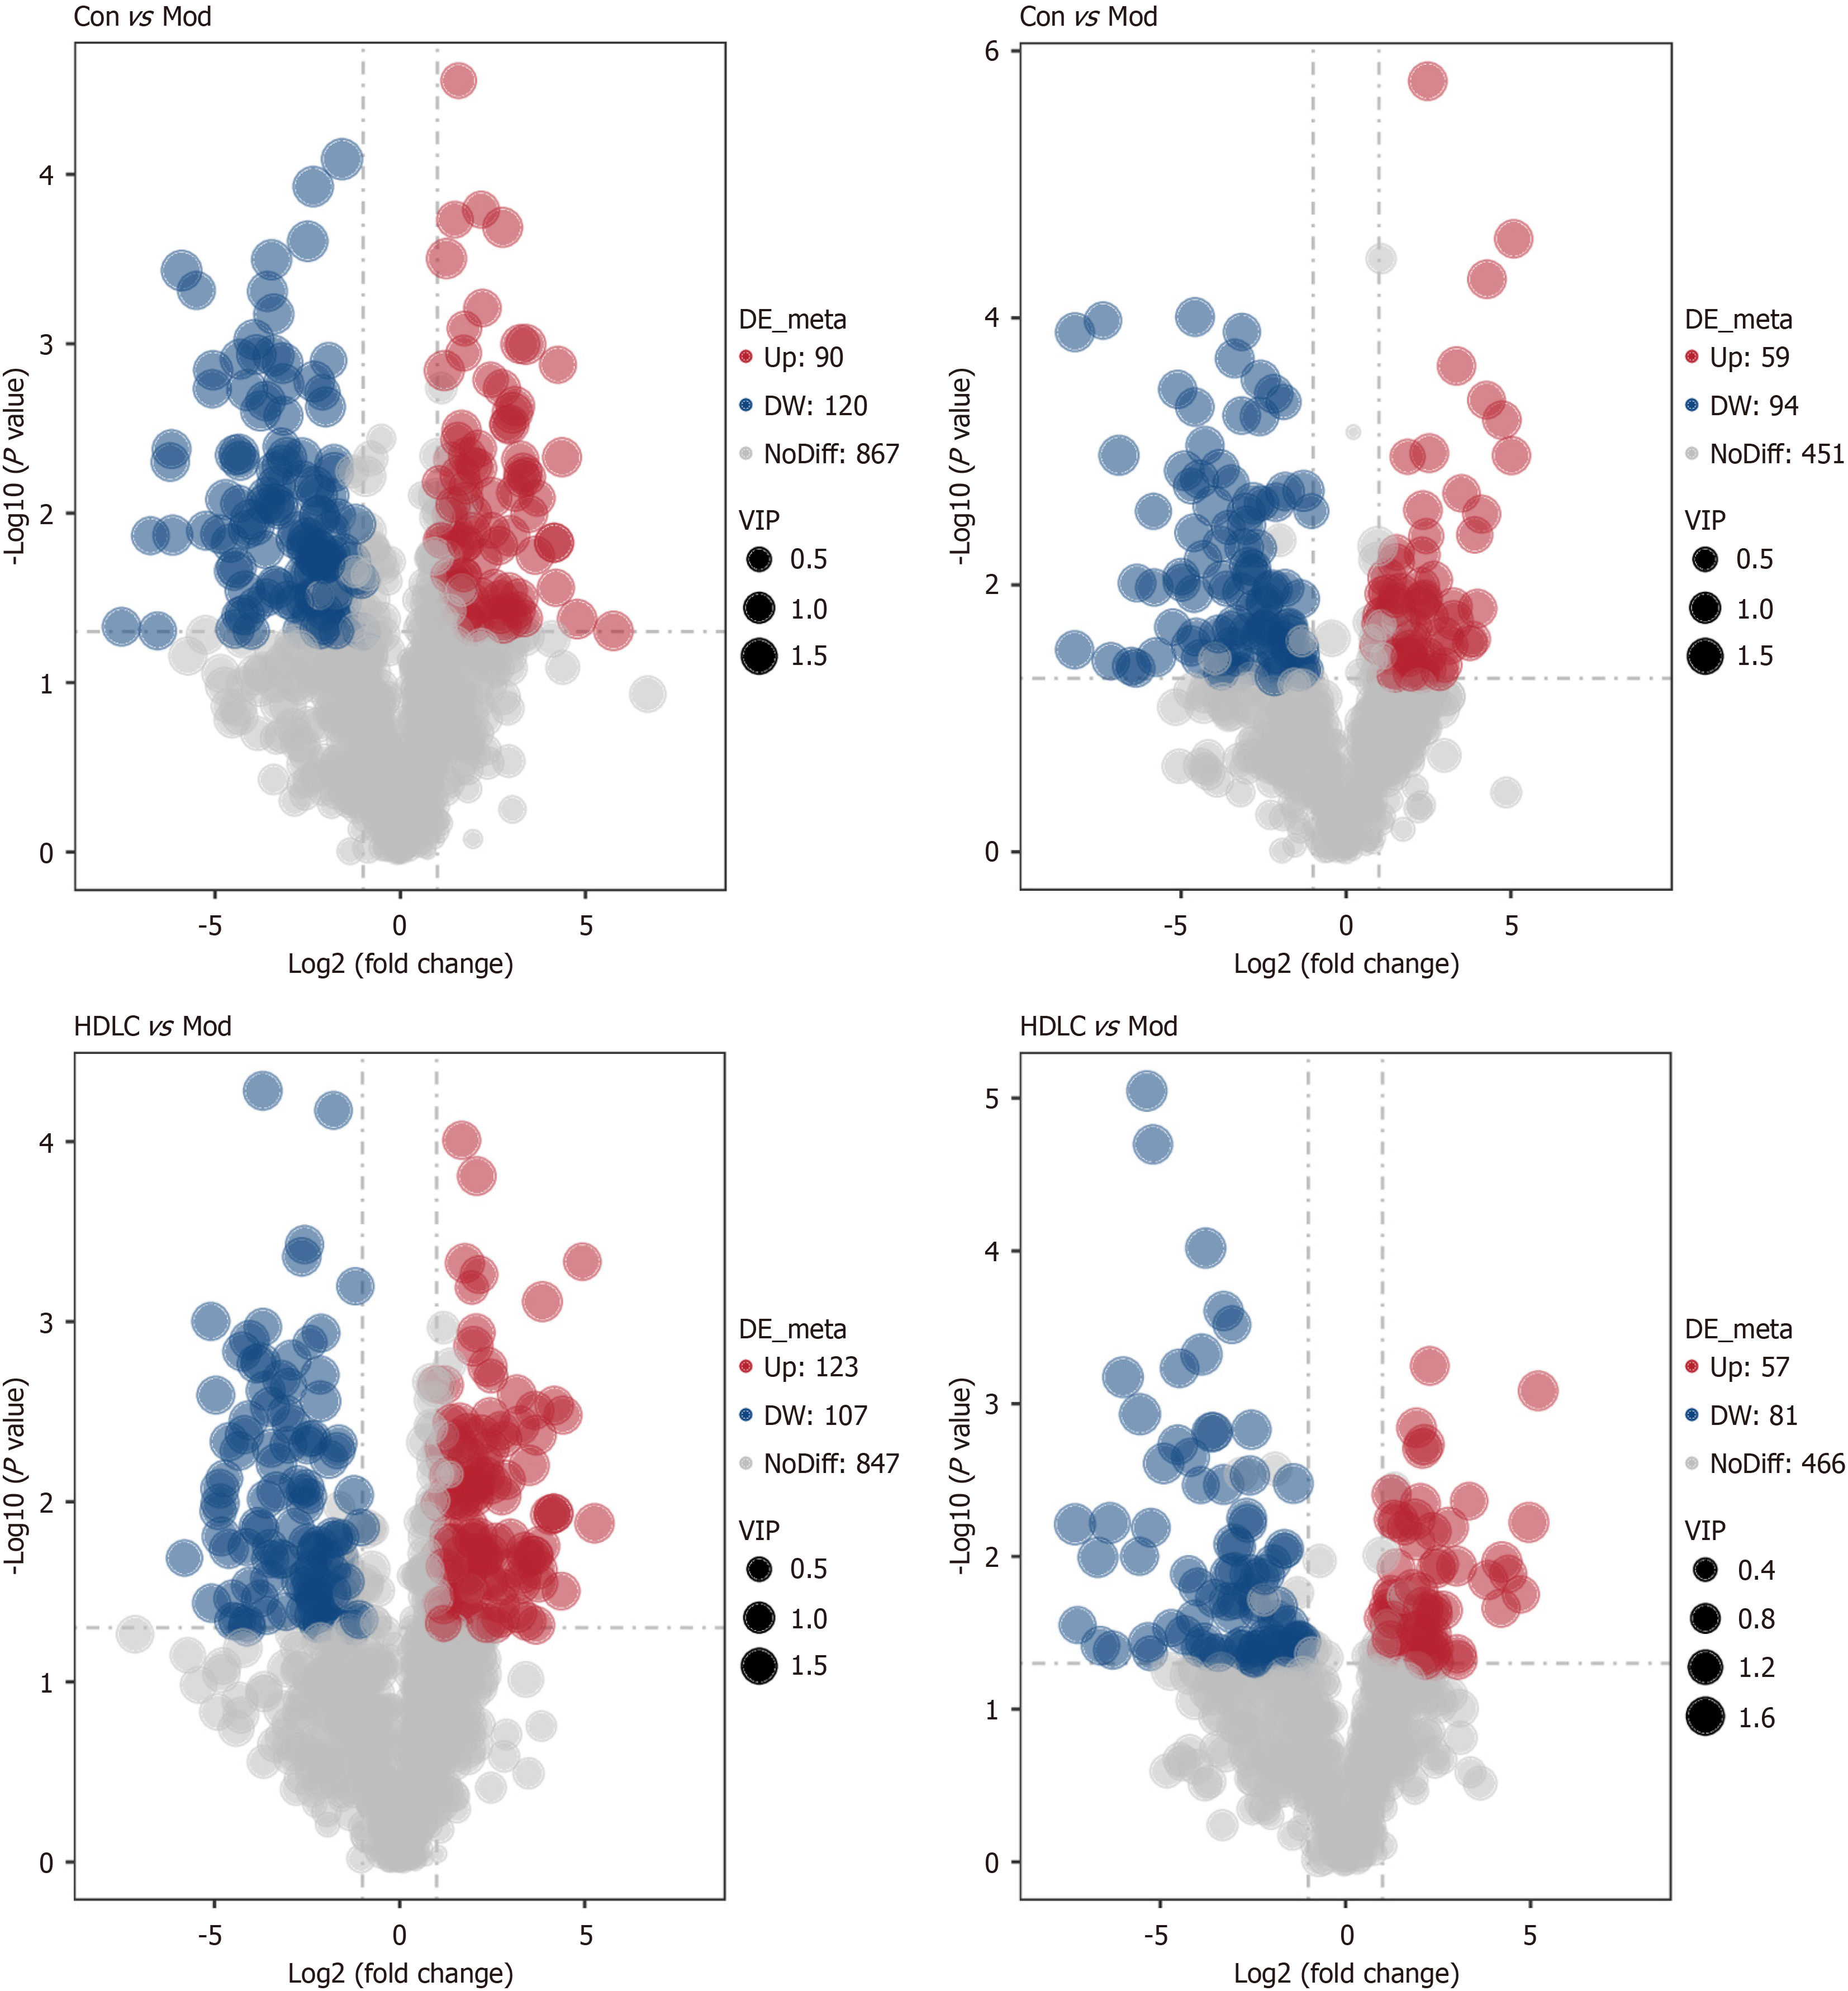
Figure 7 Potential marker analysis.
A volcano diagram illustrating the distinct metabolite compositions for control group vs model group and model group vs the high-dose group (The X-axis represents the diversity of metabolite variations across groups, while the Y-axis denotes the statistical significance of these variations). Con: Control group; Mod: The model group; Met: The metformin group; HDLC: The high-dose group.
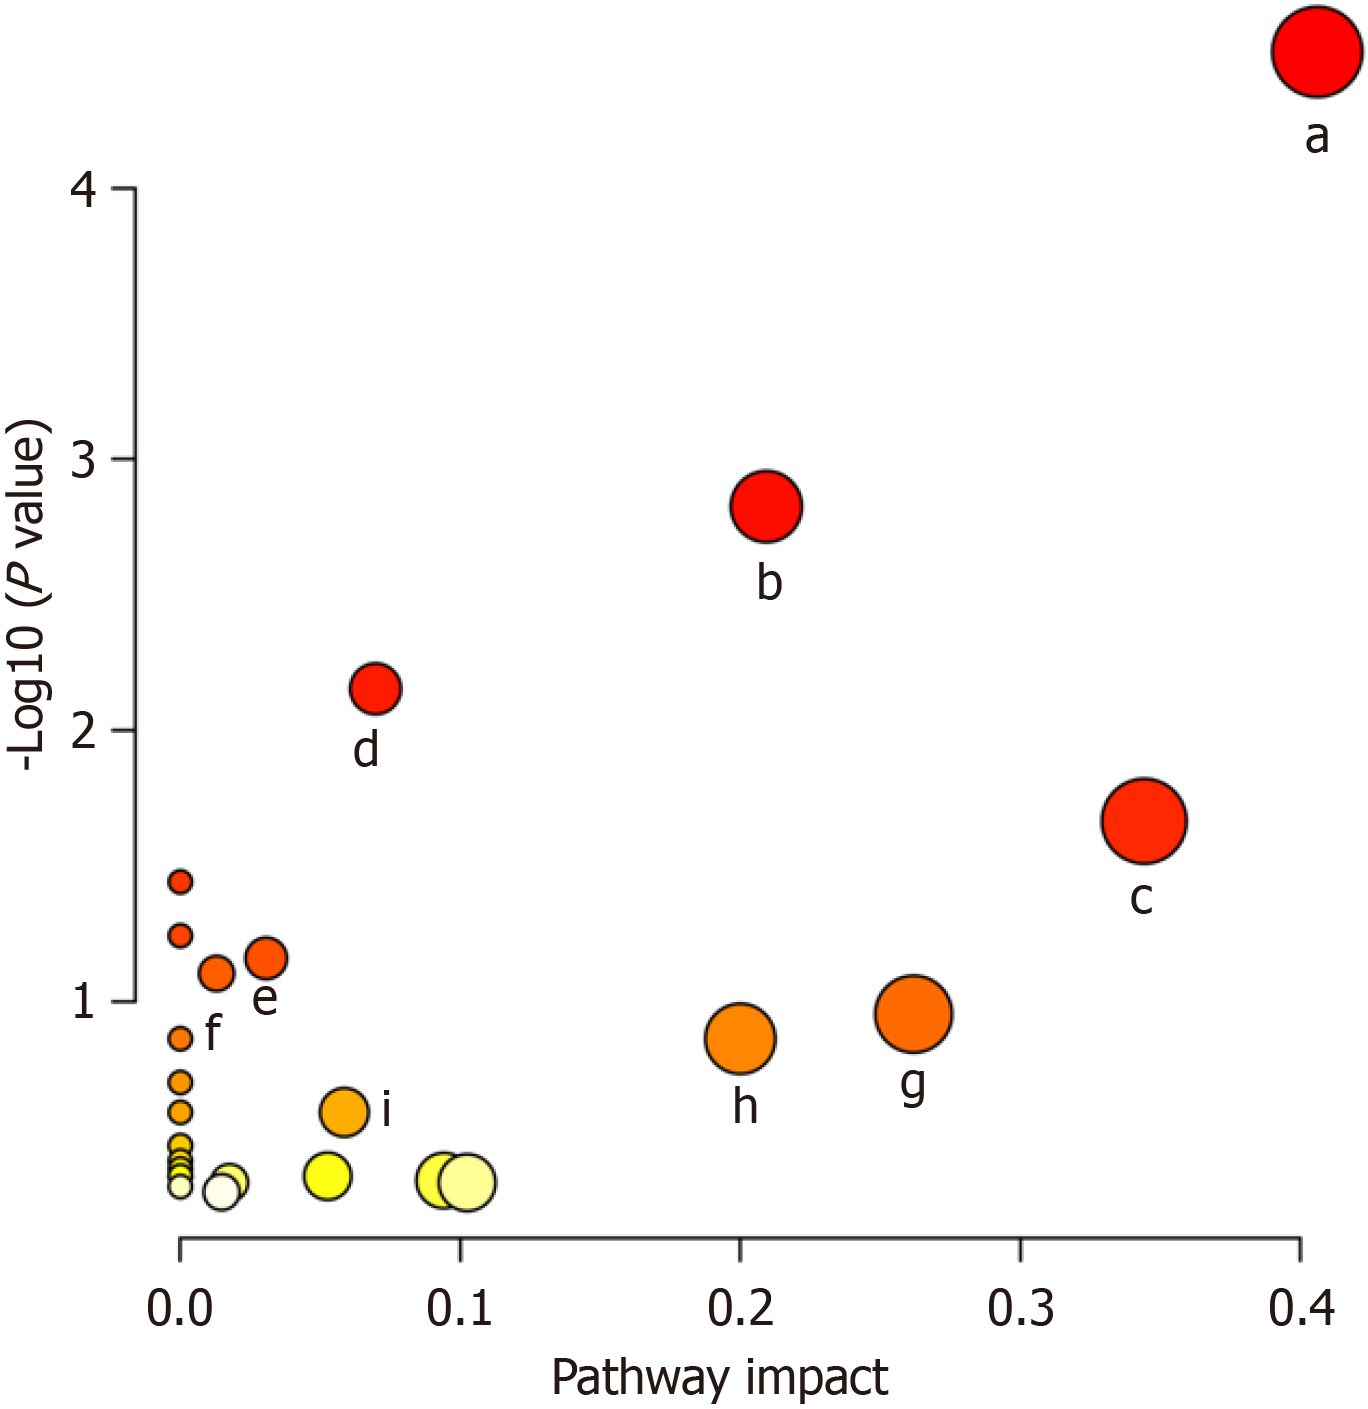
Figure 8 Metabolic pathway analysis of type 2 diabetes mellitus-linked biomarker candidates.
a: Arginine biosynthesis; b: Arginine and proline metabolism; c: Histidine metabolism; d: Alanine, aspartic acid, and glutamate metabolism; e: Lysine degradation; f: Purine metabolism; g: Phenylalanine metabolism; h: Biotin metabolism; i: Tricarboxylic acid cycle (citrate cycle).
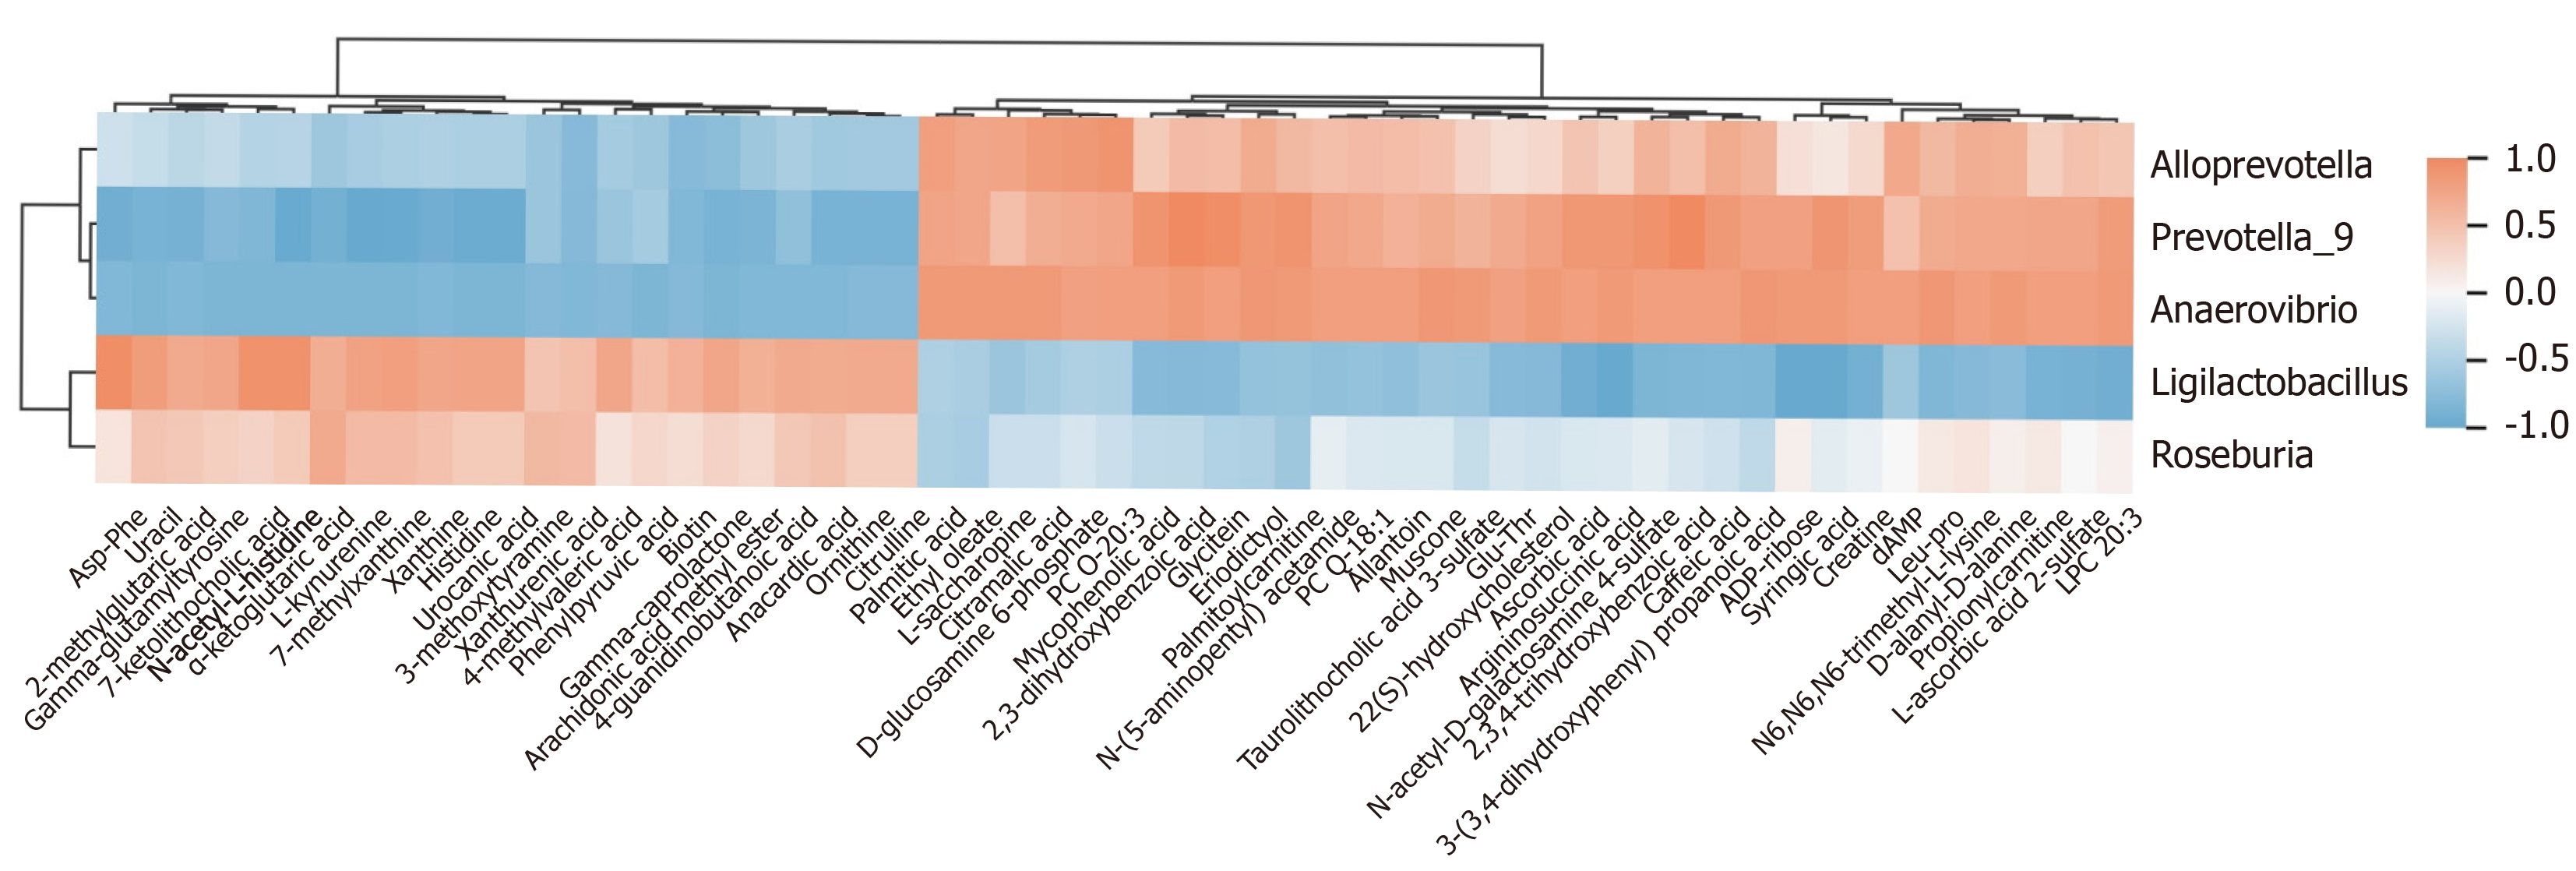
Figure 9 Correlation analysis of the intestinal flora with untargeted metabolomics.
The vertical axis illustrates the varying abundance of gut microbiota. The color coding within the grids reflects the outcomes of the Spearman correlation analysis. Red grids signify positive correlations, where the correlation value exceeds 0.1, whereas blue grids represent negative correlations with values falling below -0.1. The color gradient in the heatmap represents these correlation values, with more intense shades of red or blue indicating stronger correlations.
- Citation: Zheng PX, Lu CL, Liang YL, Ma YM, Peng JW, Xie JJ, Wei JL, Chen SS, Ma ZD, Zhu H, Liang J. Examining gut microbiota and metabolites to clarify mechanisms of Dimocarpus longan Lour leaf components against type 2 diabetes. World J Diabetes 2025; 16(7): 104512
- URL: https://www.wjgnet.com/1948-9358/full/v16/i7/104512.htm
- DOI: https://dx.doi.org/10.4239/wjd.v16.i7.104512


