Copyright
©The Author(s) 2025.
World J Diabetes. Jul 15, 2025; 16(7): 104512
Published online Jul 15, 2025. doi: 10.4239/wjd.v16.i7.104512
Published online Jul 15, 2025. doi: 10.4239/wjd.v16.i7.104512
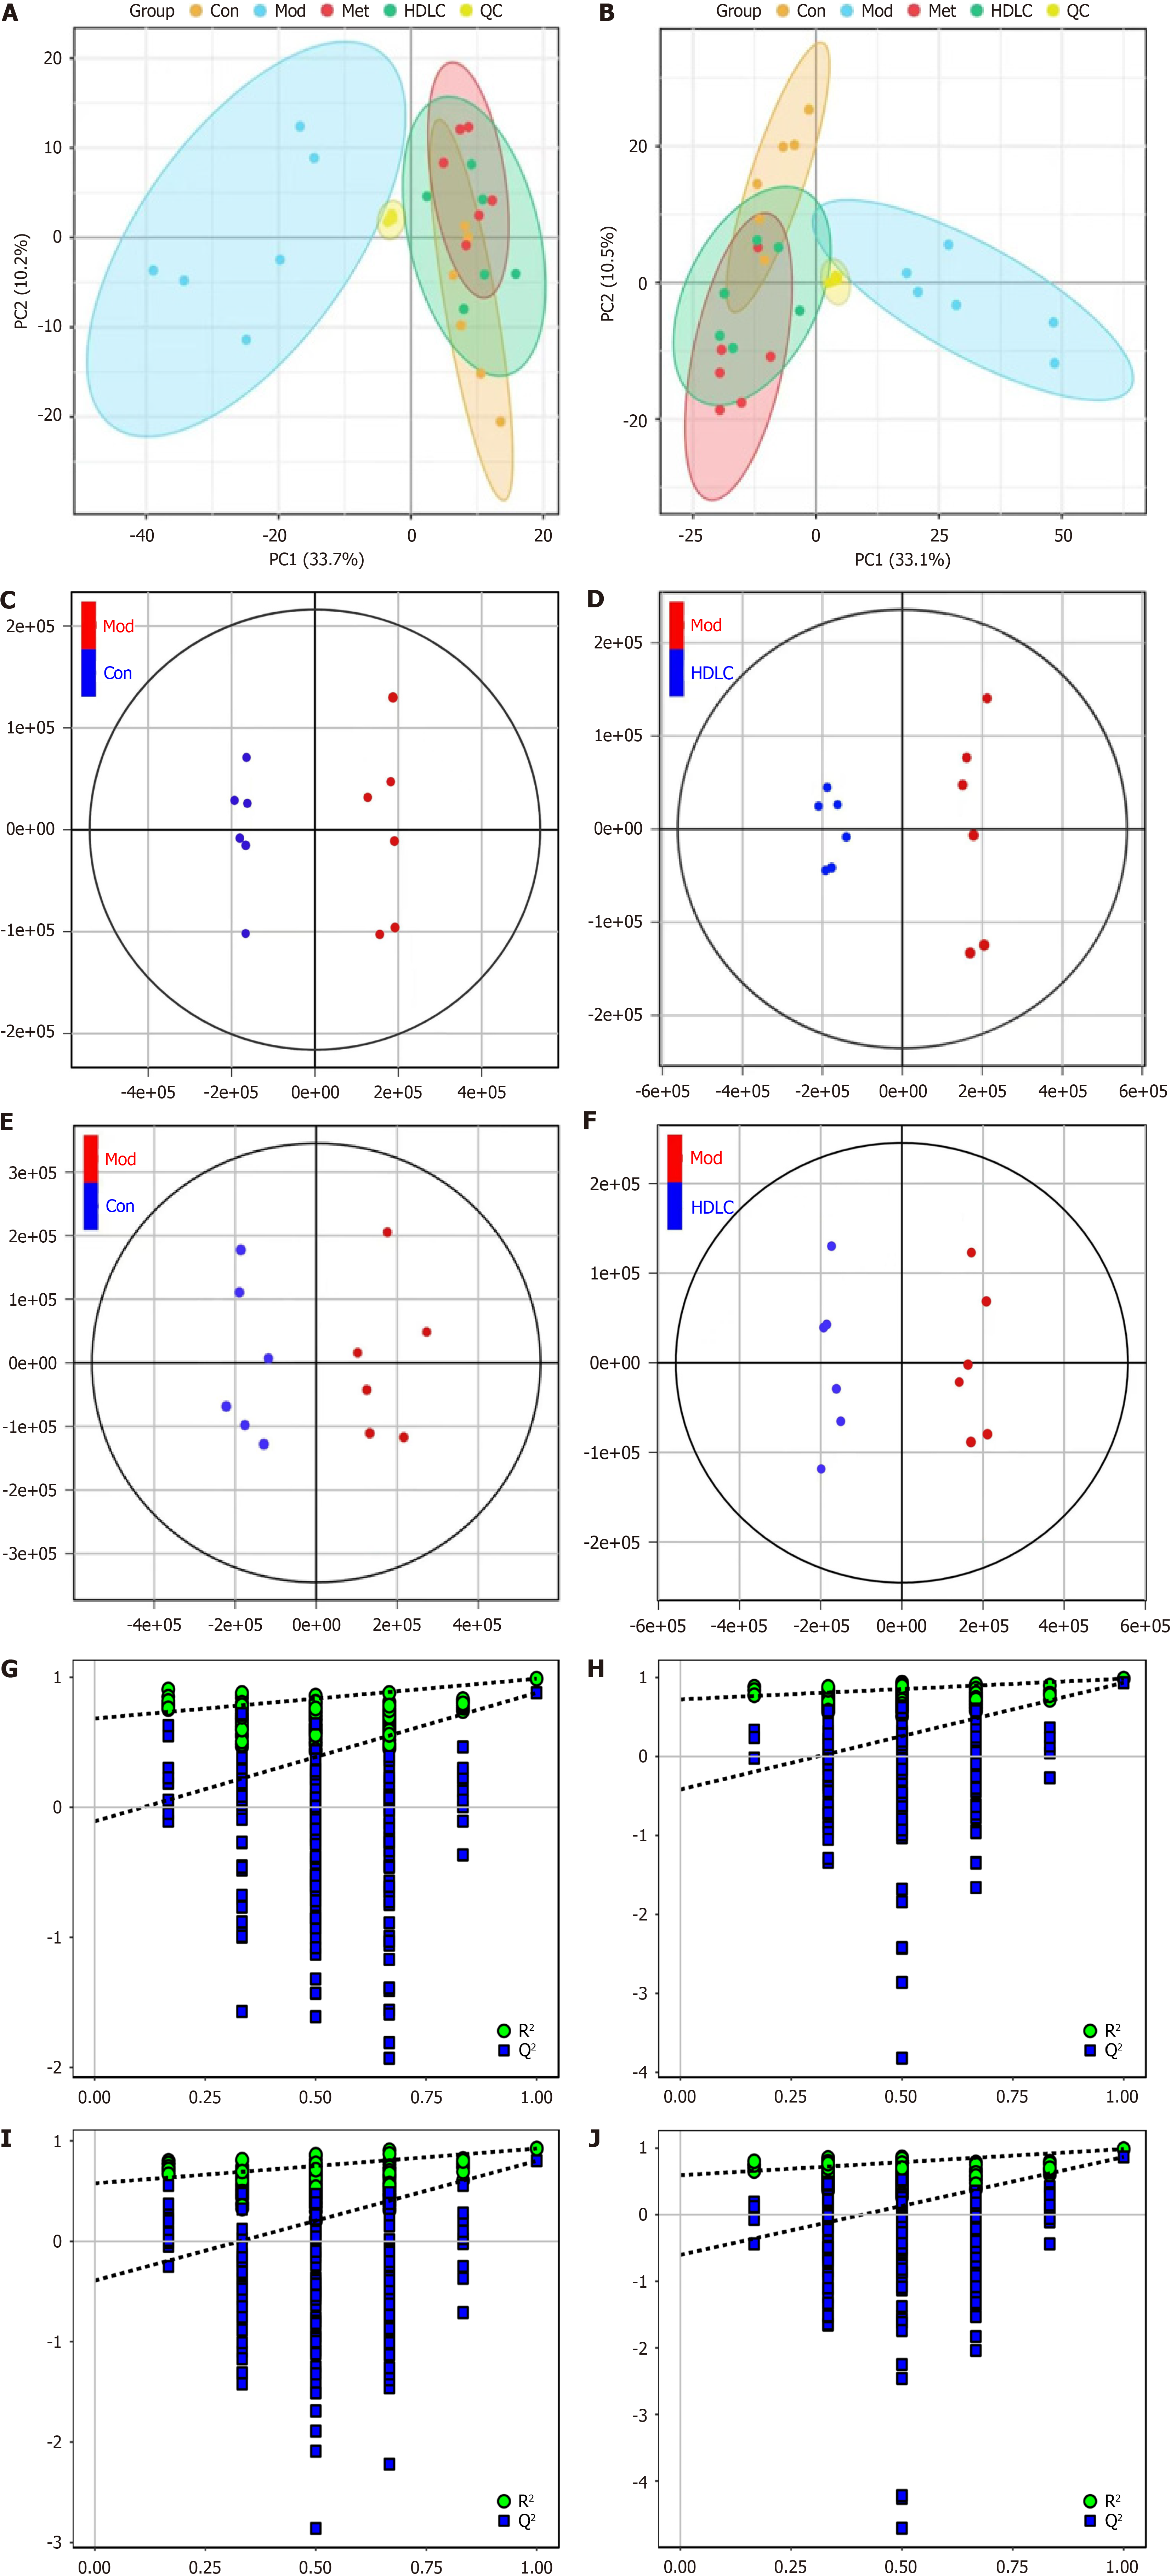
Figure 6 Multivariate statistical analysis (n = 6).
A: Principal component analysis (PCA) score plot (positive ion mode); B: PCA score plot (negative ion mode); C and D: Orthogonal partial least squares - discriminant analysis (OPLS-DA) score plot (positive ion mode); E and F: OPLS-DA score plot (negative ion mode); G and H: OPLS-DA model validation in positive ion mode via permutation test (n = 200); I and J: OPLS-DA model validation in negative ion mode via permutation test (n = 200). R2Y (model interpretability) and Q2Y (predictive power) are critical metrics for OPLS-DA. A robust model is confirmed when R2Y > Q2Y. Con: Control group; Mod: The model group; Met: The metformin group; HDLC: The high-dose group.
- Citation: Zheng PX, Lu CL, Liang YL, Ma YM, Peng JW, Xie JJ, Wei JL, Chen SS, Ma ZD, Zhu H, Liang J. Examining gut microbiota and metabolites to clarify mechanisms of Dimocarpus longan Lour leaf components against type 2 diabetes. World J Diabetes 2025; 16(7): 104512
- URL: https://www.wjgnet.com/1948-9358/full/v16/i7/104512.htm
- DOI: https://dx.doi.org/10.4239/wjd.v16.i7.104512


