Copyright
©The Author(s) 2025.
World J Diabetes. Jul 15, 2025; 16(7): 104512
Published online Jul 15, 2025. doi: 10.4239/wjd.v16.i7.104512
Published online Jul 15, 2025. doi: 10.4239/wjd.v16.i7.104512
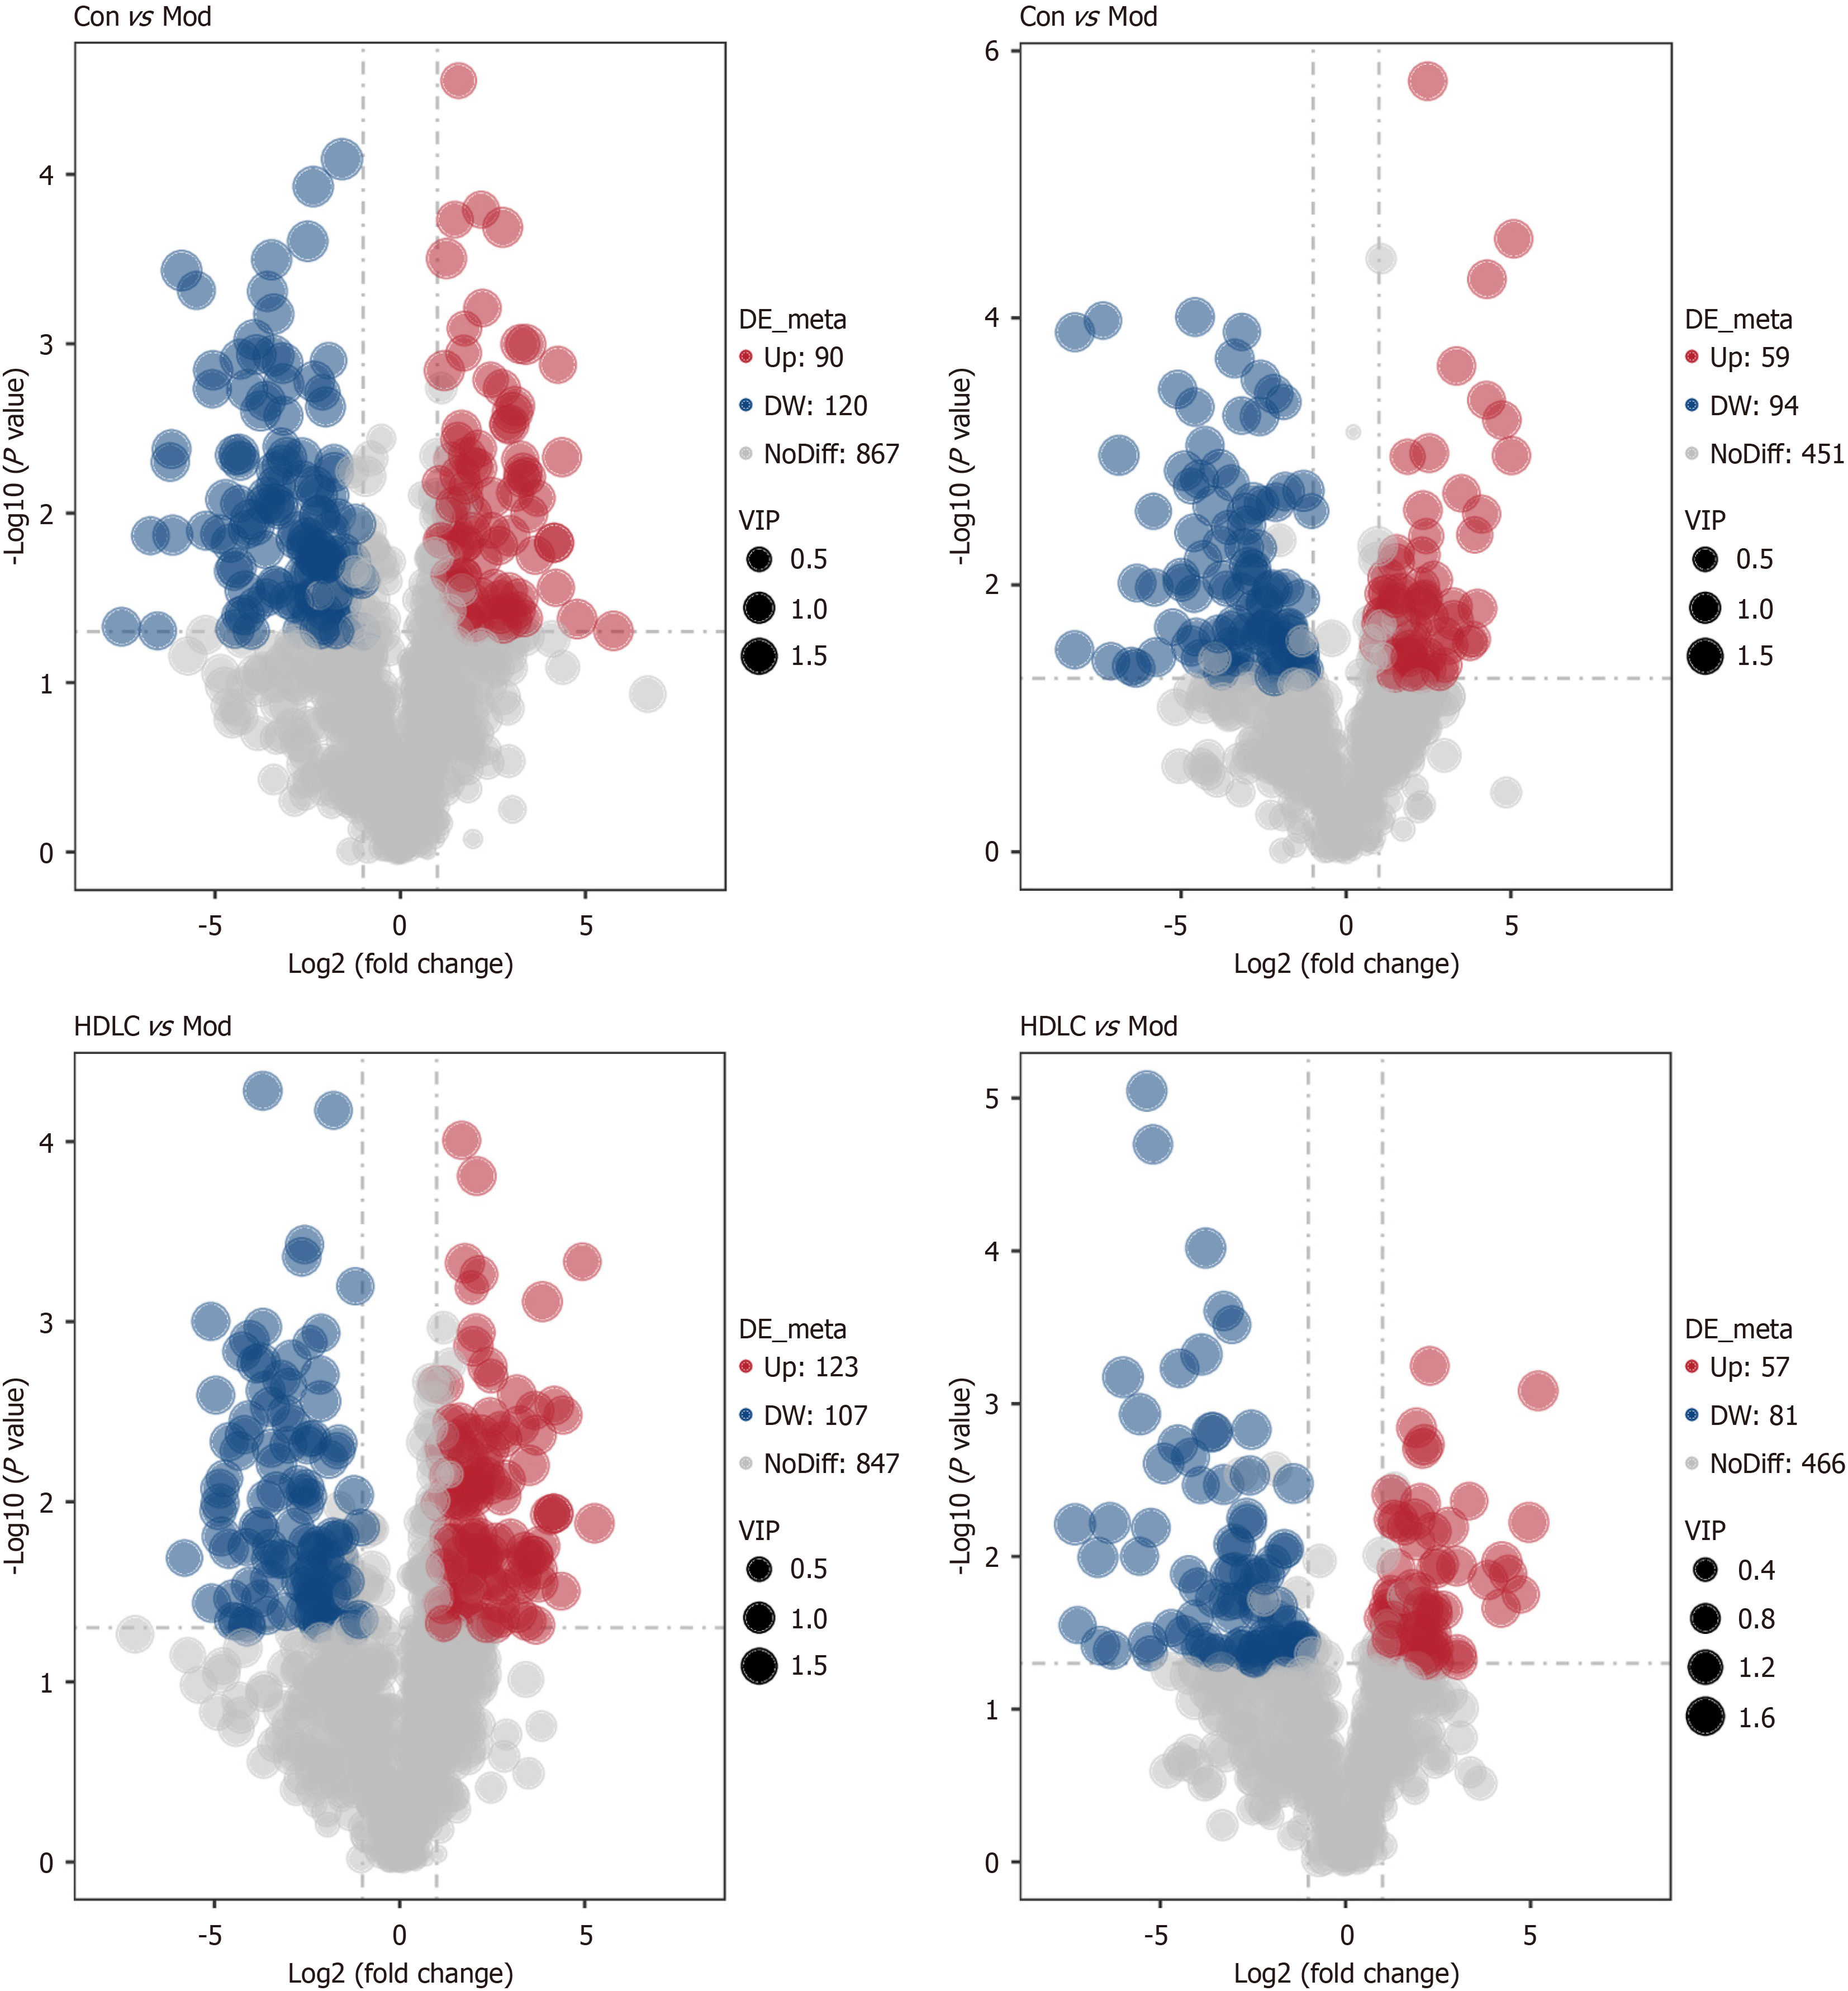
Figure 7 Potential marker analysis.
A volcano diagram illustrating the distinct metabolite compositions for control group vs model group and model group vs the high-dose group (The X-axis represents the diversity of metabolite variations across groups, while the Y-axis denotes the statistical significance of these variations). Con: Control group; Mod: The model group; Met: The metformin group; HDLC: The high-dose group.
- Citation: Zheng PX, Lu CL, Liang YL, Ma YM, Peng JW, Xie JJ, Wei JL, Chen SS, Ma ZD, Zhu H, Liang J. Examining gut microbiota and metabolites to clarify mechanisms of Dimocarpus longan Lour leaf components against type 2 diabetes. World J Diabetes 2025; 16(7): 104512
- URL: https://www.wjgnet.com/1948-9358/full/v16/i7/104512.htm
- DOI: https://dx.doi.org/10.4239/wjd.v16.i7.104512


