Copyright
©The Author(s) 2025.
World J Diabetes. Jul 15, 2025; 16(7): 104512
Published online Jul 15, 2025. doi: 10.4239/wjd.v16.i7.104512
Published online Jul 15, 2025. doi: 10.4239/wjd.v16.i7.104512
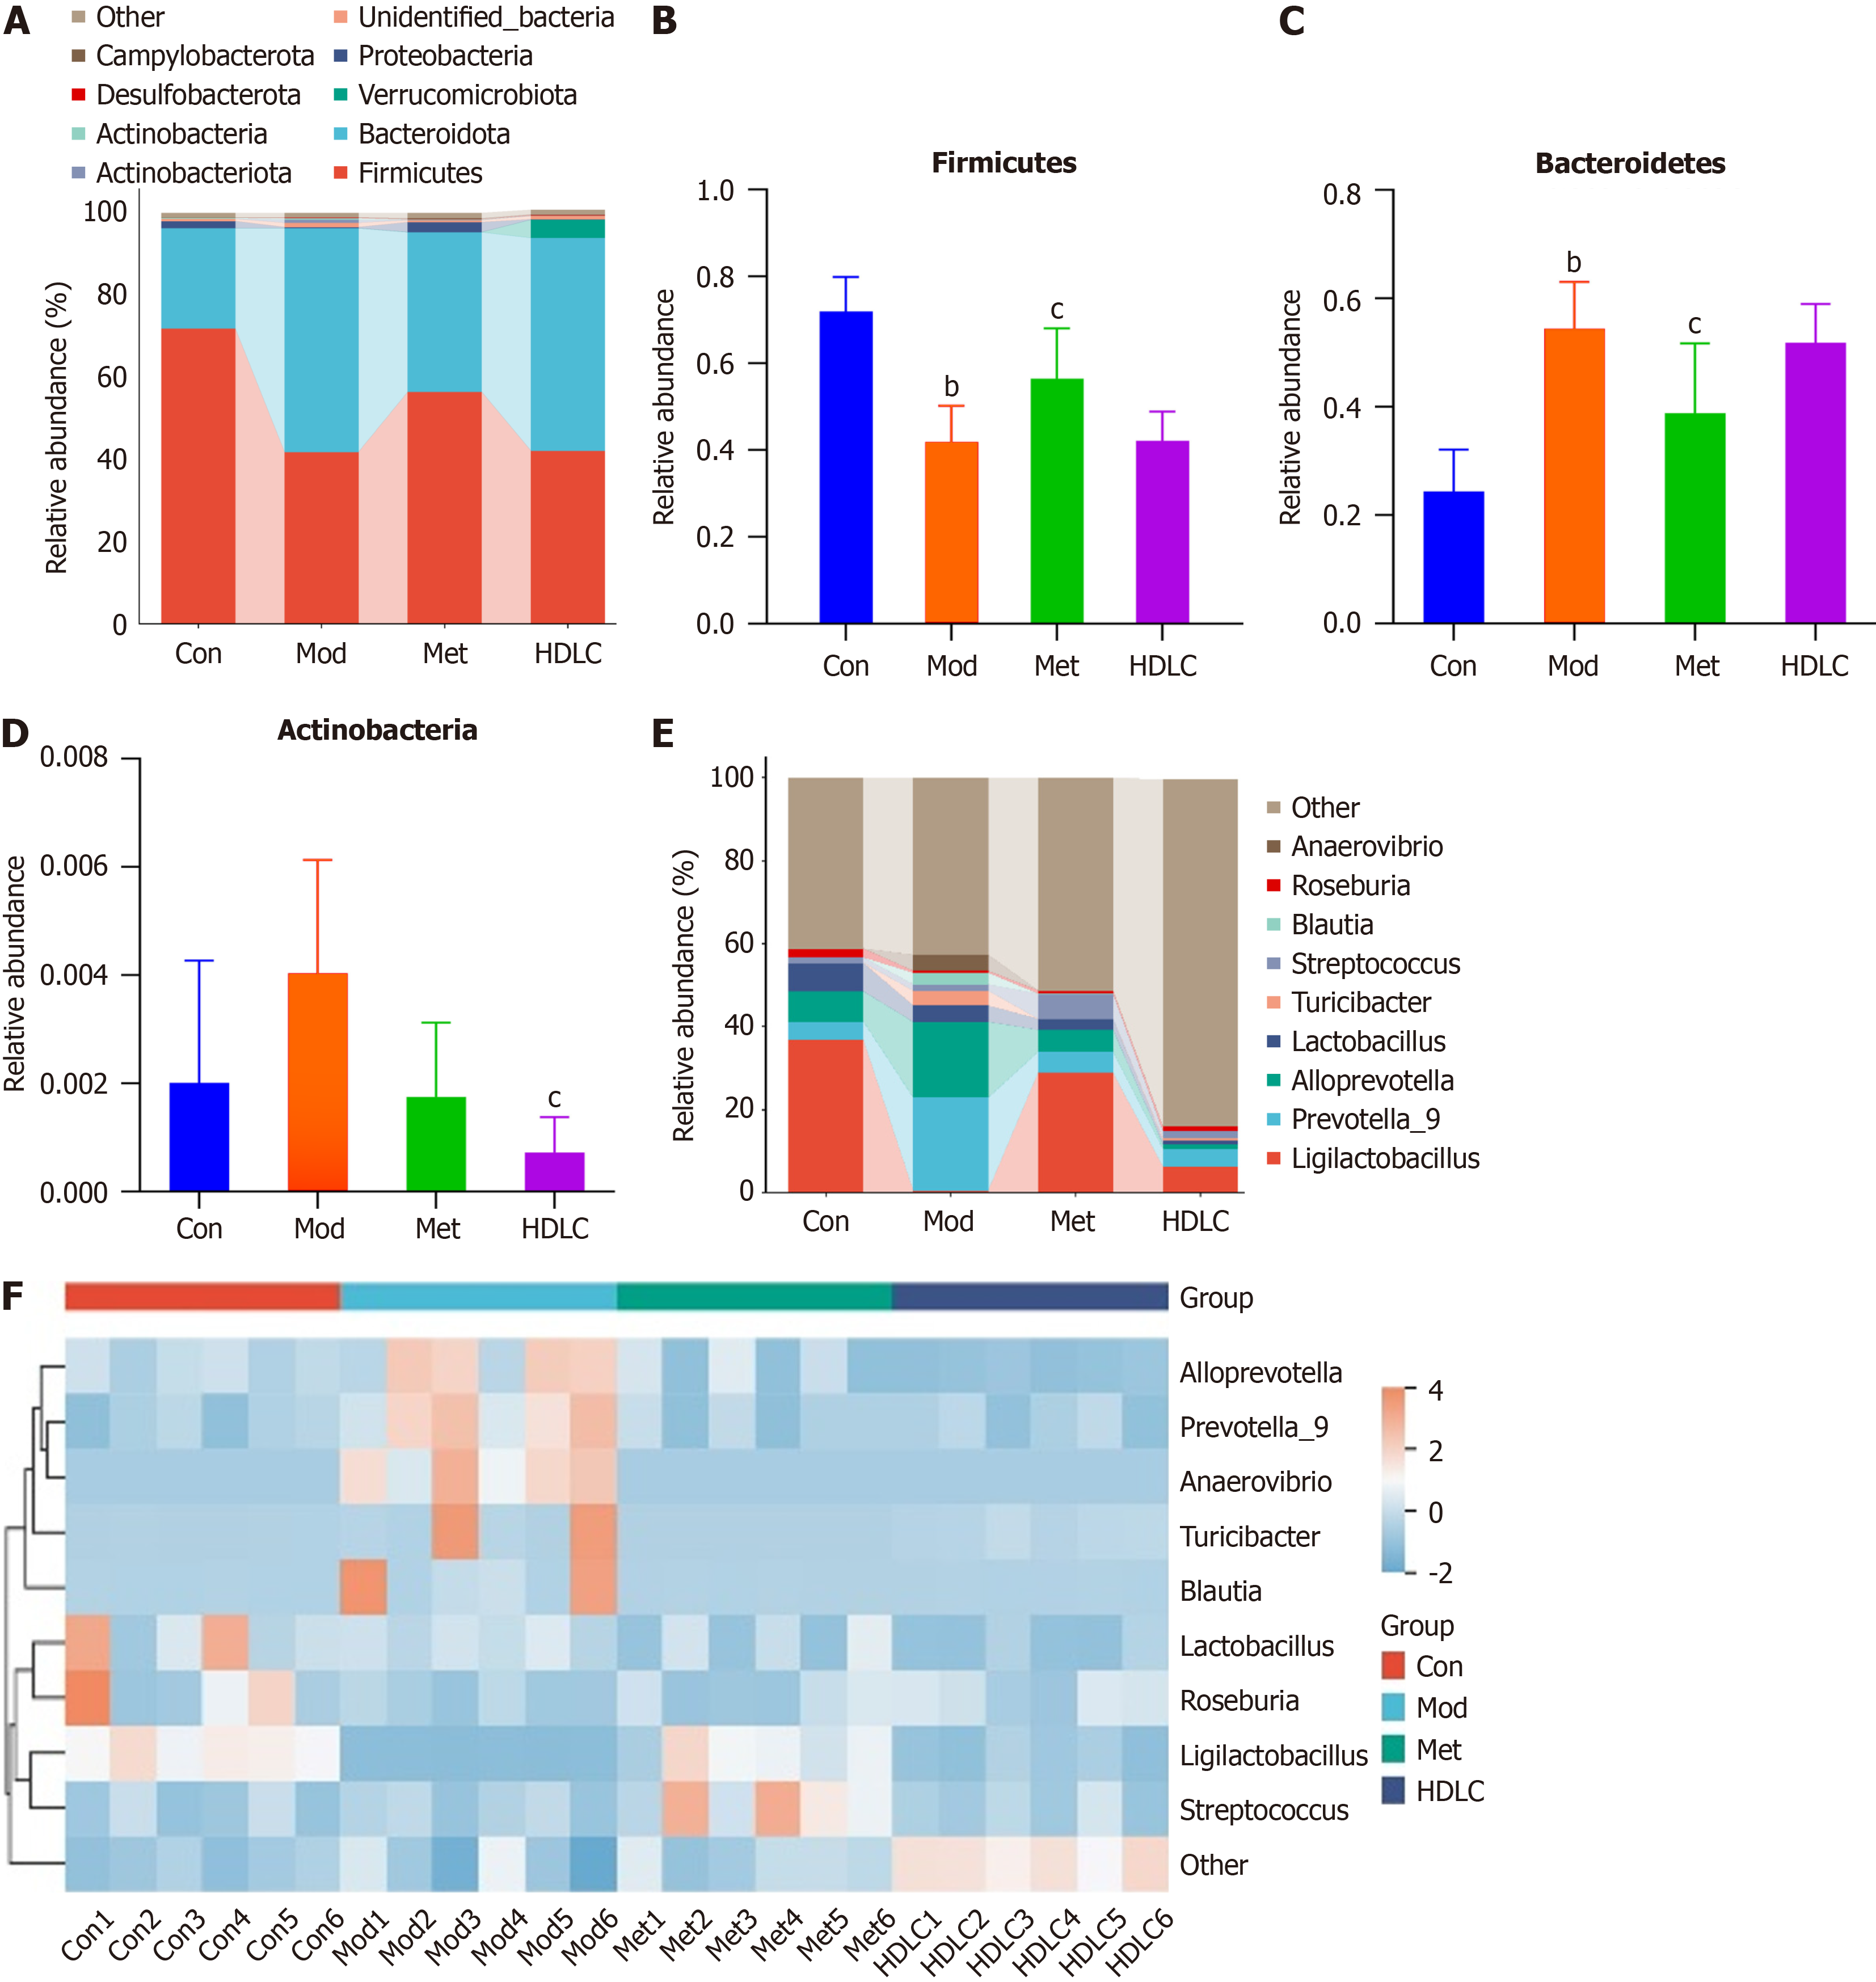
Figure 3 Alterations in the microbial composition at the phylum and genus levels.
A: The proportion of intestinal microbiota at the phylum level; B: The proportion of Firmicutes; C: The proportion of Bacteroidetes; D: The proportion of Actinobacteria; E: The proportion of gut microbiota at the genus levels; F: Community heatmap analysis on genus level. Results were expressed as mean ± SD (n = 6). bP < 0.01 vs the control group; cP < 0.05 vs the model group. Con: Control group; Mod: The model group; Met: The metformin group; HDLC: The high-dose group.
- Citation: Zheng PX, Lu CL, Liang YL, Ma YM, Peng JW, Xie JJ, Wei JL, Chen SS, Ma ZD, Zhu H, Liang J. Examining gut microbiota and metabolites to clarify mechanisms of Dimocarpus longan Lour leaf components against type 2 diabetes. World J Diabetes 2025; 16(7): 104512
- URL: https://www.wjgnet.com/1948-9358/full/v16/i7/104512.htm
- DOI: https://dx.doi.org/10.4239/wjd.v16.i7.104512


