
















Copyright: ©Author(s) 2026.
World J Gastrointest Oncol. Nov 15, 2026; 18(11): 124110
Published online Nov 15, 2026. doi: 10.4251/wjgo.124110
Published online Nov 15, 2026. doi: 10.4251/wjgo.124110
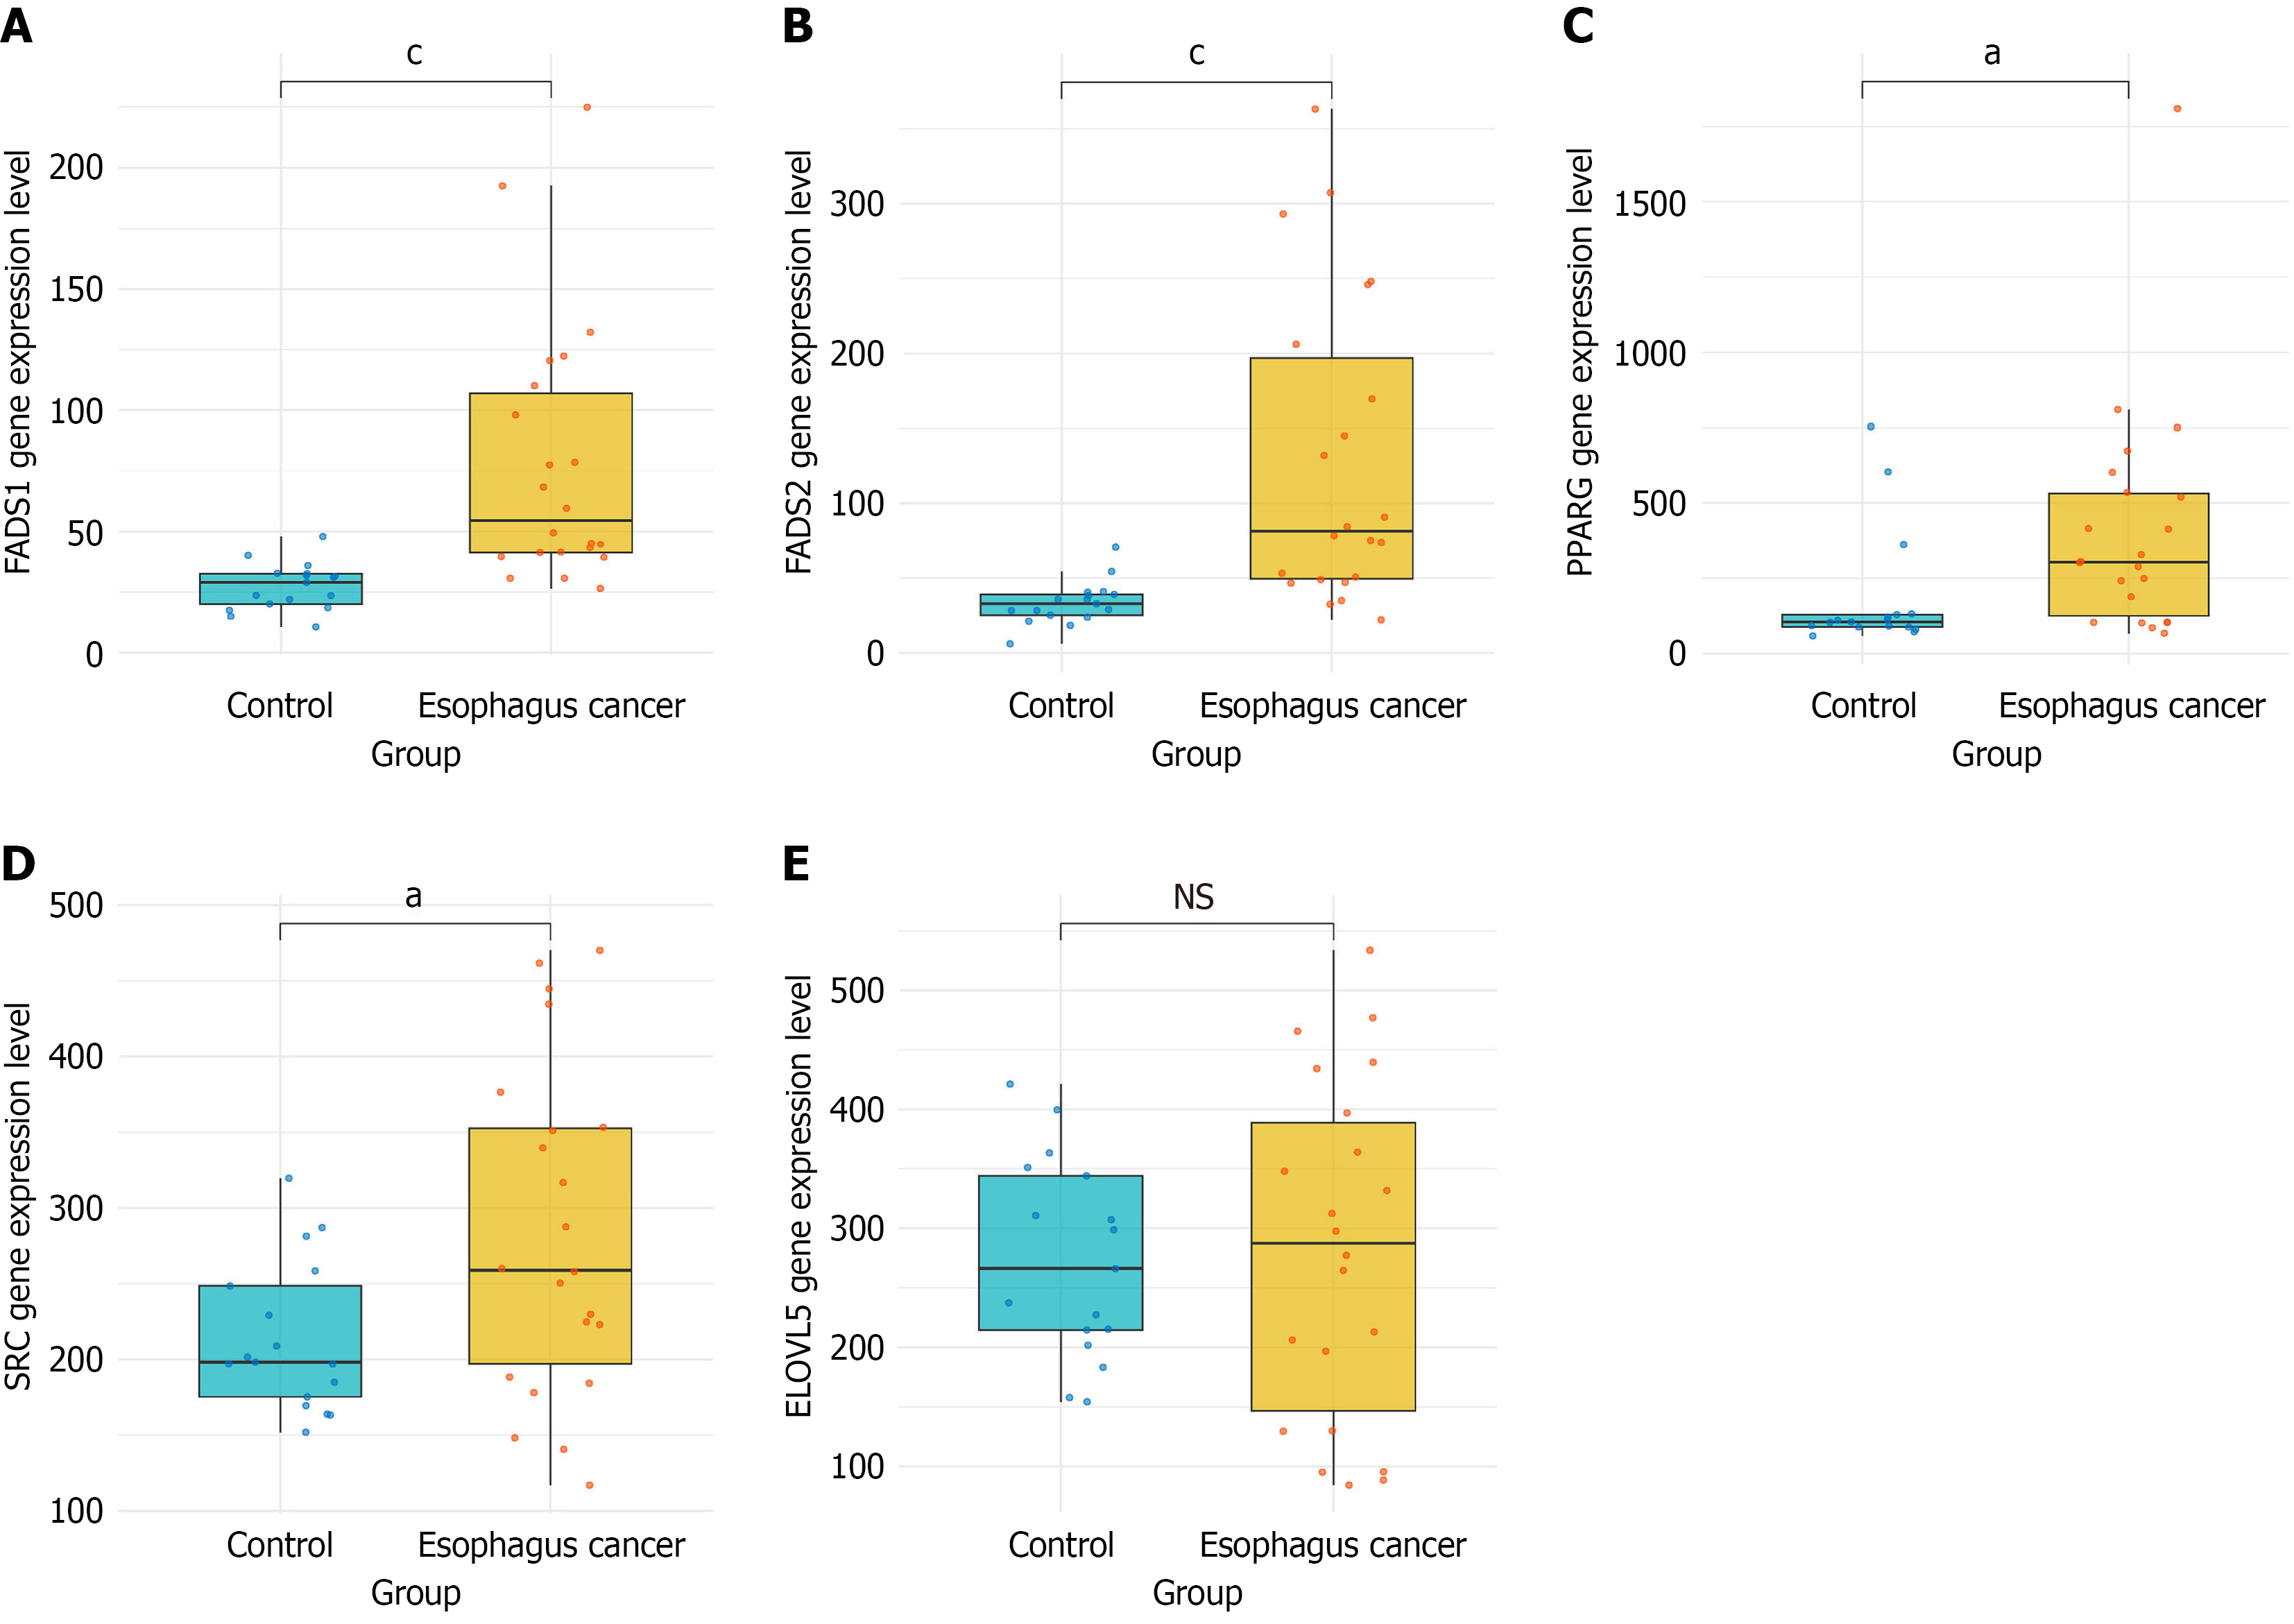
Figure 1 Expression levels of 5 genes in esophageal cancer tissues.
A: The expression level of fatty acid desaturase 1 in esophageal cancer tissues was significantly greater than that in normal esophageal tissue; B: The expression level of fatty acid desaturase 2 in esophageal cancer tissues was significantly greater than that in normal tissues; C: The expression level of elongation of very long chain fatty acids protein 5 in esophageal cancer tissues was significantly greater than that in normal tissues; D: The expression level of SRC proto-oncogene in esophageal cancer tissues was significantly greater than that in normal tissues; E: No significant difference in peroxisome proliferator-activated receptor gamma expression was detected between esophageal cancer and normal tissues. aP < 0.05, cP < 0.0001, NS: Not significant (P ≥ 0.05). FADS1: Fatty acid desaturase 1; FADS2: Fatty acid desaturase 2; ELOVL5: Elongation of very long chain fatty acids protein 5; SRC: SRC proto-oncogene (sarcoma gene); PPARG: Peroxisome proliferator-activated receptor gamma.
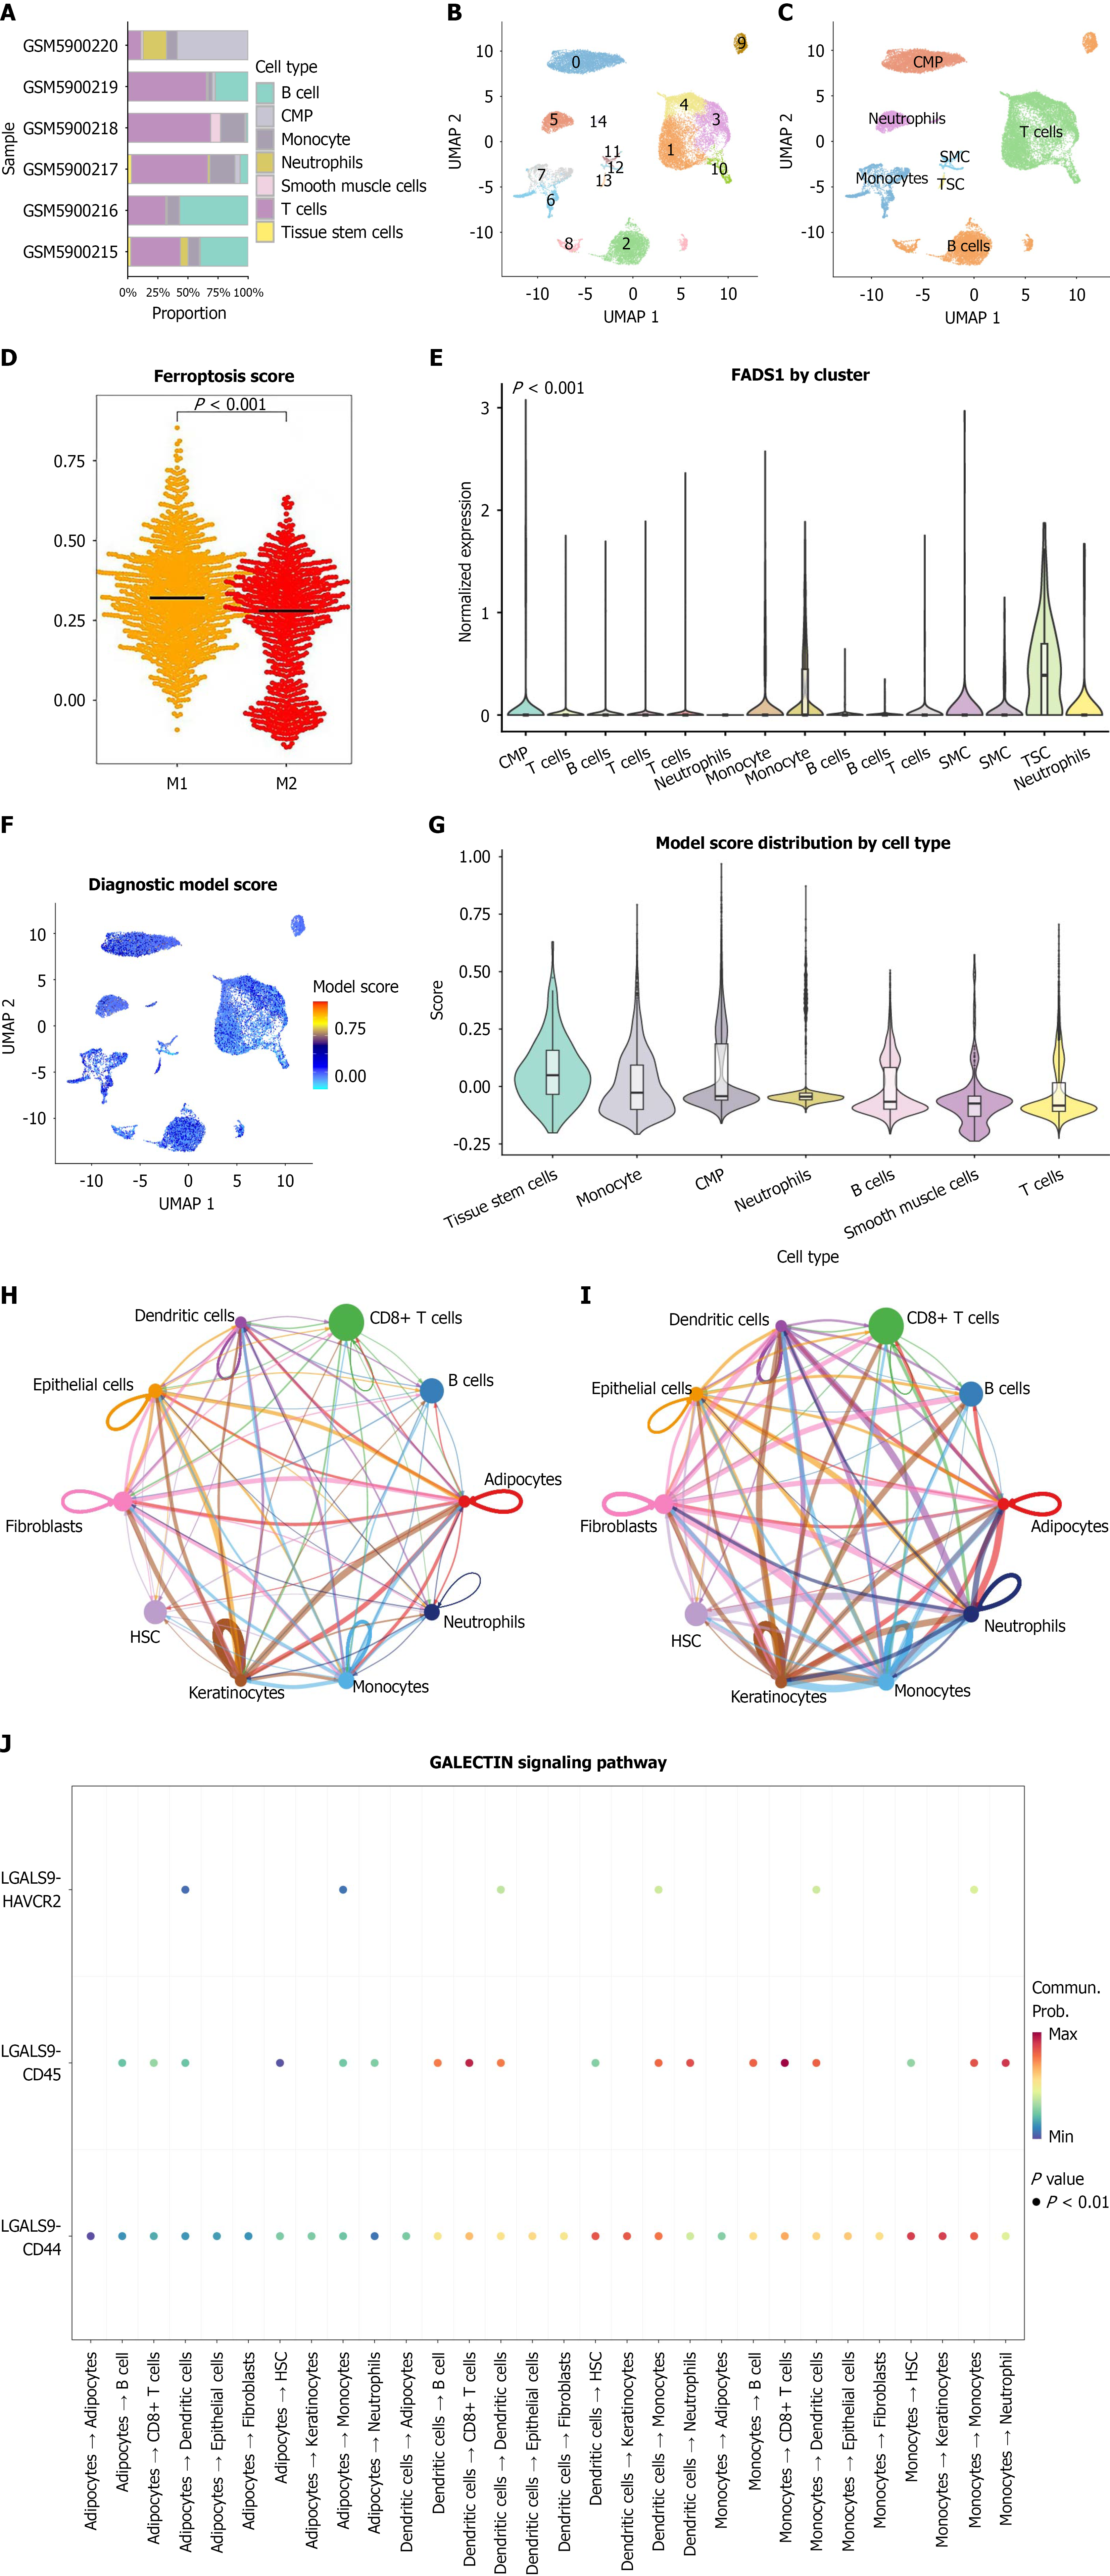
Figure 2 Single-cell transcriptomic landscape of the esophageal cancer microenvironment and distribution of fatty acid desaturase 1-associated signatures.
A: Bar plot of cell type proportions across samples; B: Uniform manifold approximation and projection (UMAP) plot illustrating the two-dimensional distribution characteristics of each cell type; C: UMAP plot of the 7 major cell types; D: Subclustering of macrophages showing fatty acid desaturase 1 enrichment in M1-like macrophages and ferroptosis scores in M1 vs M2 macrophages. Ferroptosis scores were calculated using single-sample gene set enrichment analysis; E: Violin plot showing fatty acid desaturase 1 expression across different cell types; F: UMAP plot of diagnostic model scores; G: Violin plot comparing diagnostic model scores across cell types; H: CellChat cell-cell communication network plot showing the number of ligand-receptor interactions among different cell types; I: CellChat network plot showing the strength (weight) of signaling interactions among cell types; J: Ligand-receptor network of the macrophage migration inhibitory factor and galactoside binding lectin signaling pathways. UMAP: Uniform manifold approximation and projection; CMP: Common myeloid progenitor; SMC: Smooth-muscle cell; TSC: Tumor stem cell; FADS1: Fatty acid desaturase 1; HSC: Hematopoietic stem cell.
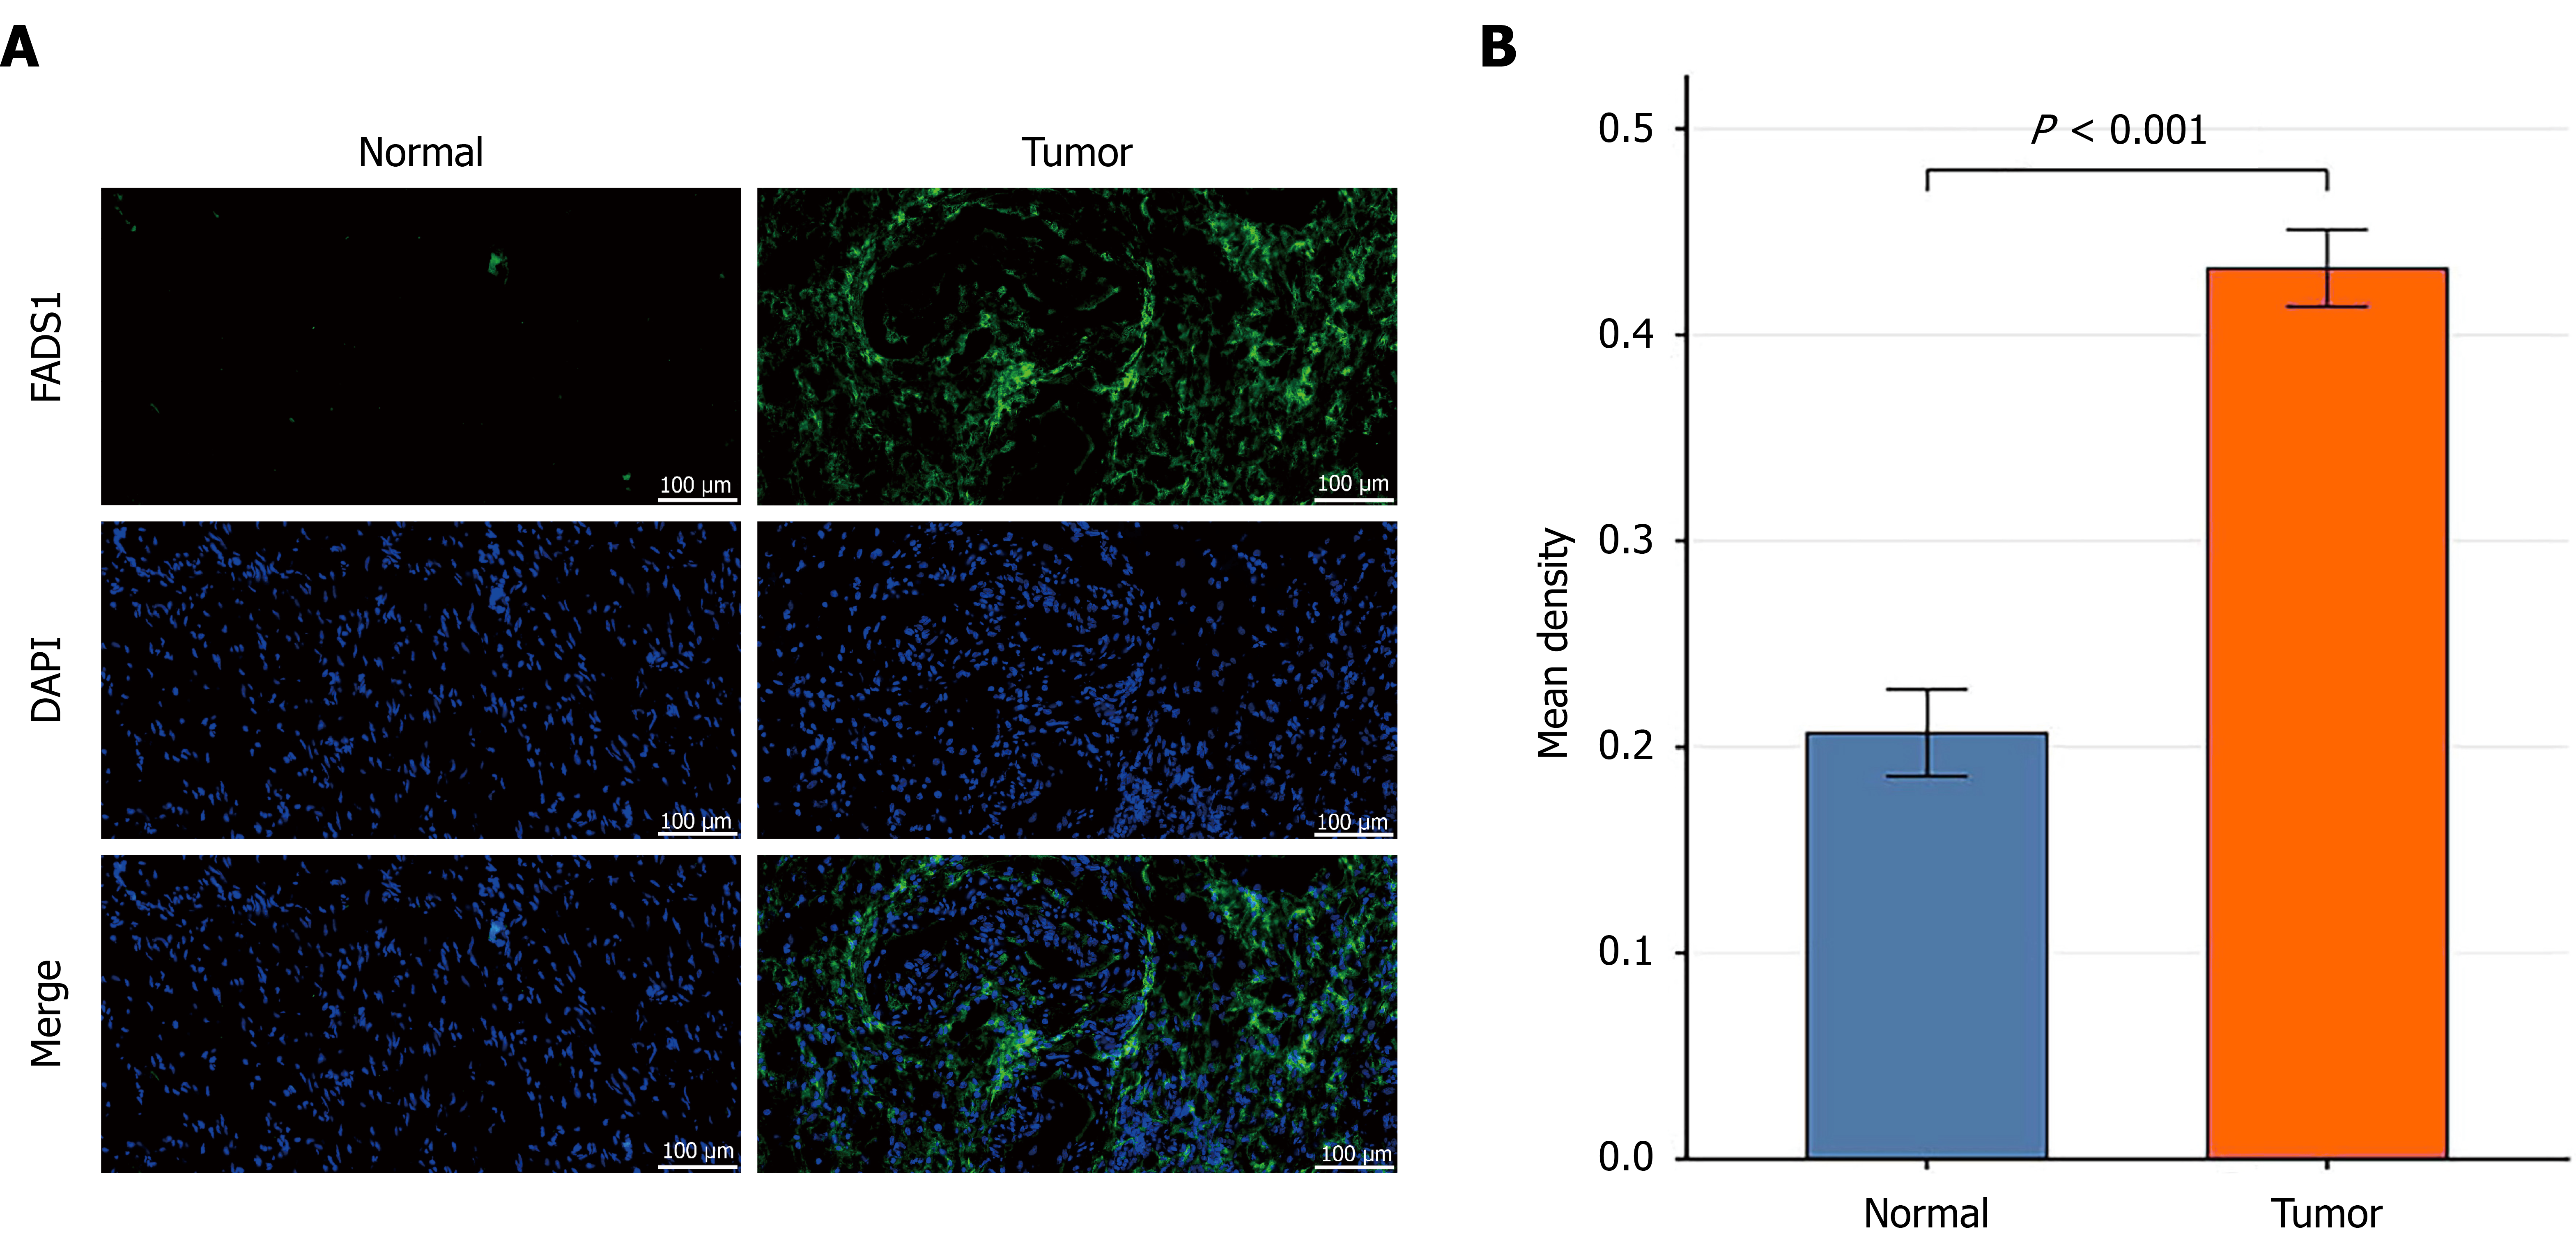
Figure 3 Fatty acid desaturase 1 is upregulated in esophageal cancer tissues.
A: Representative immunofluorescence images of fatty acid desaturase 1 (FADS1) in esophageal cancer and adjacent normal tissues. FADS1 is shown in green, and nuclei are stained with 4’,6-diamidino-2-phenylindole; B: Quantitative analysis of the mean fluorescence intensity (integrated optical density/area) of FADS1 in normal and tumor tissues. P < 0.001 vs the normal group. FADS1: Fatty acid desaturase 1; DAPI: 4’,6-diamidino-2-phenylindole.
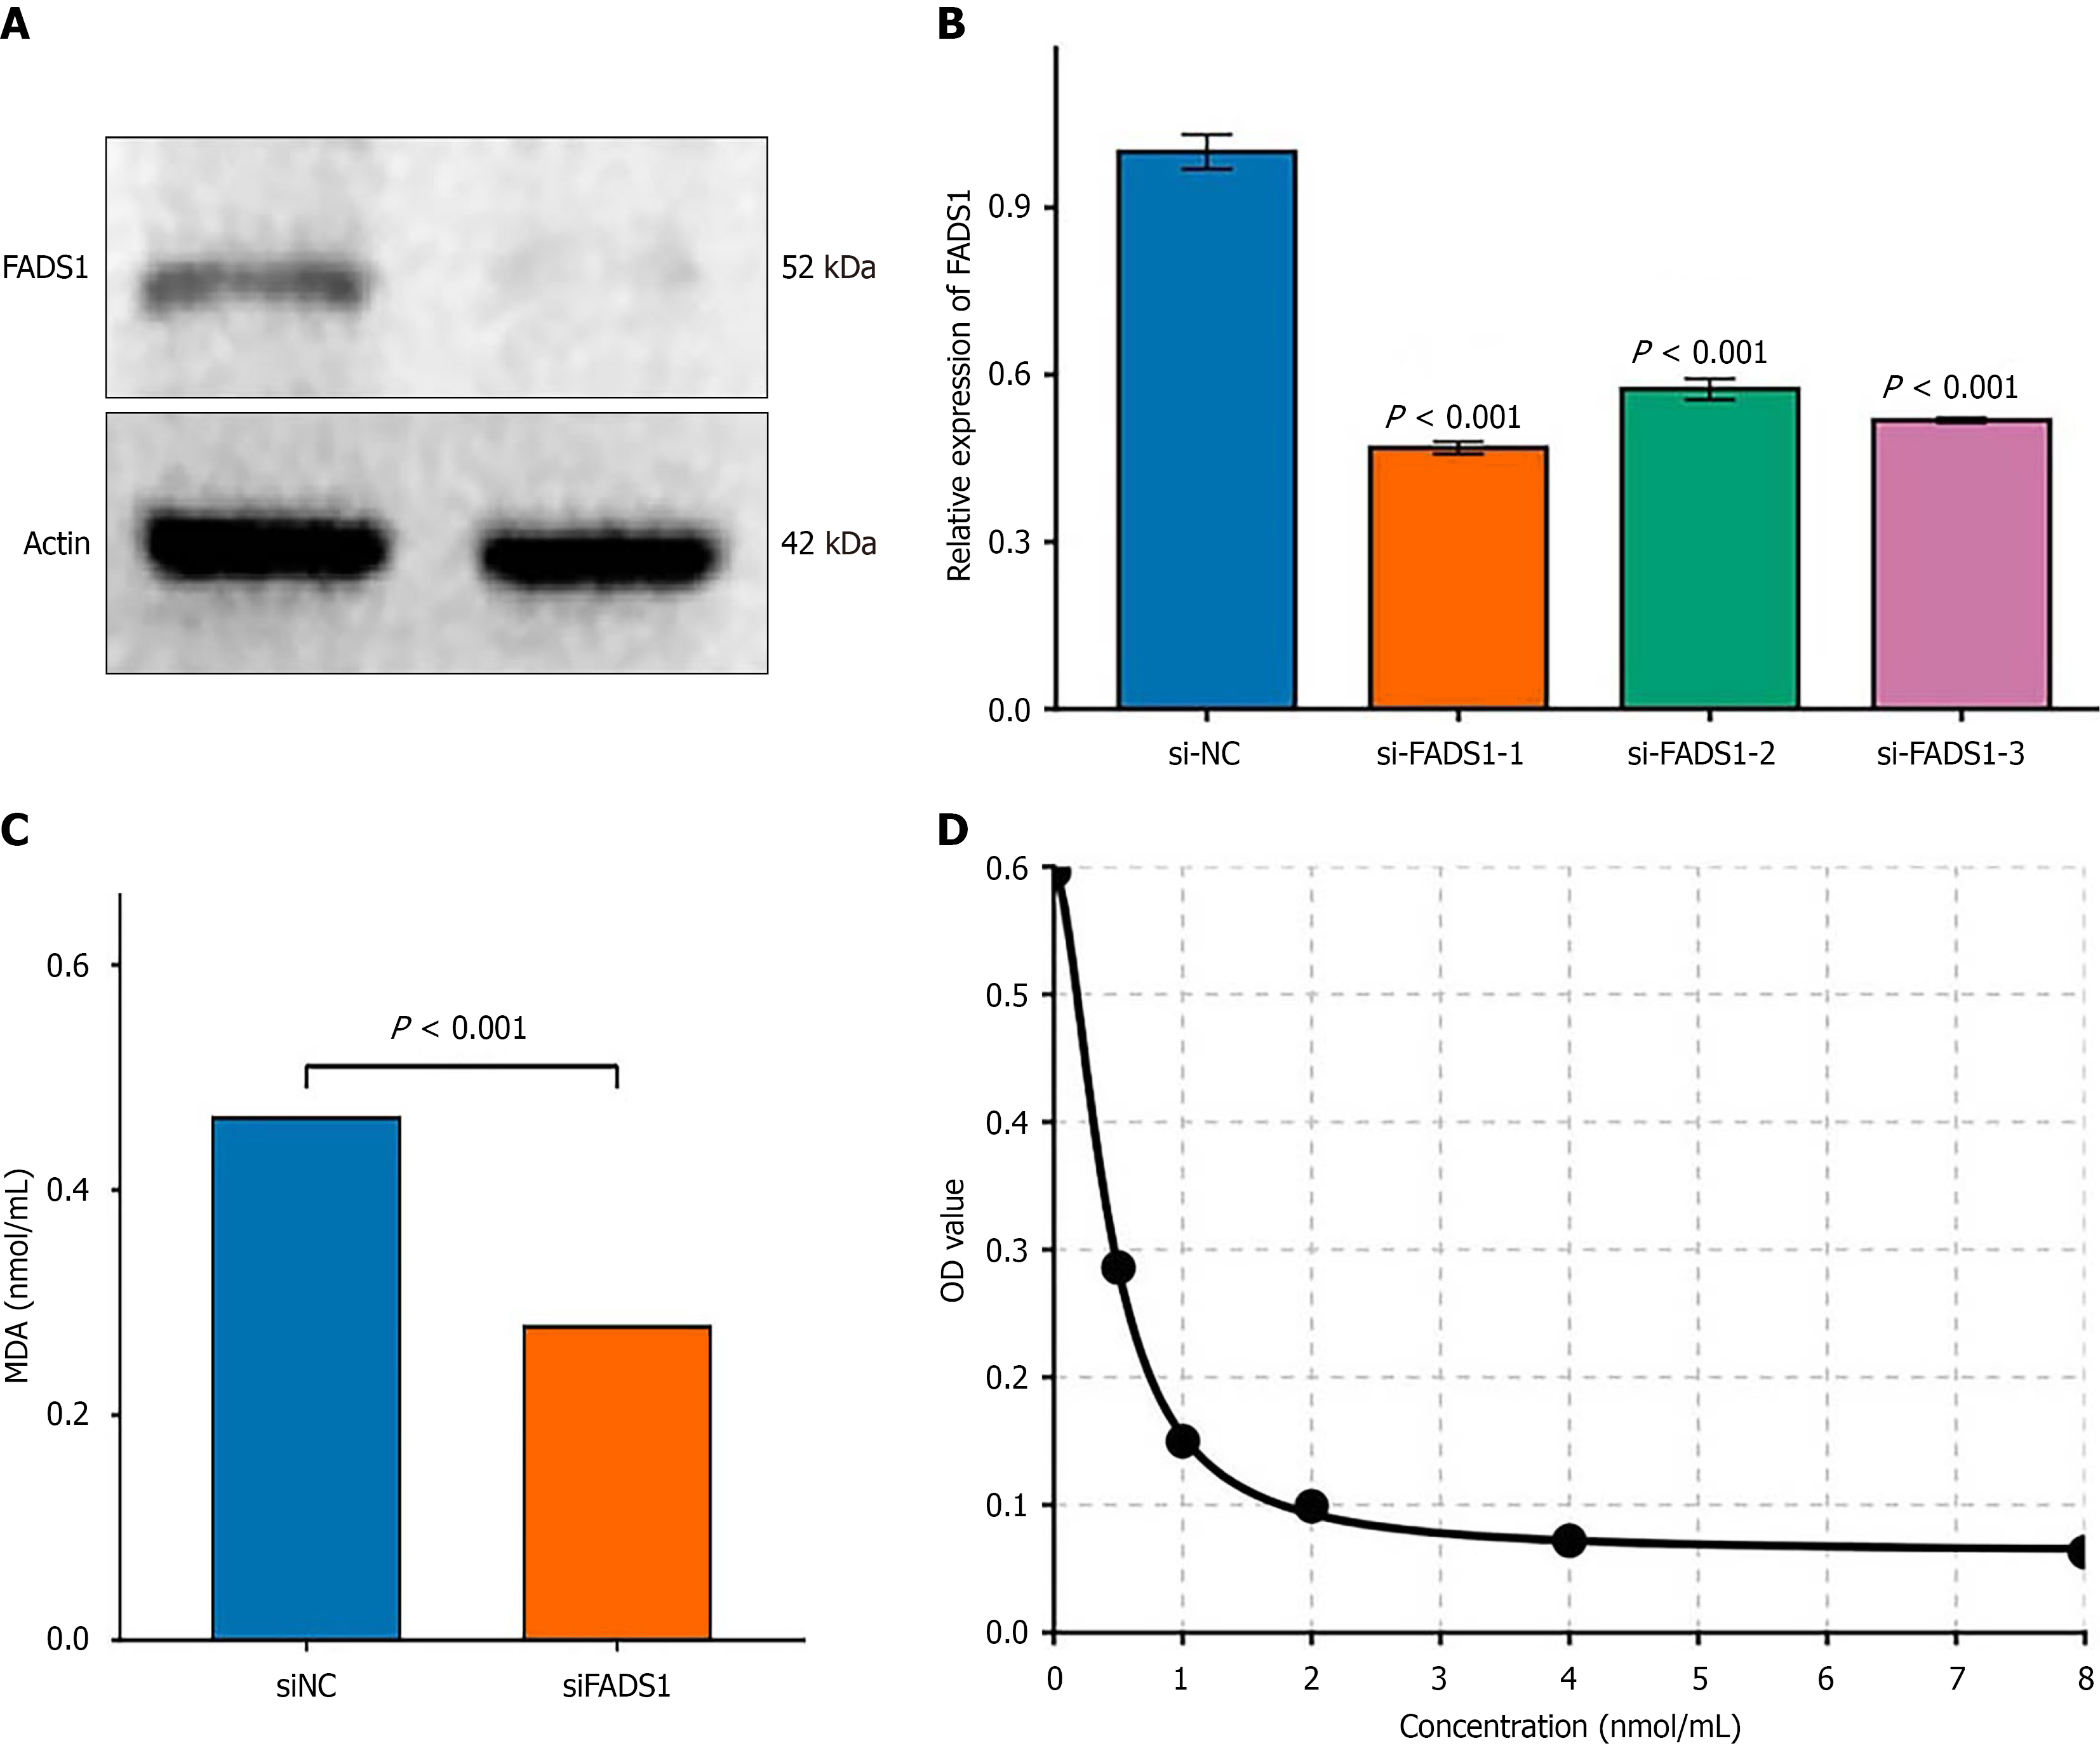
Figure 4 Fatty acid desaturase 1 knockdown reduces malondialdehyde levels and lipid peroxidation in M1 macrophages.
A: Western blot analysis of fatty acid desaturase 1 (FADS1) protein expression after knockdown; B: Relative FADS1 mRNA expression in macrophages transfected with siRNA negative control or si-FADS1; C: Malondialdehyde levels in M1 macrophages after FADS1 knockdown; D: Standard curve for malondialdehyde quantification. P < 0.001 vs siRNA negative control. FADS1: Fatty acid desaturase 1; MDA: Malondialdehyde; siNC: SiRNA negative control.
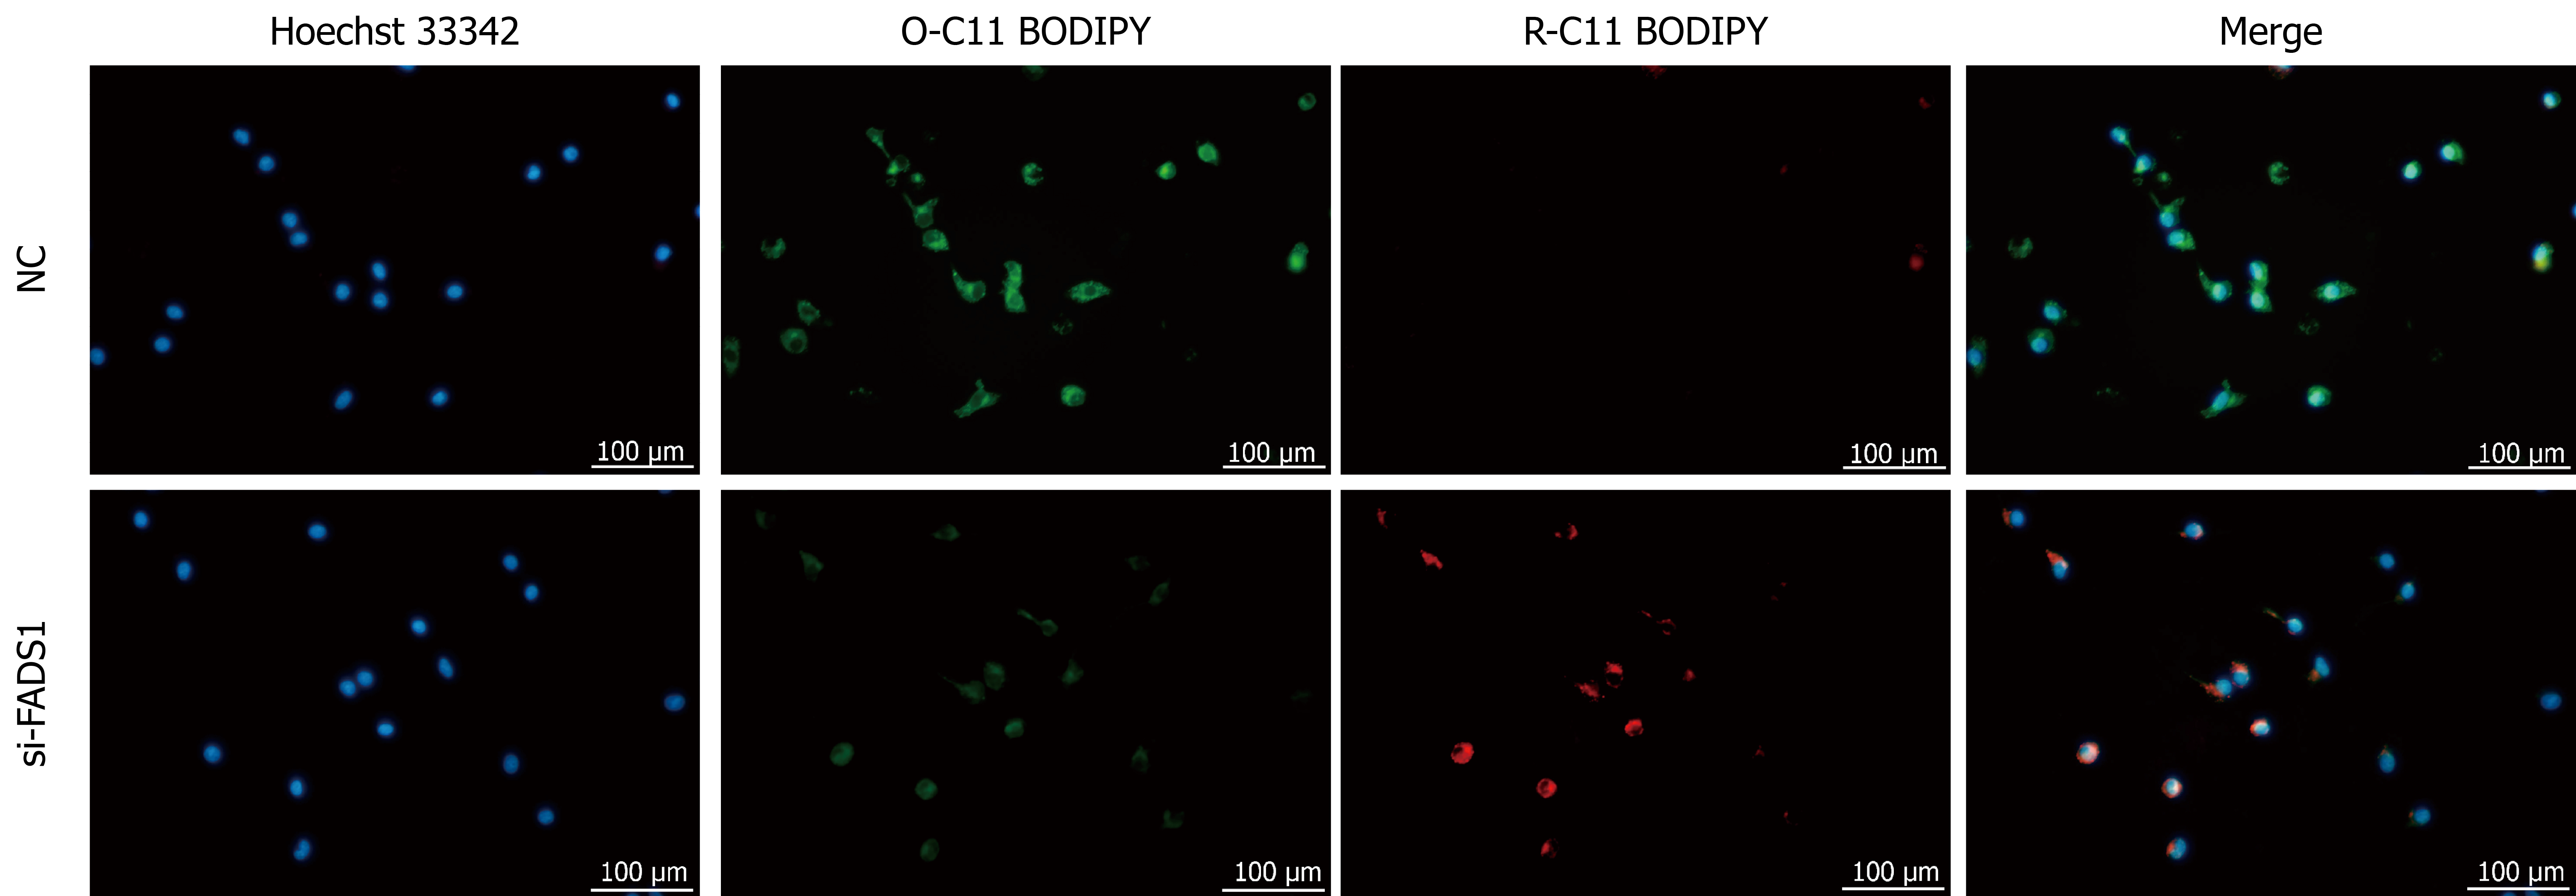
Figure 5 Fatty acid desaturase 1 knockdown attenuates lipid peroxidation in M1 macrophages.
M1 macrophages were transfected with siRNA negative control or si-fatty acid desaturase 1 for 48 hours, and lipid peroxidation was assessed using BODIPY™ 581/591 C11 staining. Representative fluorescence images show reduced green fluorescence (oxidized C11-BODIPY) and increased red fluorescence (reduced C11-BODIPY) in si-fatty acid desaturase 1-treated cells compared with those in siRNA negative controls, indicating decreased lipid peroxidation. FADS: Fatty acid desaturase; NC: Negative control.
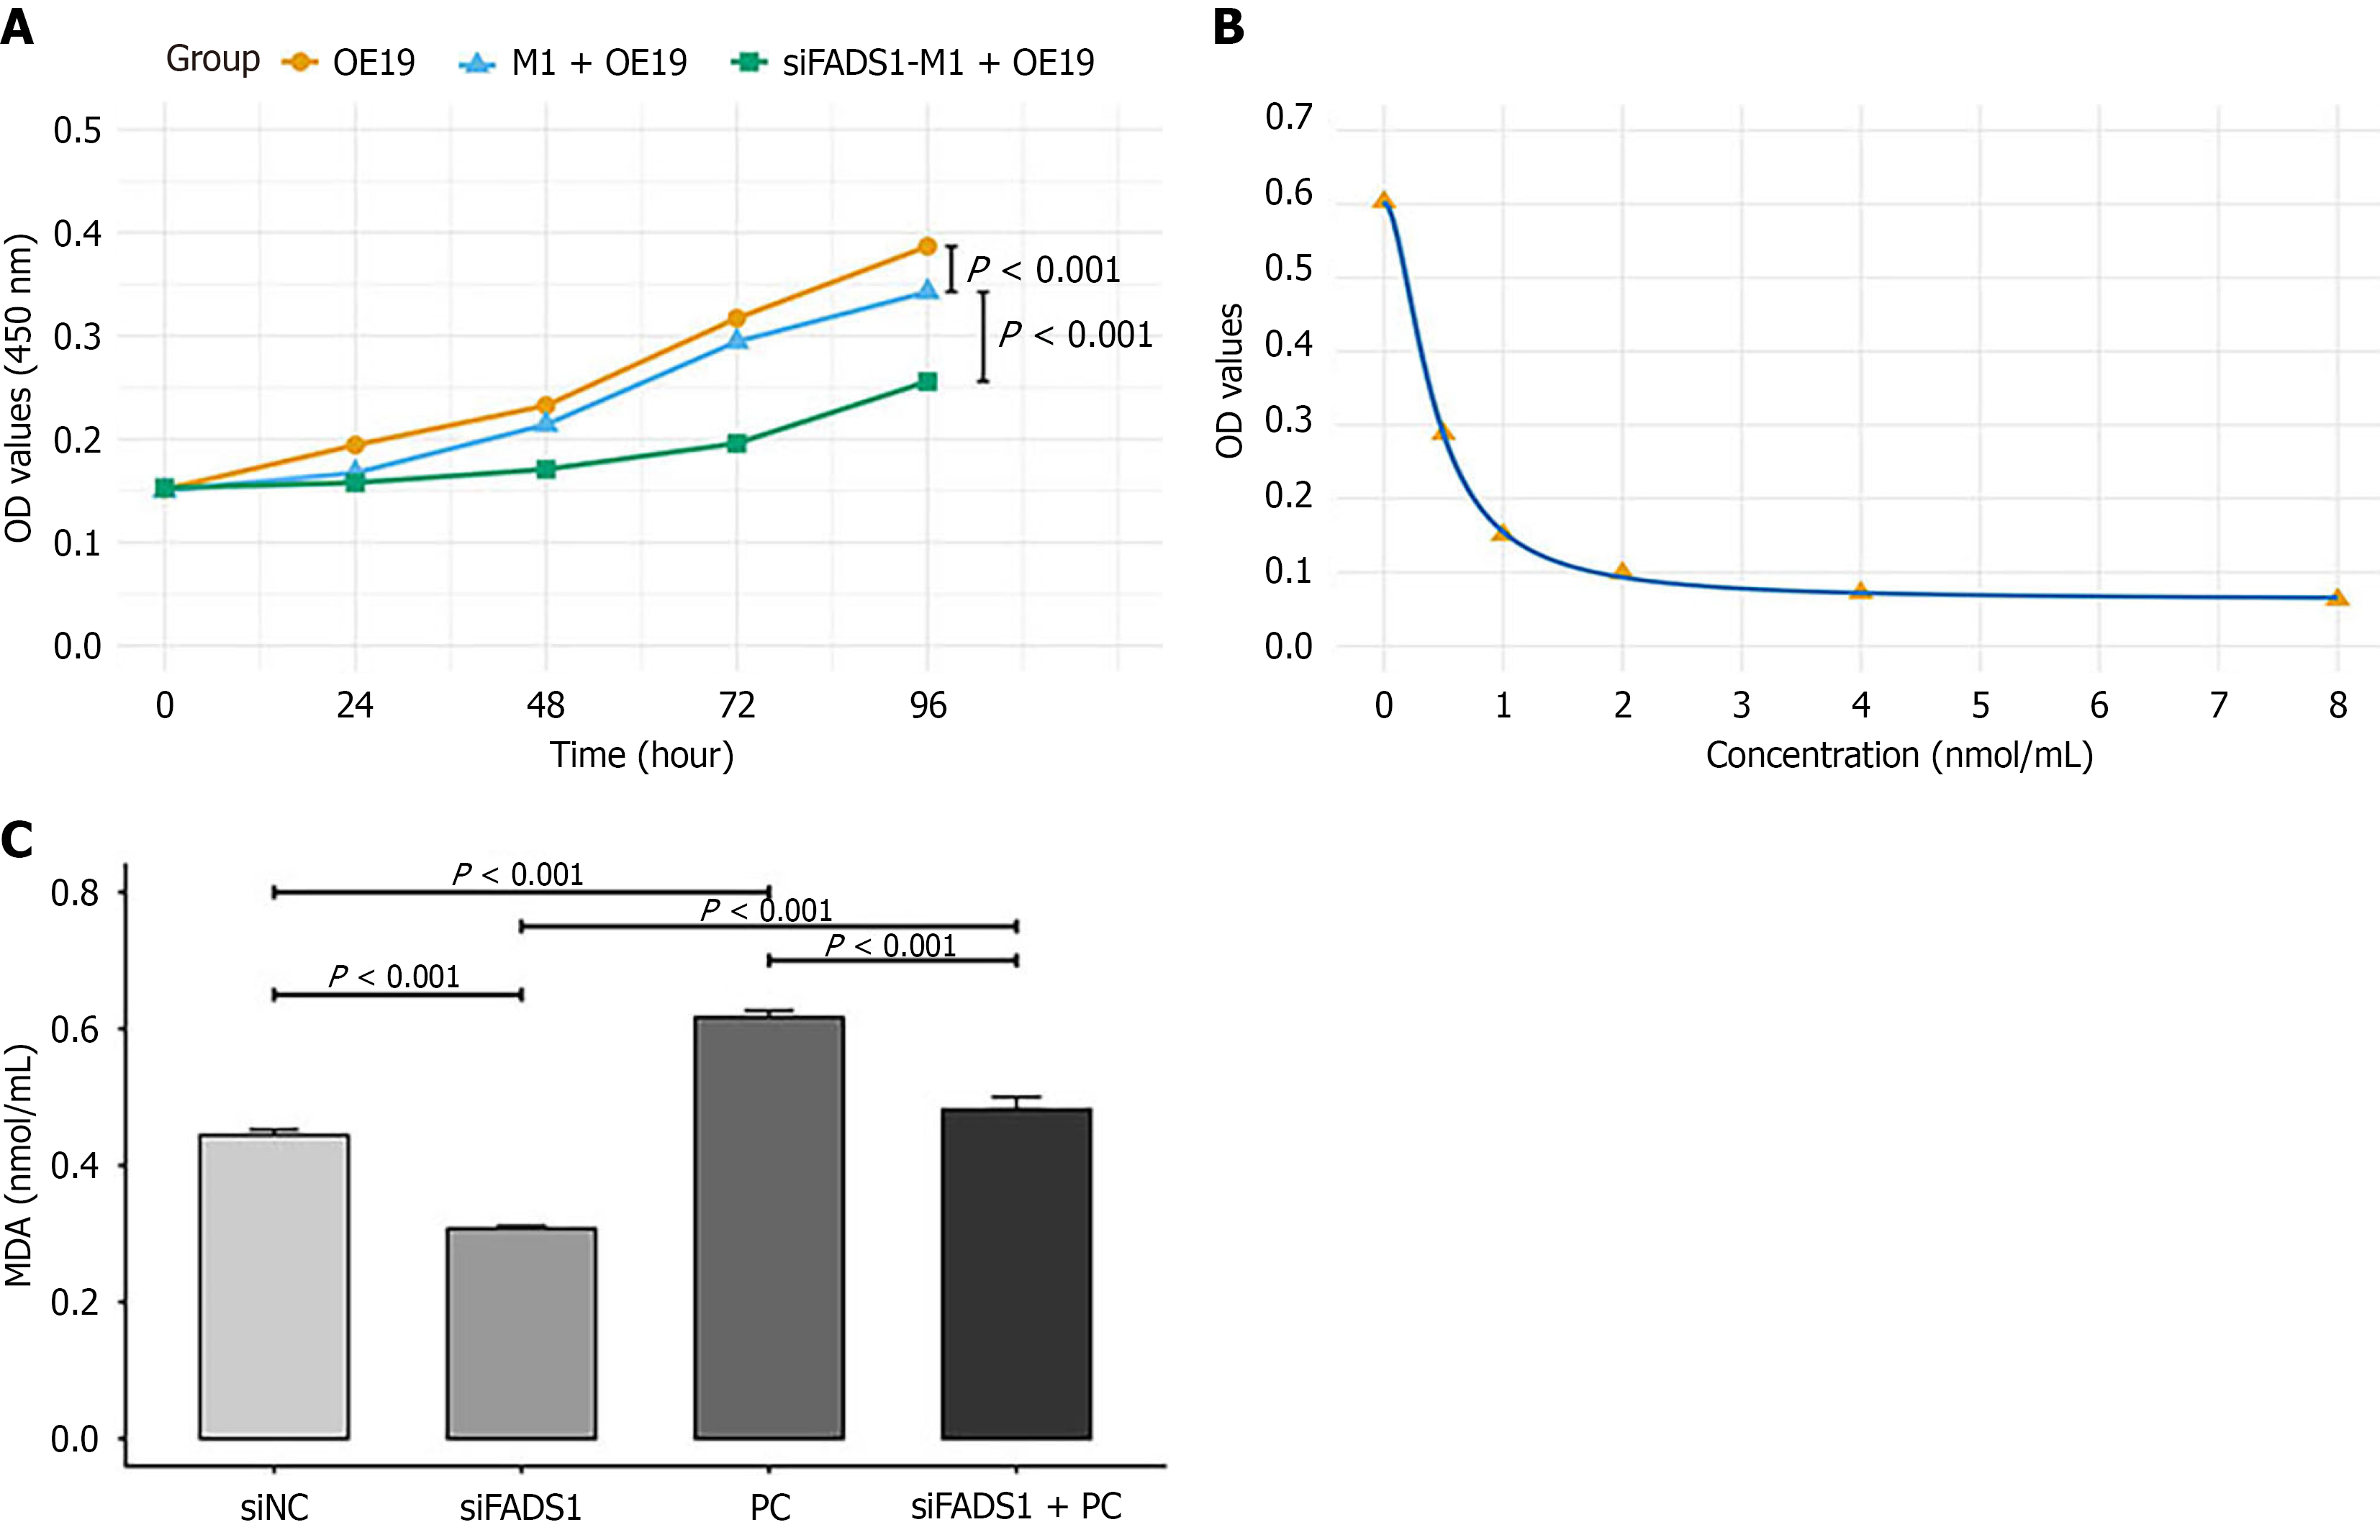
Figure 6 Fatty acid desaturase 1 promotes M1 macrophage ferroptosis via 1-palmitoyl-2-stearoyl-glycerophosphocholine (16:0/18:0).
A: OE-19 cells were cultured alone or cocultured with M1 macrophages transfected with siRNA negative control or si-fatty acid desaturase 1-1 in a transwell system for 96 hours. Cell viability was assessed by a cell counting kit-8 assay at the indicated time points and expressed as optical density at 450 nm values. The data are shown as the mean ± SD of three independent experiments (n = 6 replicates per group); B and C: M1 macrophages were transfected with siRNA negative control or si-fatty acid desaturase 1-1 and treated with or without 10 μM phosphatidylcholine (16:0/18:0) for 24 hours, after which the malondialdehyde concentration was measured. The data are presented as the mean ± SD from three independent experiments. FADS: Fatty acid desaturase; MDA: Malon
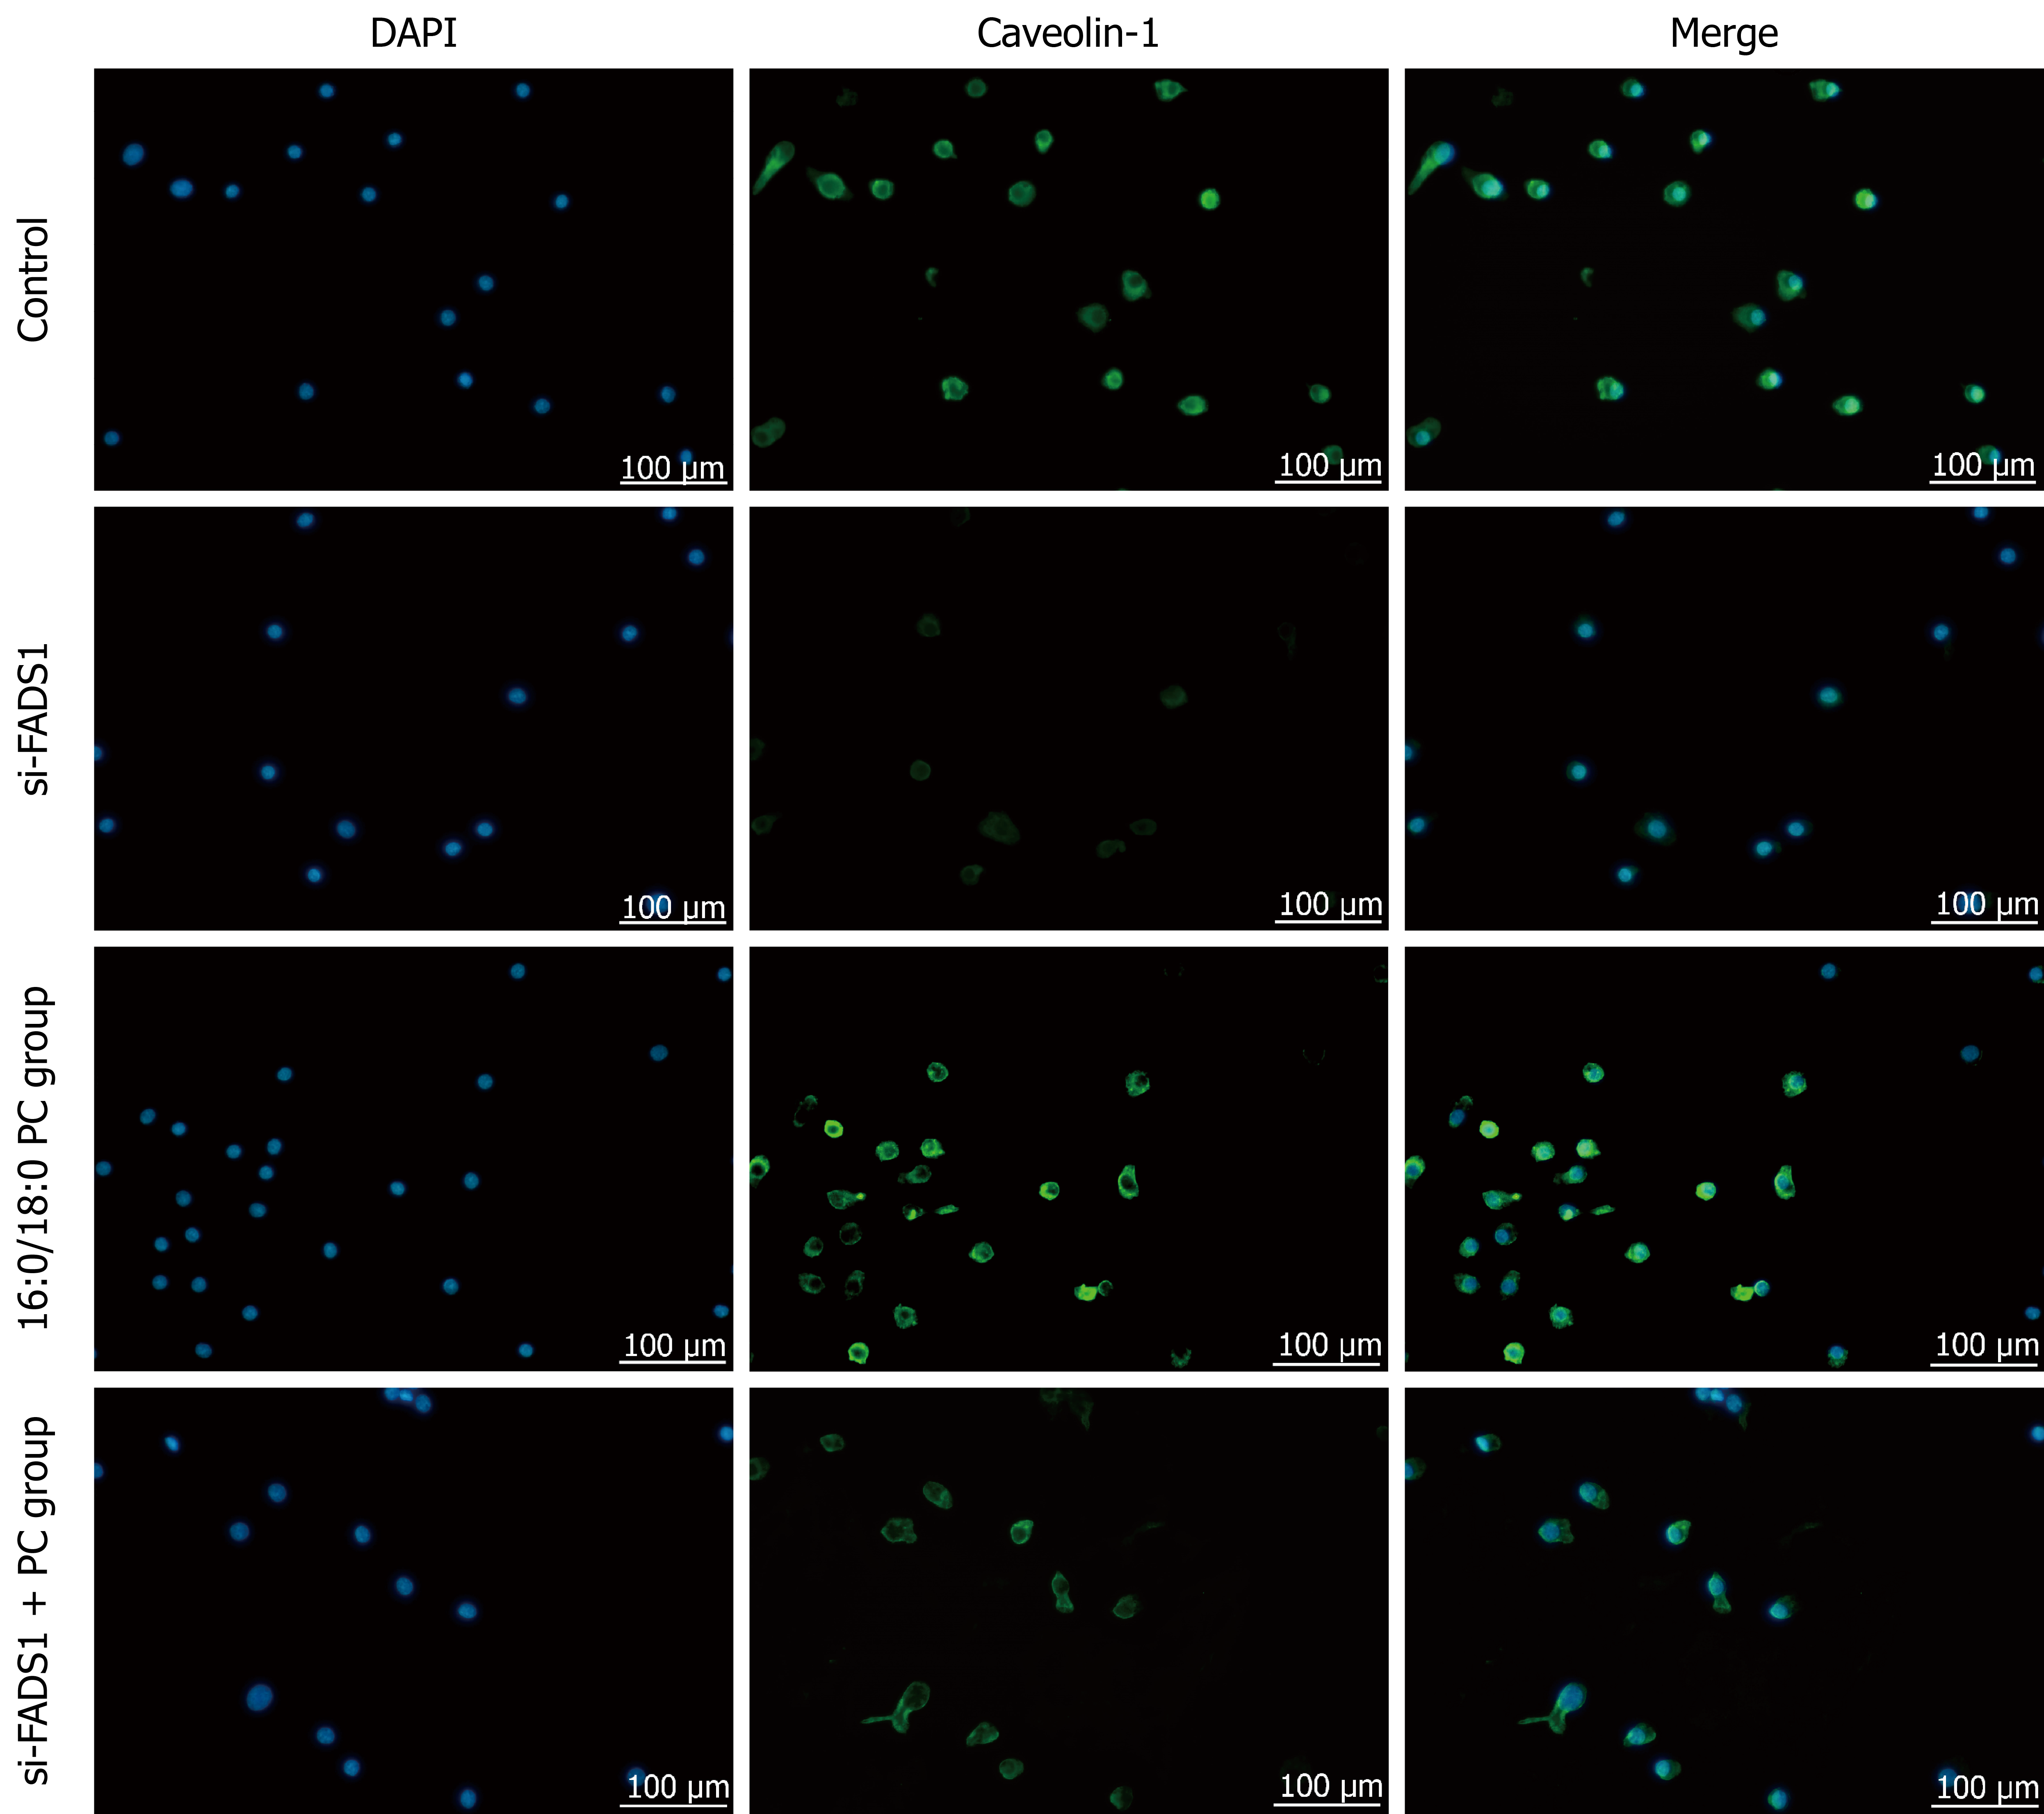
Figure 7 Fatty acid desaturase 1 promotes lipid raft formation in M1 macrophages via 1-palmitoyl-2-stearoyl-glycerophosphocholine (16:0/18:0).
M1 macrophages were divided into four groups: Control (siRNA negative control), fatty acid desaturase 1 knockdown (si-FADS1), phosphatidylcholine (PC) (16:0/18:0) treatment, and si-FADS1 combined with PC treatment (si-FADS1 + PC). Lipid raft formation was assessed by immunofluorescence staining for caveolin-1 (green), with nuclei counterstained with 4’,6-diamidino-2-phenylindole (blue). Representative fluorescence images show that caveolin-1 fluorescence intensity was significantly lower in the si-FADS1 group than in the siRNA negative control group, markedly increased in the PC treatment group, and partially restored by PC treatment in si-FADS1 cells (si-FADS1 + PC). FADS: Fatty acid desaturase; PC: Phosphatidylcholine; DAPI: 4’,6-diamidino-2-phenylindole.
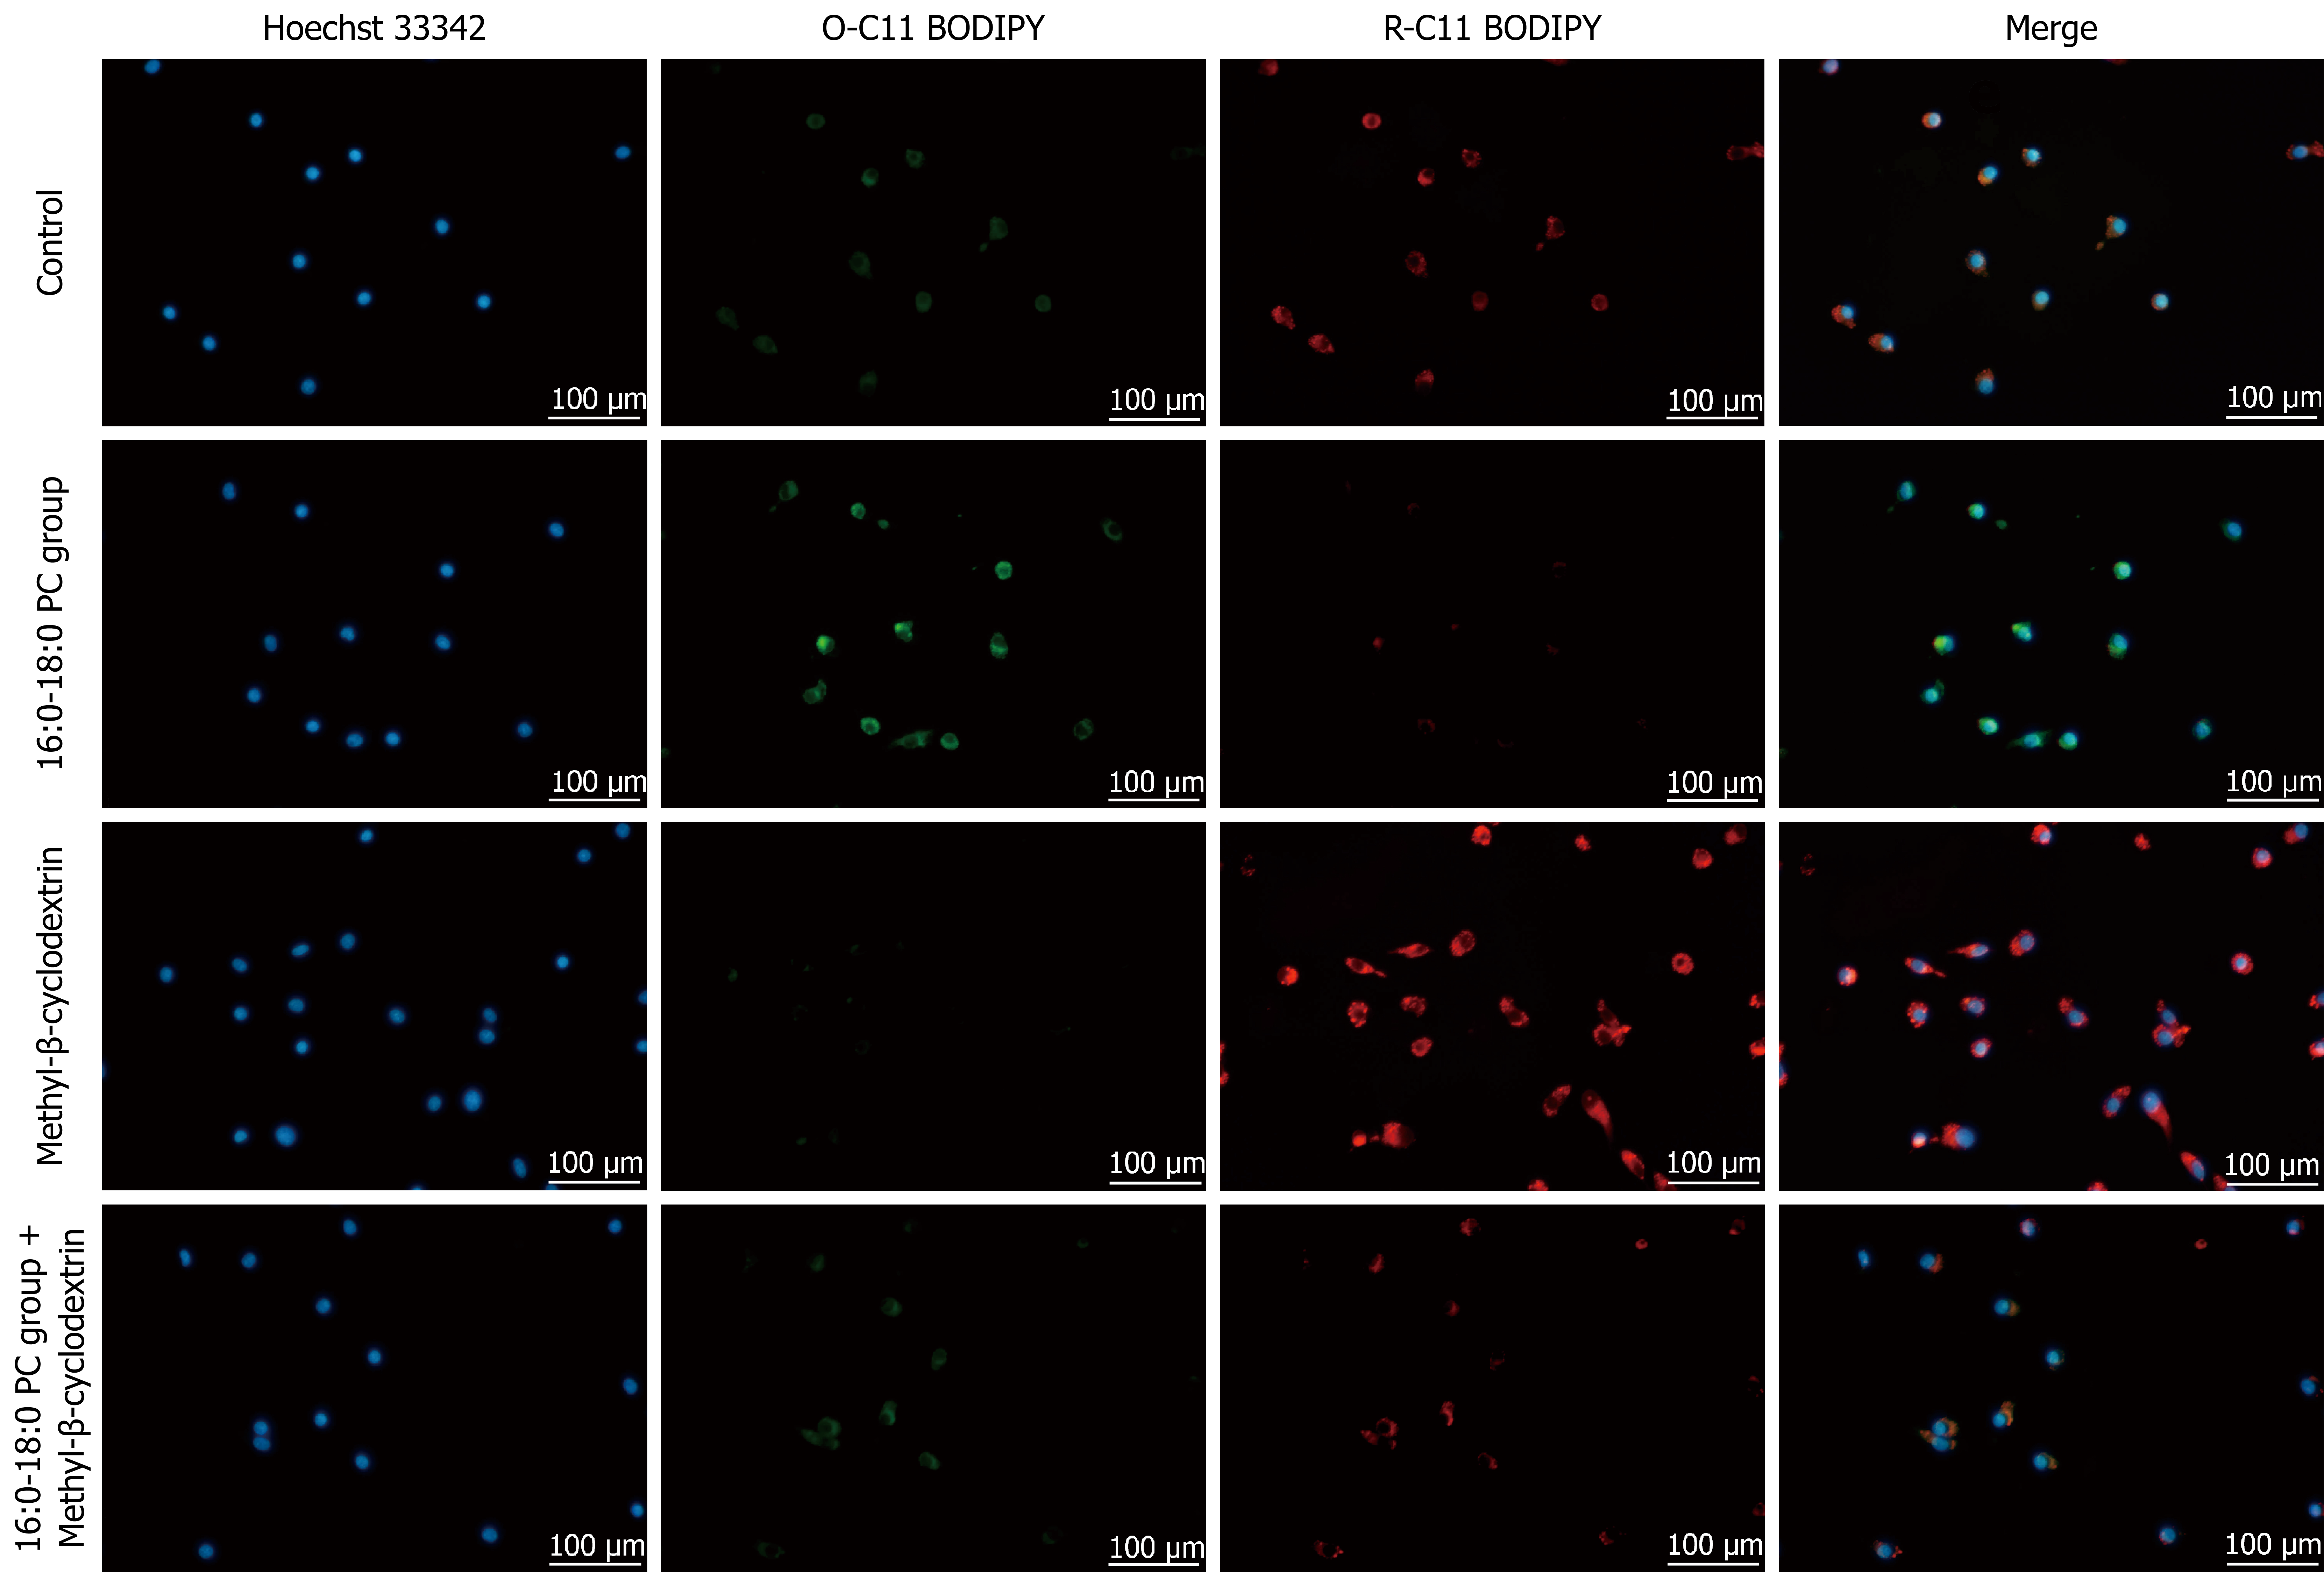
Figure 8 1-palmitoyl-2-stearoyl-glycerophosphocholine promotes ferroptosis in M1 macrophages via lipid rafts.
M1 macrophages were divided into four groups: Control (negative control), phosphatidylcholine (PC) (16:0/18:0) treatment, lipid raft inhibitor methyl-β-cyclodextrin treatment (MβCD), and combined treatment with PC and MβCD (PC + MβCD). Lipid peroxidation was assessed using the BODIPY™ 581/591 C11 probe, with the nuclei counterstained with Hoechst 33342. Representative fluorescence images show that control cells exhibited moderate green fluorescence (oxidized C11-BODIPY, O-C11), indicating basal lipid peroxidation. PC treatment markedly increased green fluorescence and decreased red fluorescence (reduced C11-BODIPY, R-C11), reflecting elevated lipid peroxidation. MβCD treatment alone reduced green fluorescence and enhanced red fluorescence, suggesting the inhibition of lipid peroxidation. Notably, compared with the PC treatment, the MβCD treatment significantly reversed the PC-induced increase in lipid peroxidation, as evidenced by decreased O-C11 BODIPY and increased R-C11 BODIPY fluorescence. PC: Phosphatidylcholine.
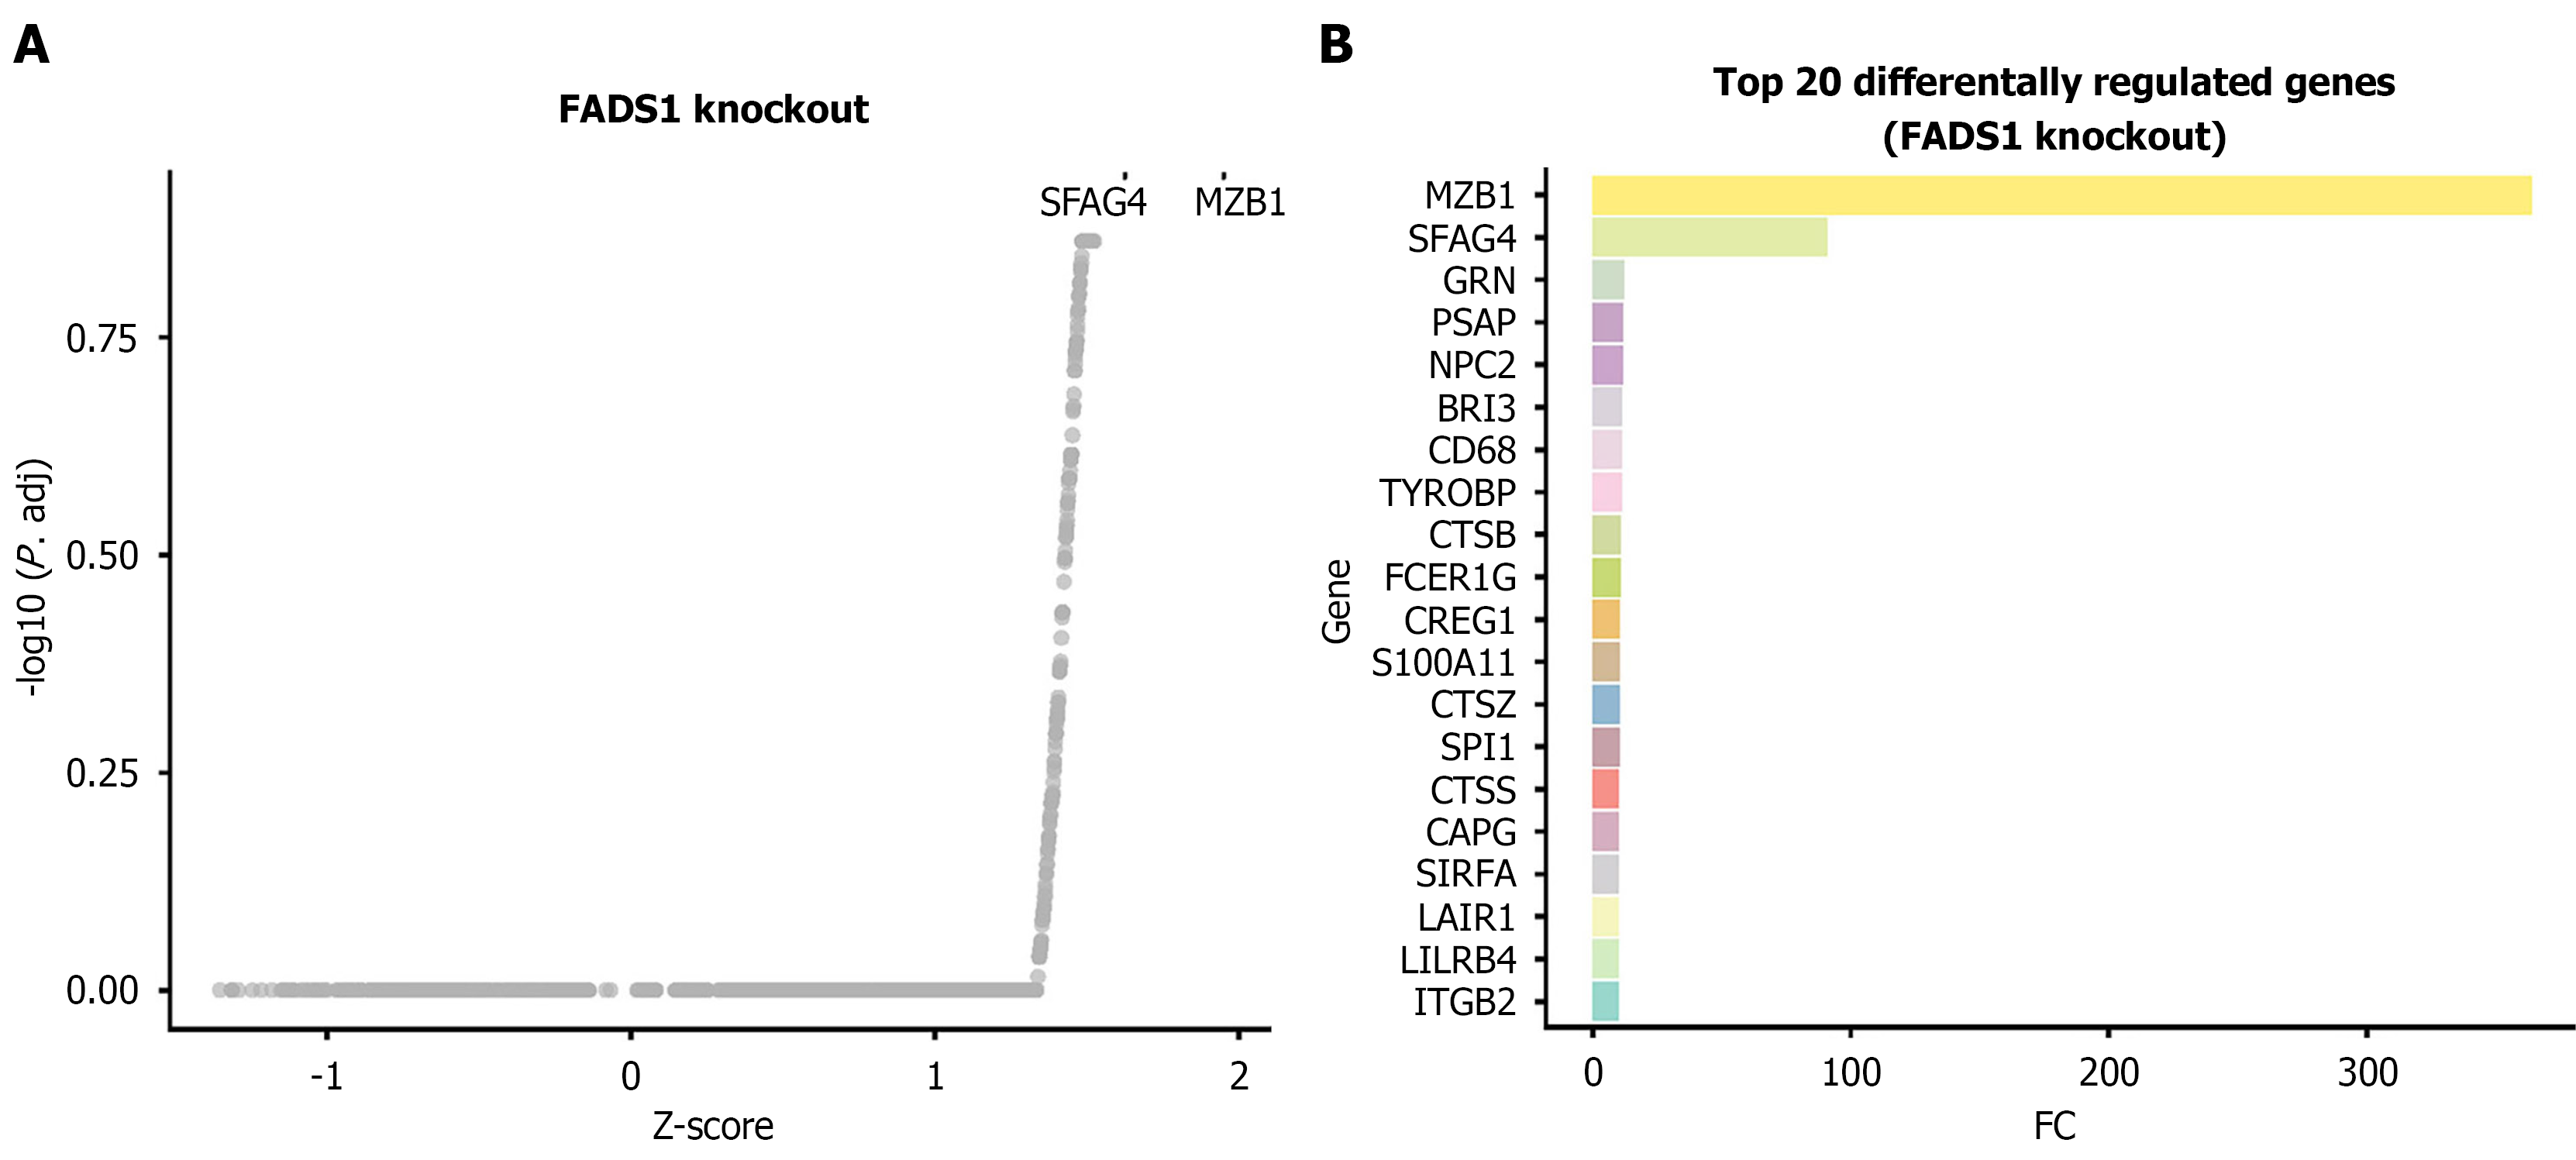
Figure 9 Impact of virtual fatty acid desaturase 1 knockout on the gene regulatory network in monocytes/macrophages.
A: Scatter plot showing the distribution of differentially expressed genes following fatty acid desaturase 1 knockout. The X-axis represents the Z score (differential regulation score), and the Y-axis represents the negative logarithm of the adjusted P value. Positive Z scores indicate upregulated regulatory activity after knockout (positive regulation), whereas negative values indicate downregulation. The dashed line indicates the significance threshold (adjusted P value < 0.05); B: Bar plot displaying the top 20 genes most significantly affected by fatty acid desaturase 1 knockout along with their corresponding Z scores. FADS: Fatty acid desaturase.
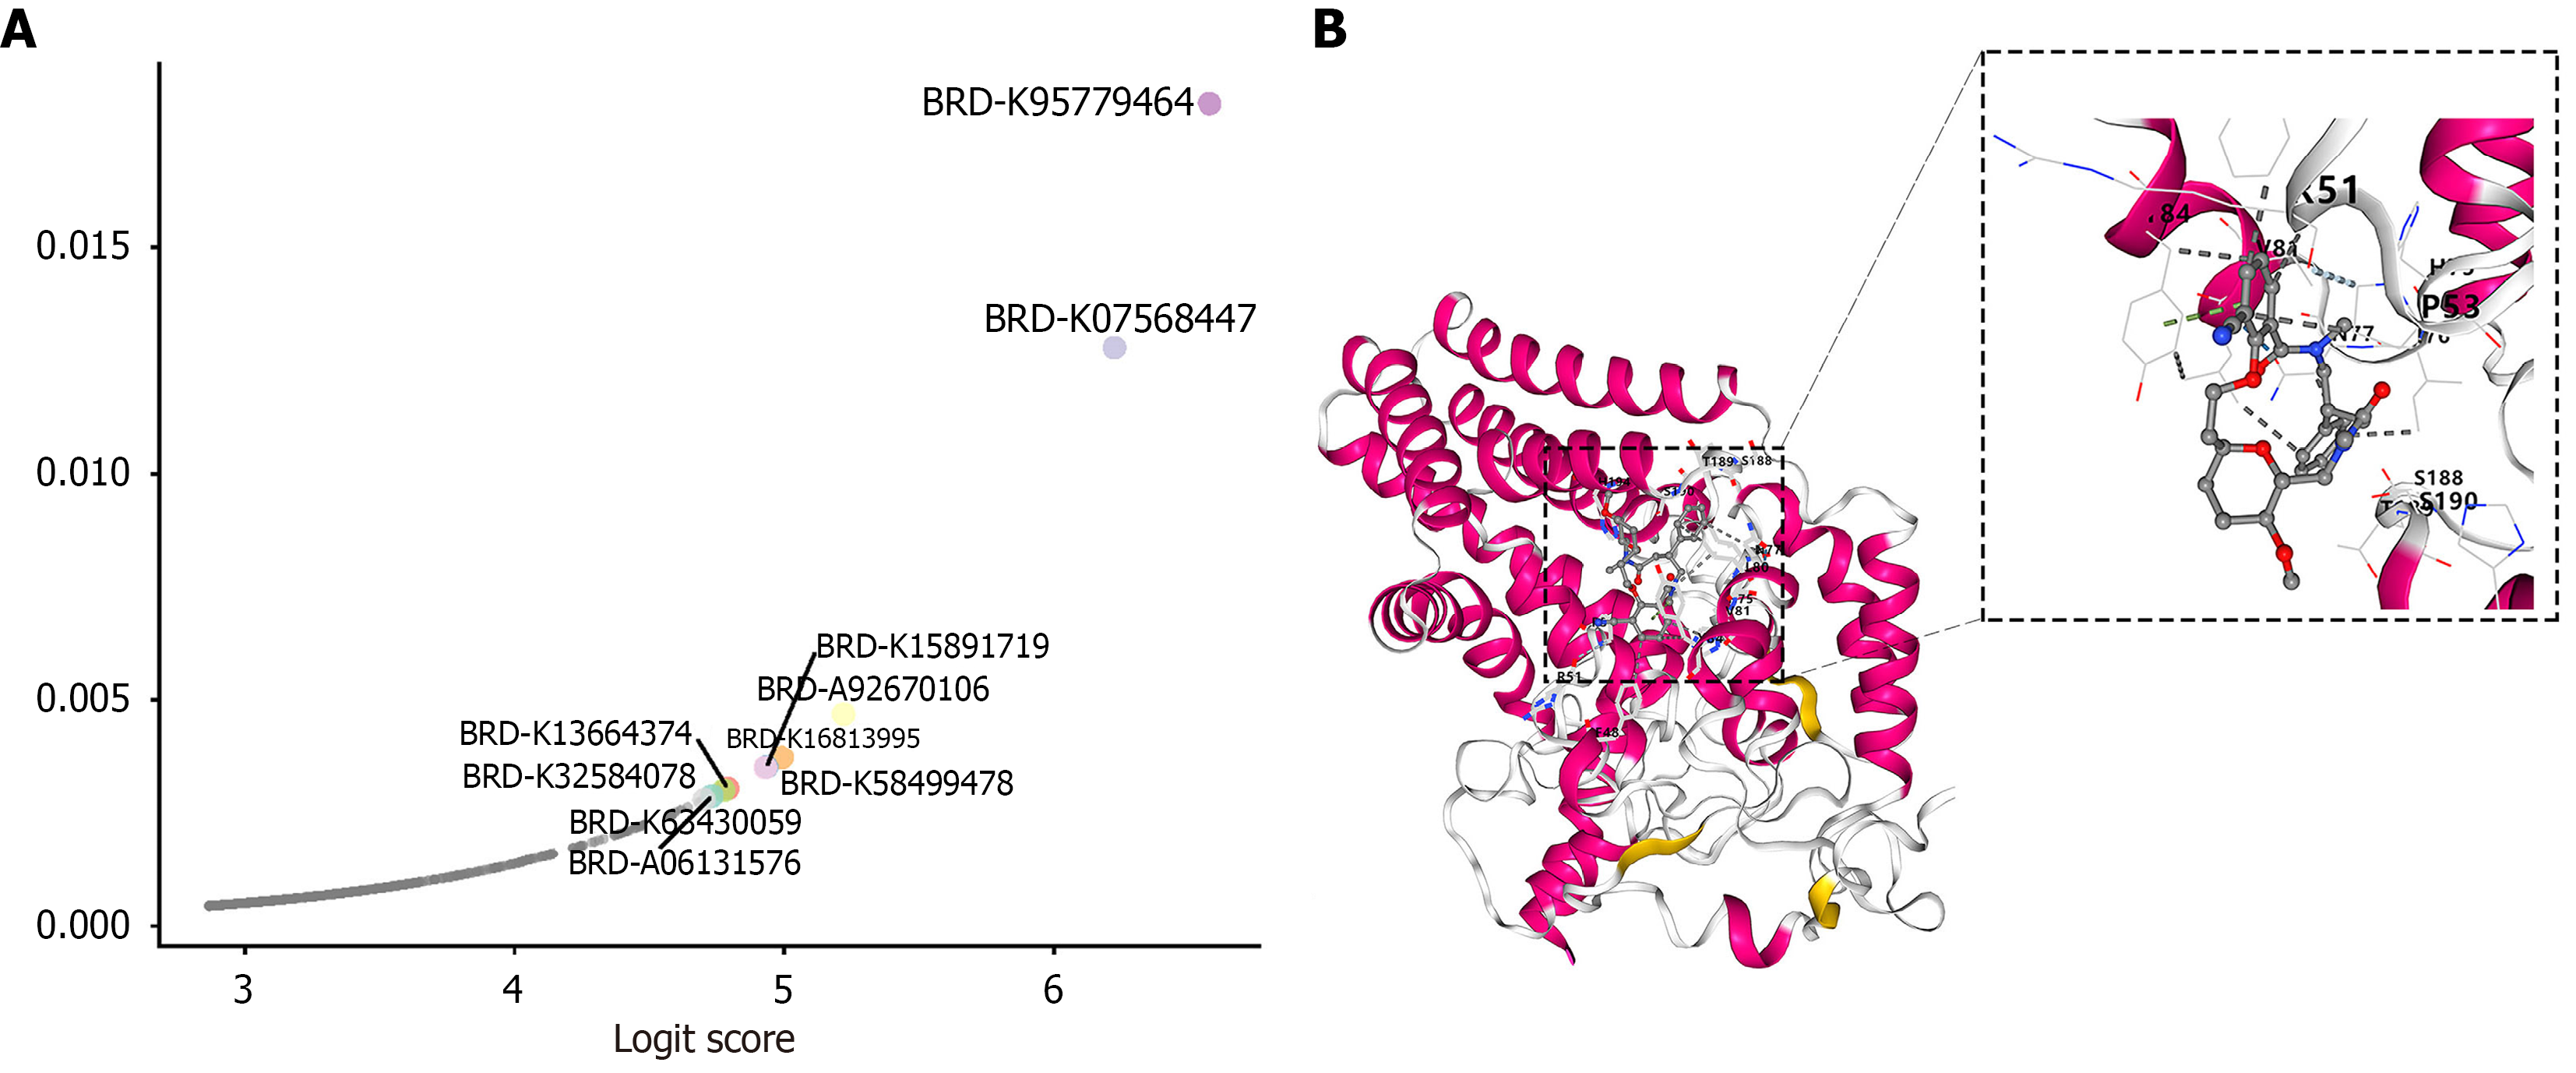
Figure 10 Artificial intelligence-assisted drug screening and molecular docking analysis of fatty acid desaturase 1-targeting compounds.
A: Distribution of logit scores and probabilities for drugs predicted to reverse the esophageal cancer transcriptional signature by the DrugReflector model, highlighting the top 10 candidate drugs with the highest reversal scores; B: Molecular docking analysis showing the binding mode of BRD-K95779464 with the fatty acid desaturase 1 protein (left: Overall binding conformation; right: Close-up view displaying key contact residues).
- Citation: Du QC, Bai Y, Zhou DH, Yu H, Nian H. Fatty acid desaturase 1 drives esophageal cancer via M1 macrophage ferroptosis and lipid metabolism remodeling. World J Gastrointest Oncol 2026; 18(11): 124110
- URL: https://www.wjgnet.com/1948-5204/full/v18/i11/124110.htm
- DOI: https://dx.doi.org/10.4251/wjgo.124110