
















Copyright: ©Author(s) 2026.
World J Gastrointest Oncol. Nov 15, 2026; 18(11): 124110
Published online Nov 15, 2026. doi: 10.4251/wjgo.124110
Published online Nov 15, 2026. doi: 10.4251/wjgo.124110
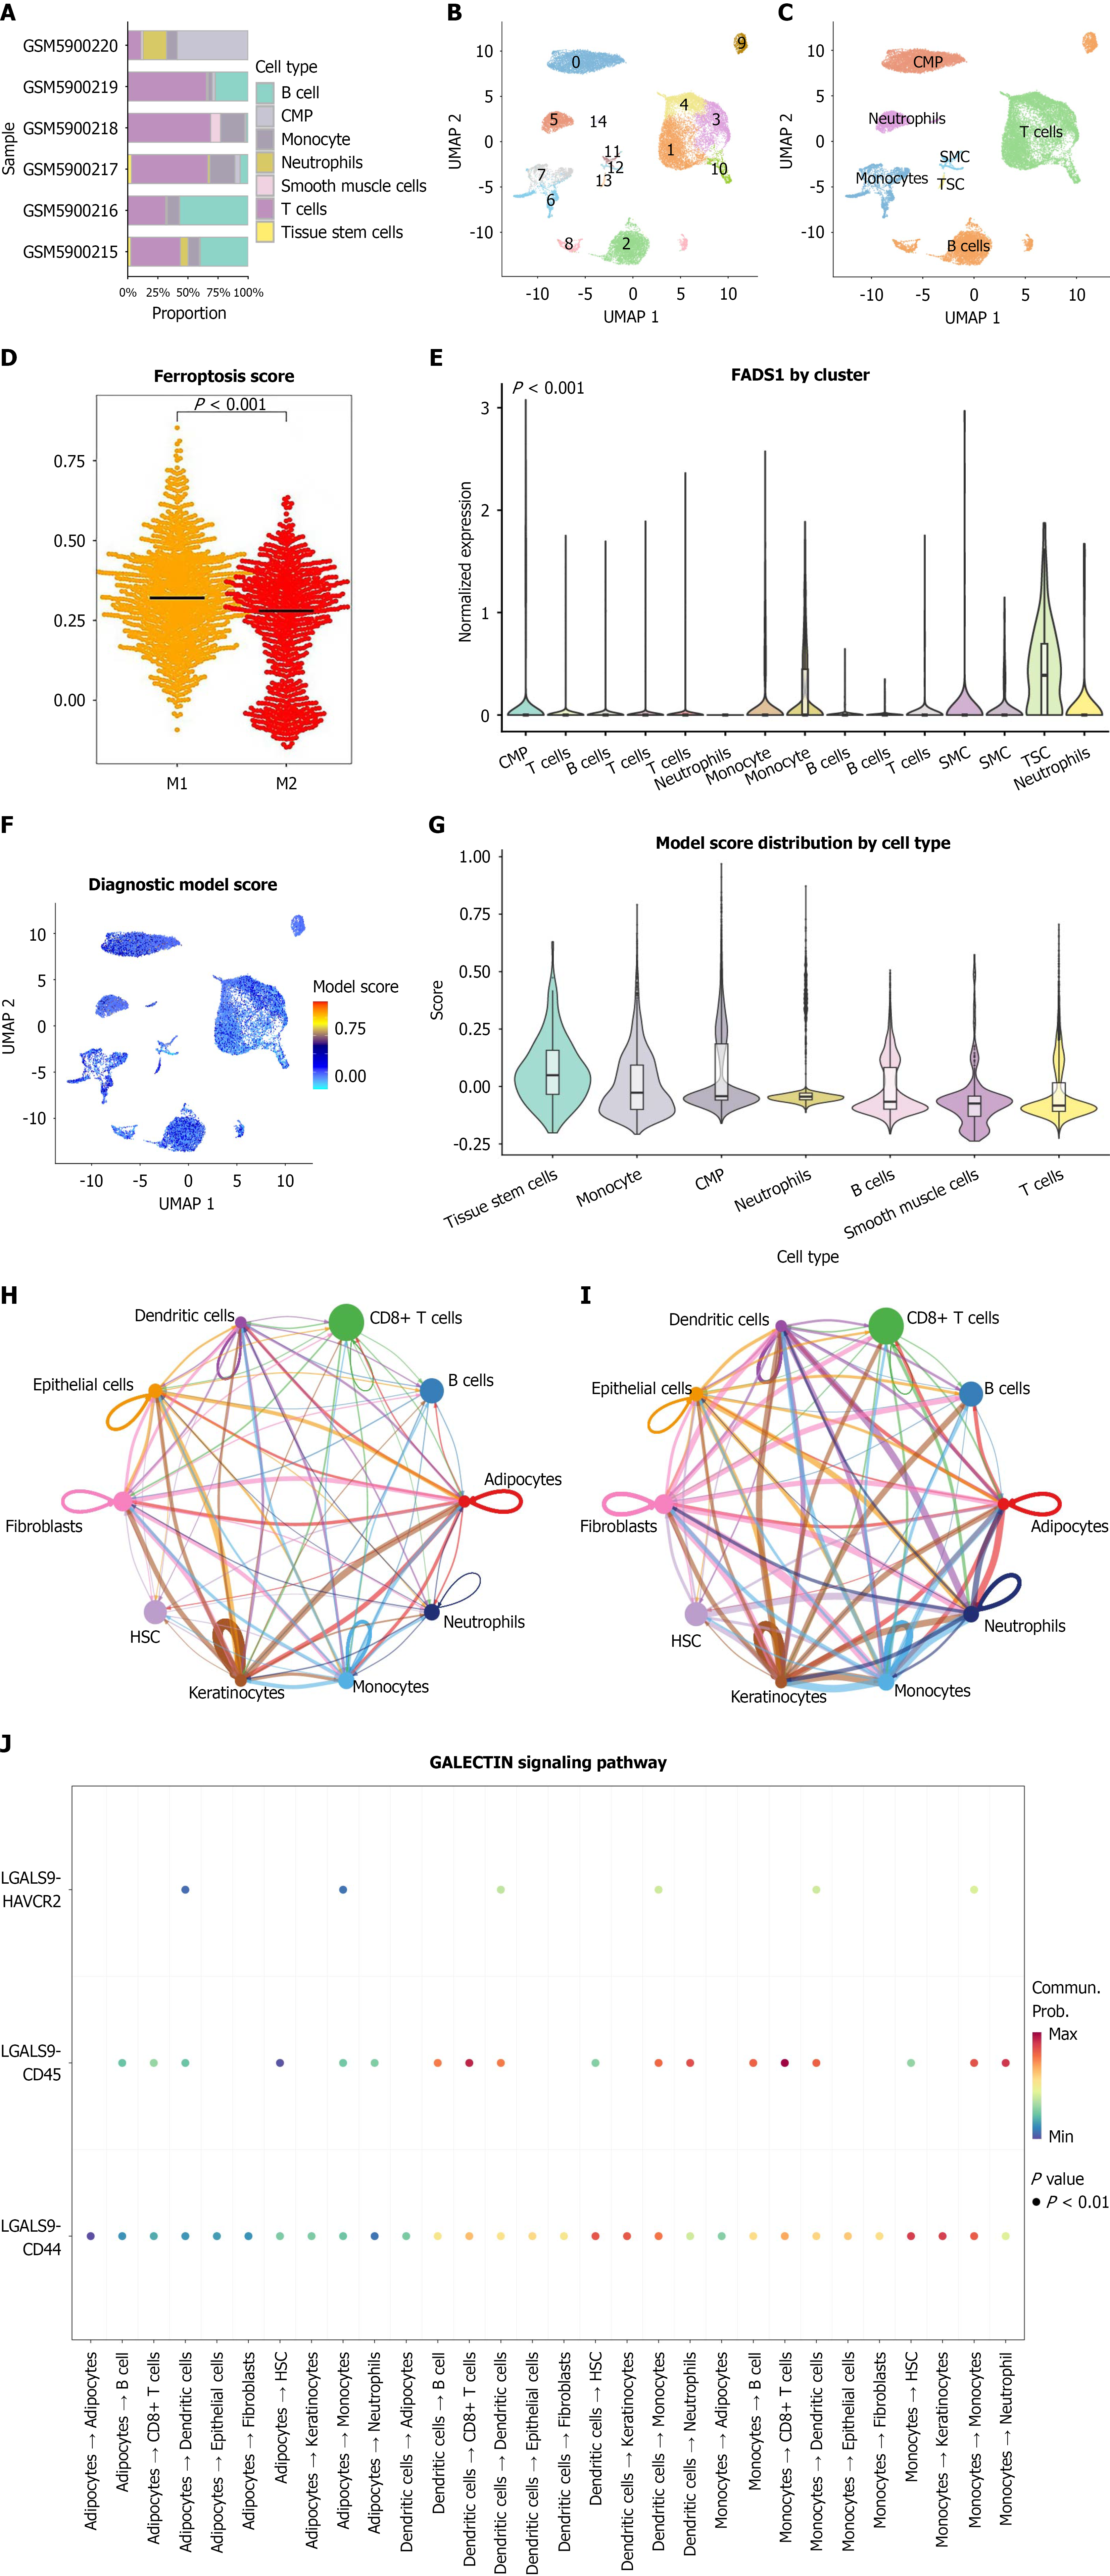
Figure 2 Single-cell transcriptomic landscape of the esophageal cancer microenvironment and distribution of fatty acid desaturase 1-associated signatures.
A: Bar plot of cell type proportions across samples; B: Uniform manifold approximation and projection (UMAP) plot illustrating the two-dimensional distribution characteristics of each cell type; C: UMAP plot of the 7 major cell types; D: Subclustering of macrophages showing fatty acid desaturase 1 enrichment in M1-like macrophages and ferroptosis scores in M1 vs M2 macrophages. Ferroptosis scores were calculated using single-sample gene set enrichment analysis; E: Violin plot showing fatty acid desaturase 1 expression across different cell types; F: UMAP plot of diagnostic model scores; G: Violin plot comparing diagnostic model scores across cell types; H: CellChat cell-cell communication network plot showing the number of ligand-receptor interactions among different cell types; I: CellChat network plot showing the strength (weight) of signaling interactions among cell types; J: Ligand-receptor network of the macrophage migration inhibitory factor and galactoside binding lectin signaling pathways. UMAP: Uniform manifold approximation and projection; CMP: Common myeloid progenitor; SMC: Smooth-muscle cell; TSC: Tumor stem cell; FADS1: Fatty acid desaturase 1; HSC: Hematopoietic stem cell.
- Citation: Du QC, Bai Y, Zhou DH, Yu H, Nian H. Fatty acid desaturase 1 drives esophageal cancer via M1 macrophage ferroptosis and lipid metabolism remodeling. World J Gastrointest Oncol 2026; 18(11): 124110
- URL: https://www.wjgnet.com/1948-5204/full/v18/i11/124110.htm
- DOI: https://dx.doi.org/10.4251/wjgo.124110