
















Copyright: ©Author(s) 2026.
World J Gastrointest Oncol. Nov 15, 2026; 18(11): 124110
Published online Nov 15, 2026. doi: 10.4251/wjgo.124110
Published online Nov 15, 2026. doi: 10.4251/wjgo.124110
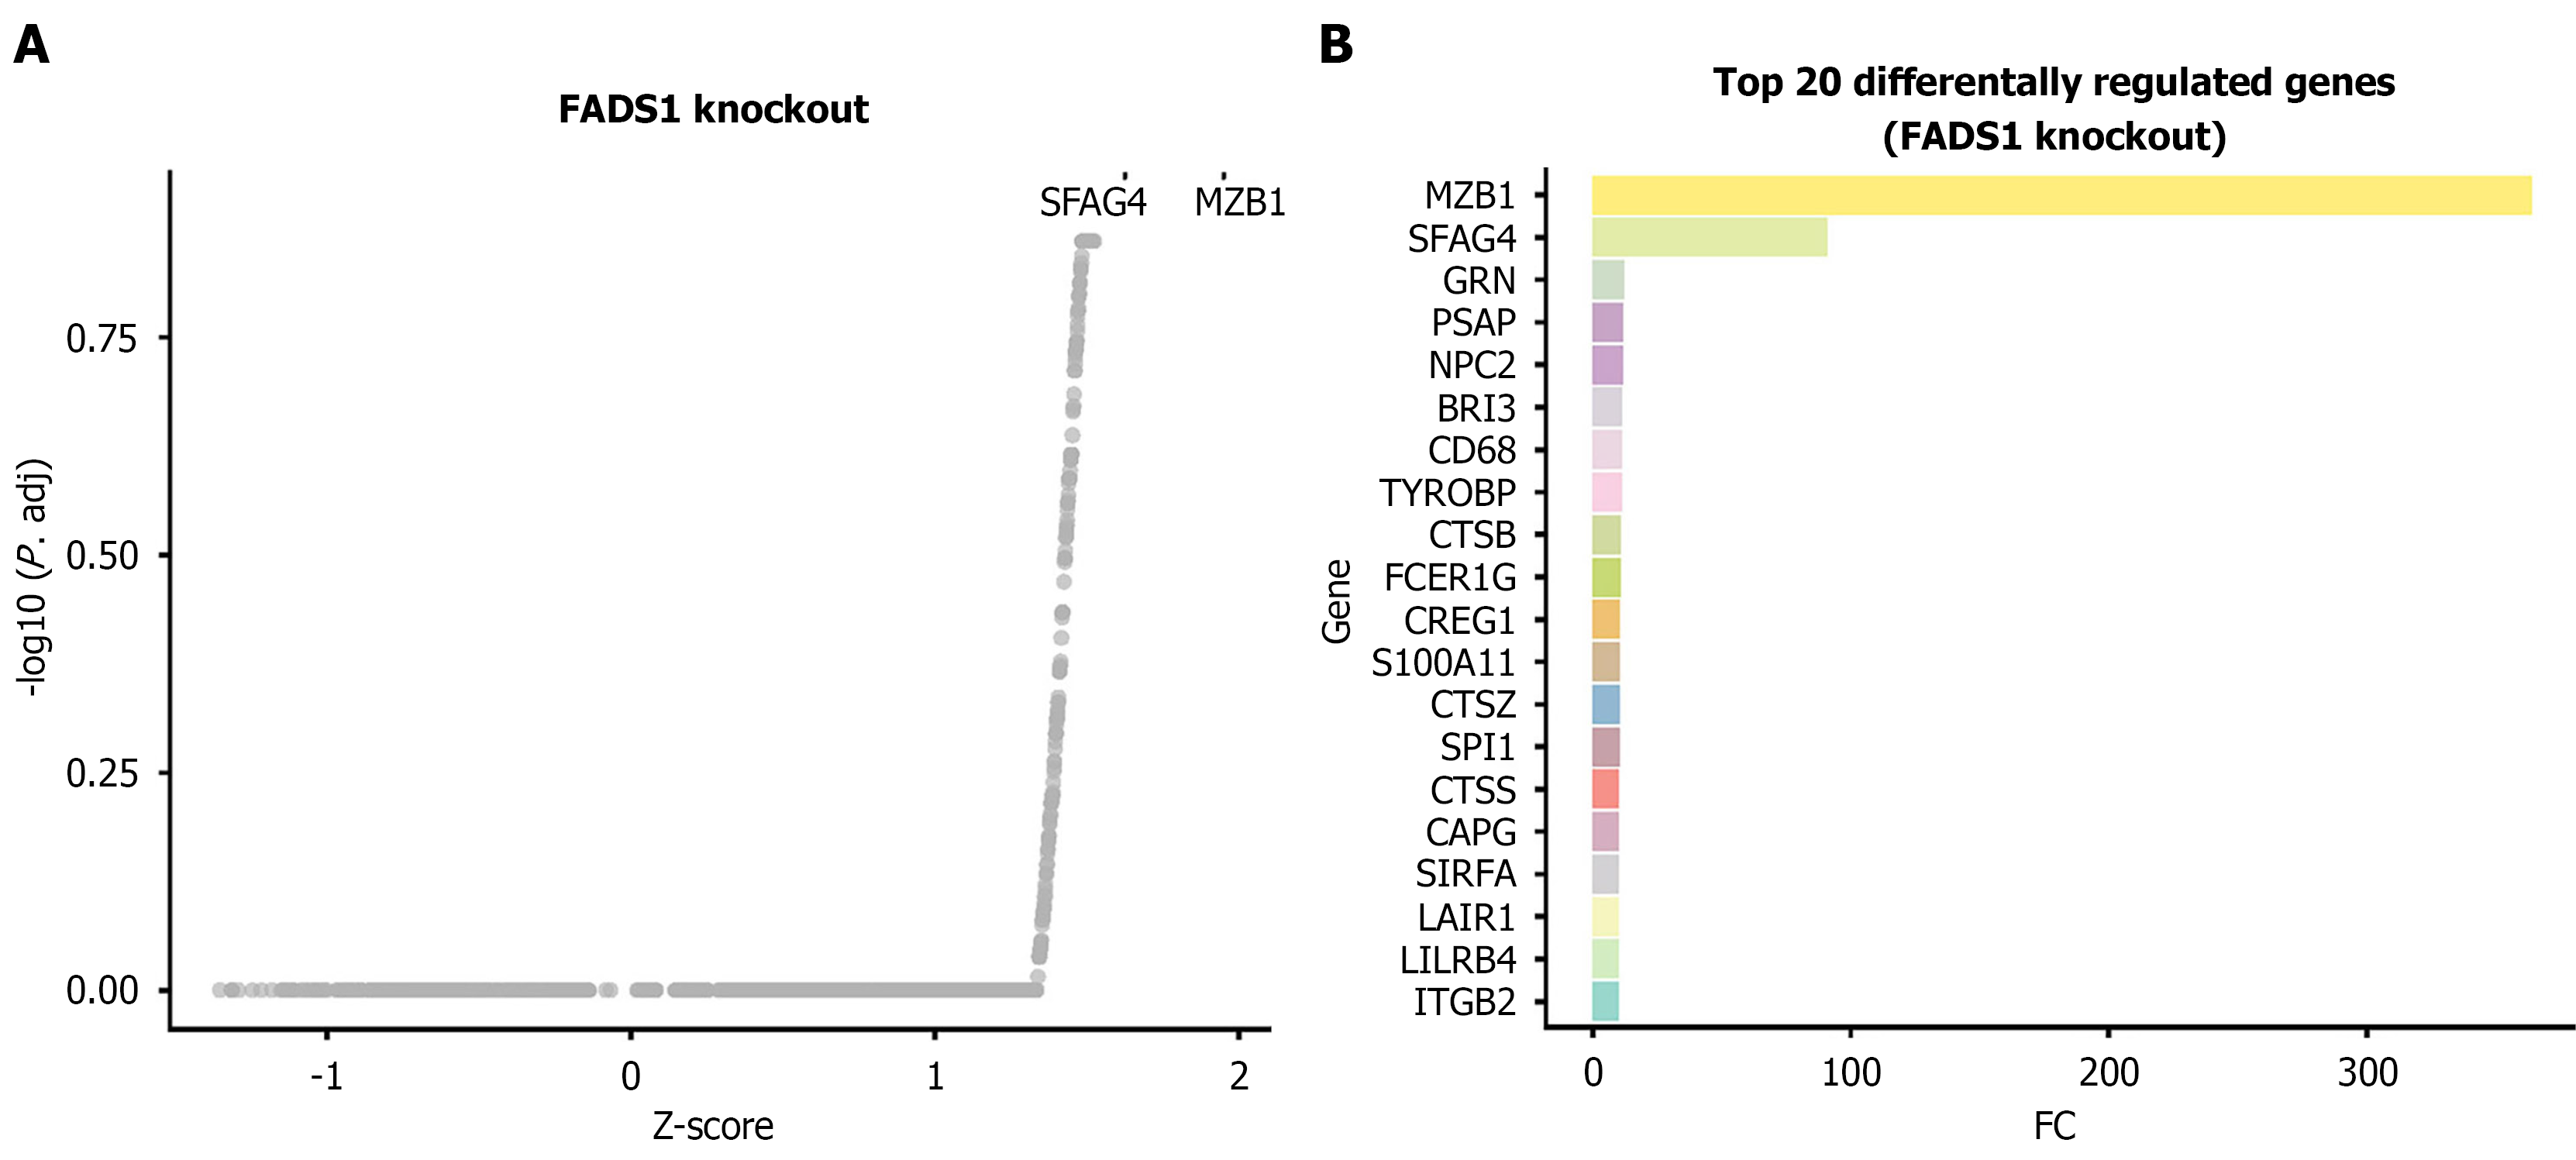
Figure 9 Impact of virtual fatty acid desaturase 1 knockout on the gene regulatory network in monocytes/macrophages.
A: Scatter plot showing the distribution of differentially expressed genes following fatty acid desaturase 1 knockout. The X-axis represents the Z score (differential regulation score), and the Y-axis represents the negative logarithm of the adjusted P value. Positive Z scores indicate upregulated regulatory activity after knockout (positive regulation), whereas negative values indicate downregulation. The dashed line indicates the significance threshold (adjusted P value < 0.05); B: Bar plot displaying the top 20 genes most significantly affected by fatty acid desaturase 1 knockout along with their corresponding Z scores. FADS: Fatty acid desaturase.
- Citation: Du QC, Bai Y, Zhou DH, Yu H, Nian H. Fatty acid desaturase 1 drives esophageal cancer via M1 macrophage ferroptosis and lipid metabolism remodeling. World J Gastrointest Oncol 2026; 18(11): 124110
- URL: https://www.wjgnet.com/1948-5204/full/v18/i11/124110.htm
- DOI: https://dx.doi.org/10.4251/wjgo.124110