Copyright
©The Author(s) 2025.
World J Gastrointest Oncol. May 15, 2025; 17(5): 105872
Published online May 15, 2025. doi: 10.4251/wjgo.v17.i5.105872
Published online May 15, 2025. doi: 10.4251/wjgo.v17.i5.105872
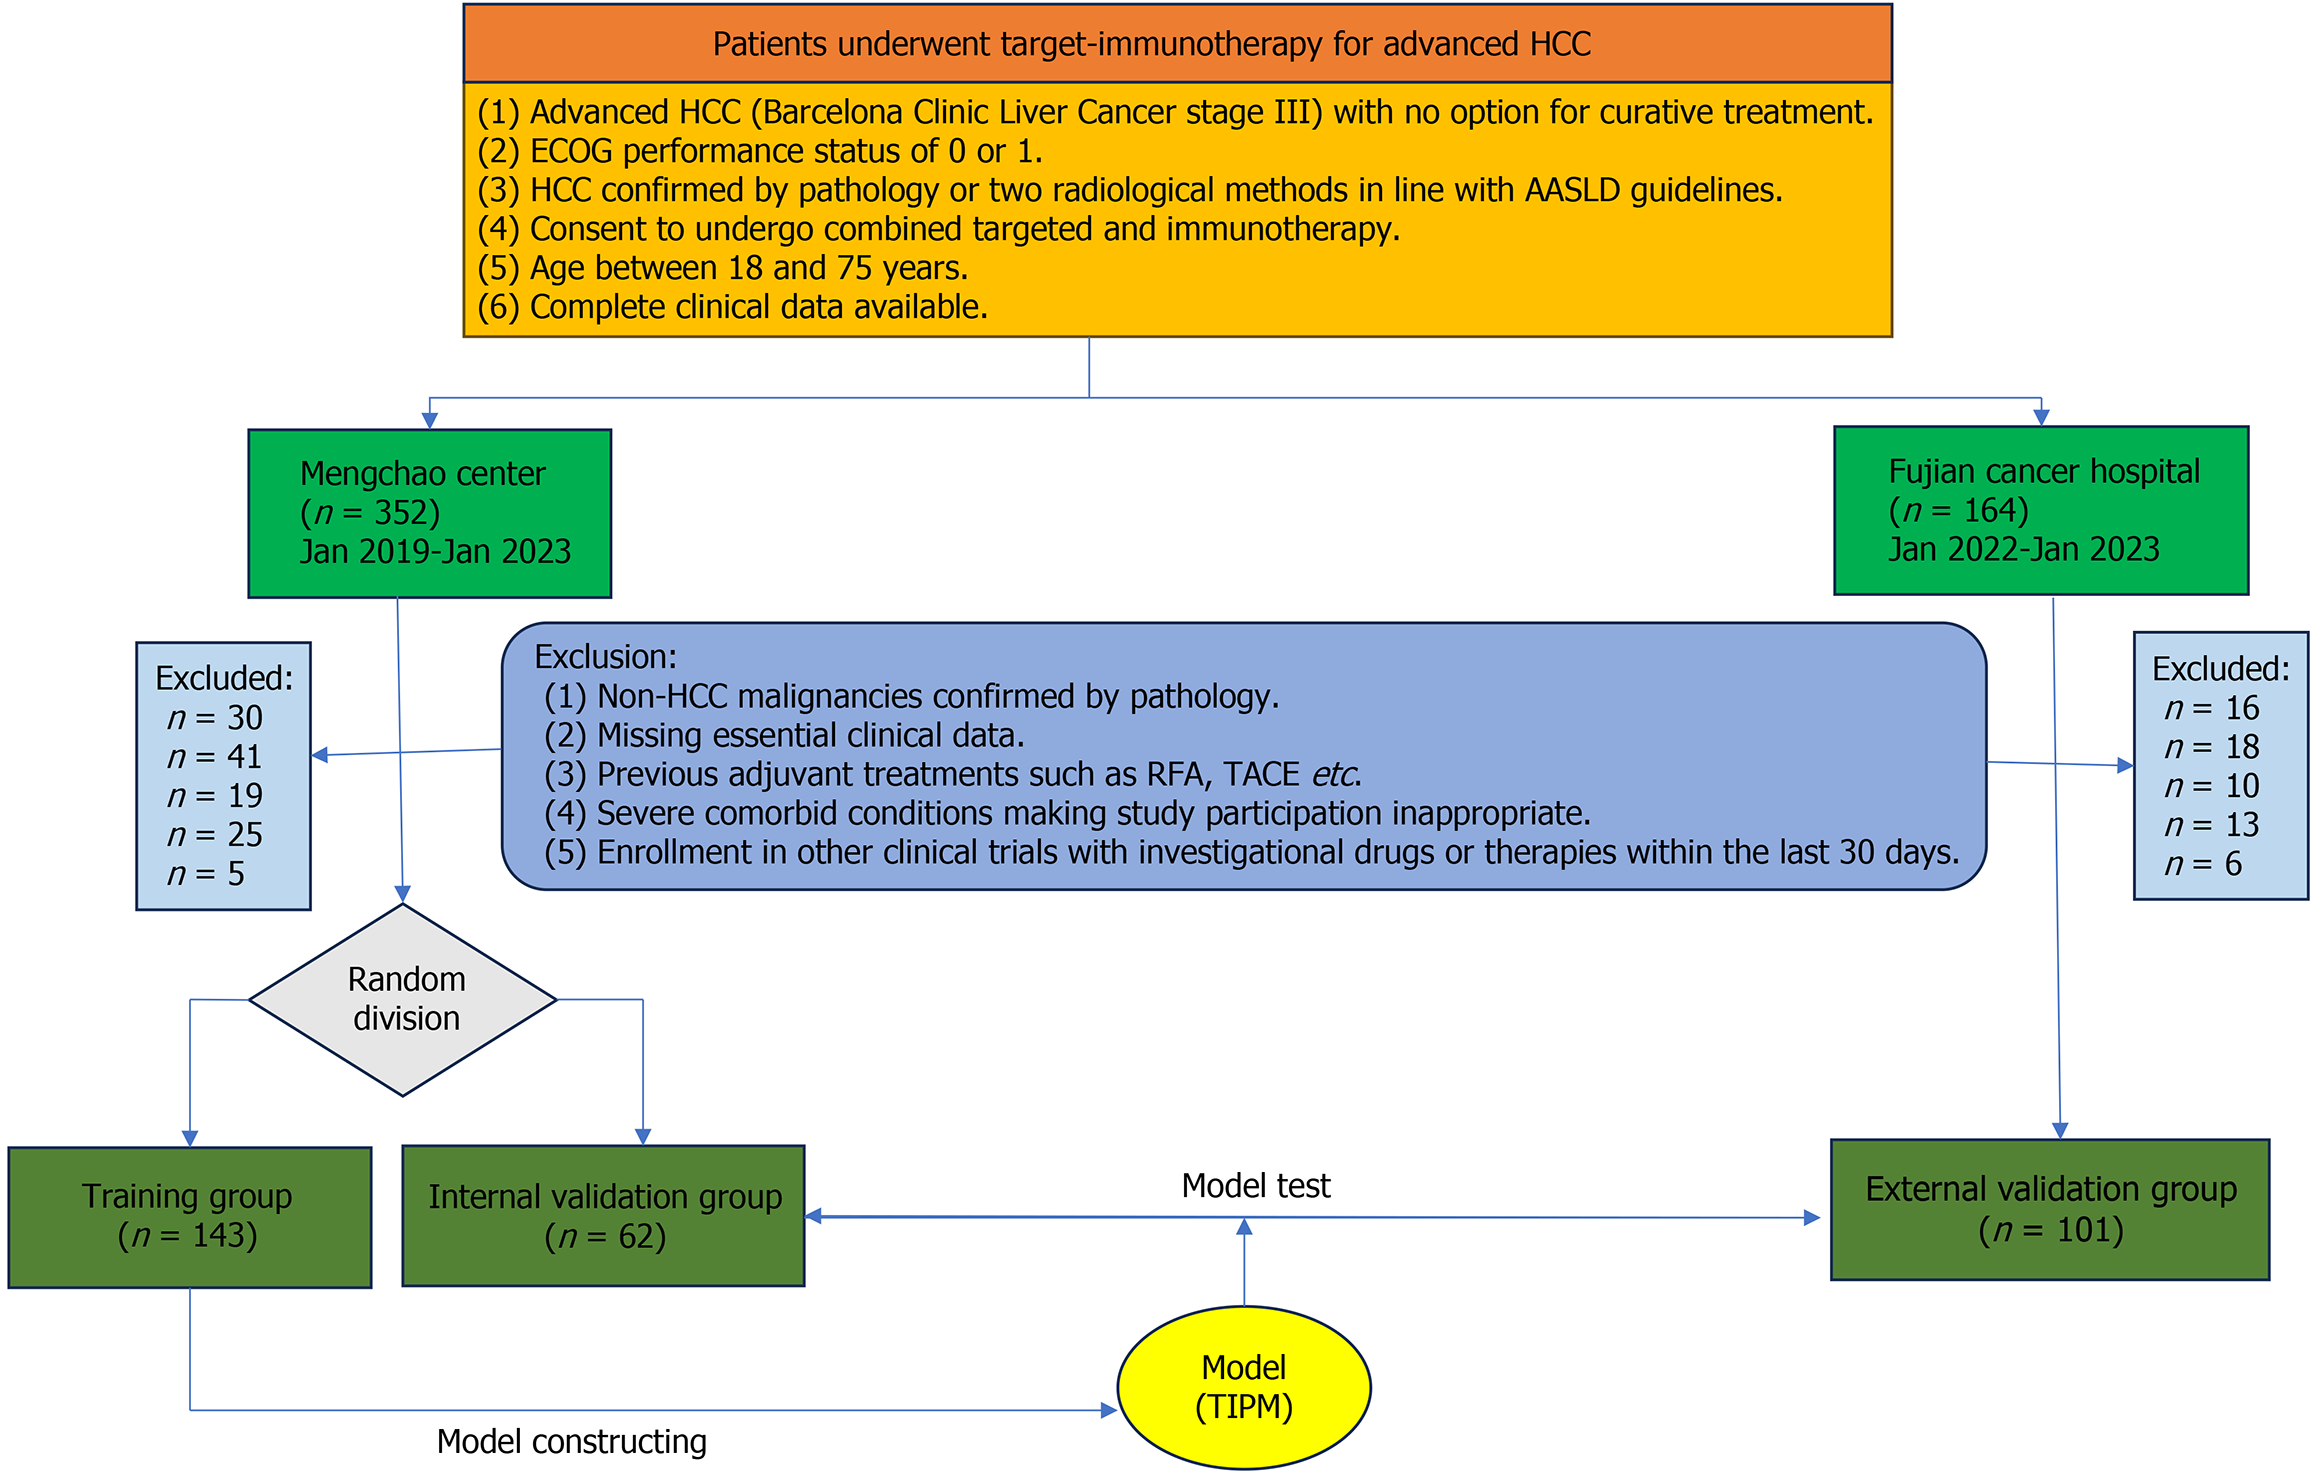
Figure 1 Patient selection diagram.
HCC: Hepatocellular carcinoma; ECGO: Eastern Cooperative Oncology Group; AASLD: American Association for the Study of Liver Diseases; RFA: Radiofrequency ablation; TACE: Transarterial chemoembolization; TIPM: Target Immunotherapy Predictive Model.
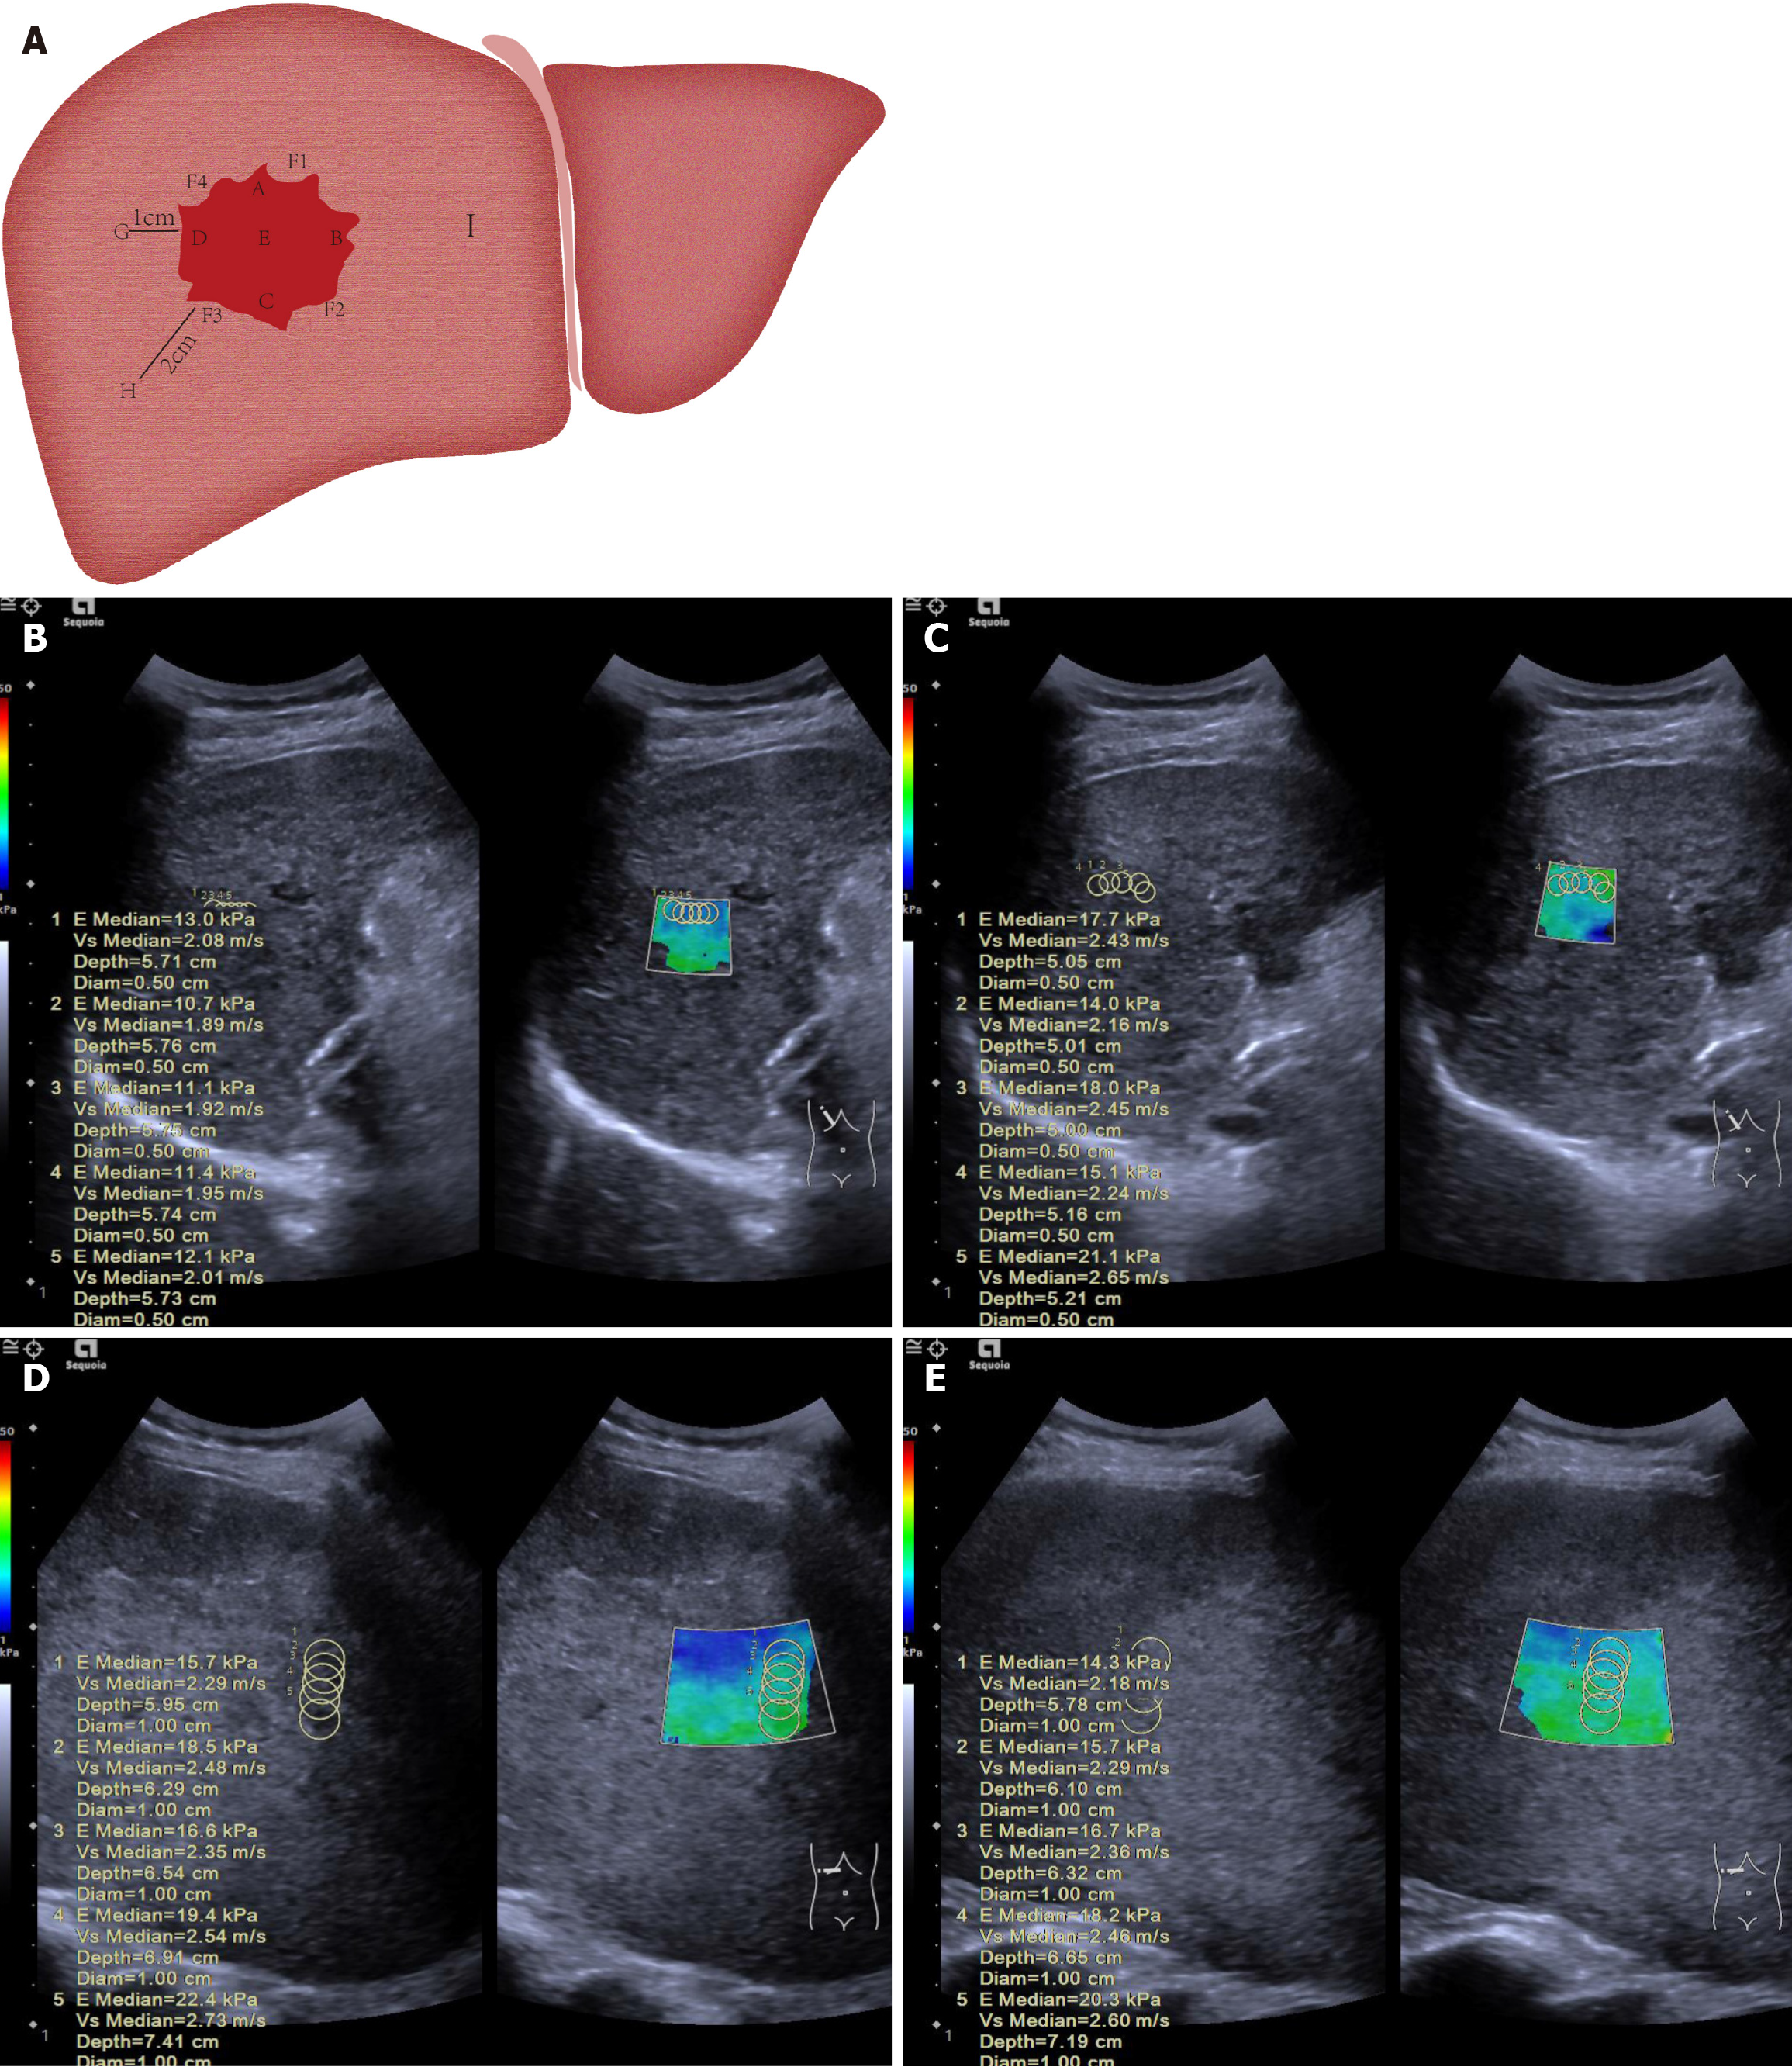
Figure 2 Diagram illustrating measurement of liver tumor and surrounding tissue stiffness.
A: The 12-point clock-face method was used to define points within and around the tumor: A (superior, 12 o’clock, closest to transducer), B (left lateral, 3 o’clock), C (inferior, 6 o’clock, furthest from transducer), D (right lateral, 9 o’clock), and E (central). Peritumoral tissue (normal liver adjacent to the tumor capsule) was sampled at F1 (2 o’clock), F2 (5 o’clock), F3 (8 o’clock), and F4 (11 o’clock). Normal liver was sampled at G (1 cm), H (2 cm), and I (> 2 cm) from the tumor margin; B: A 52-year-old male patient had a pre-treatment mean stiffness of 11.7 kPa in the anterior part of the tumor; C: After treatment, the mean stiffness increased to 17.1 kPa, with stiffness also rising at other measurement points, indicating ΔT > 0. This patient had no tumor progression at 26 weeks, confirming treatment effectiveness; D: A 48-year-old male patient had a pre-treatment mean stiffness of 18.5 kPa in the anterior part of the tumor; E: After treatment, the stiffness dropped to 17.0 kPa, with similar decreases observed at other points, indicating ΔT < 0. This patient showed tumor progression at 12 weeks.
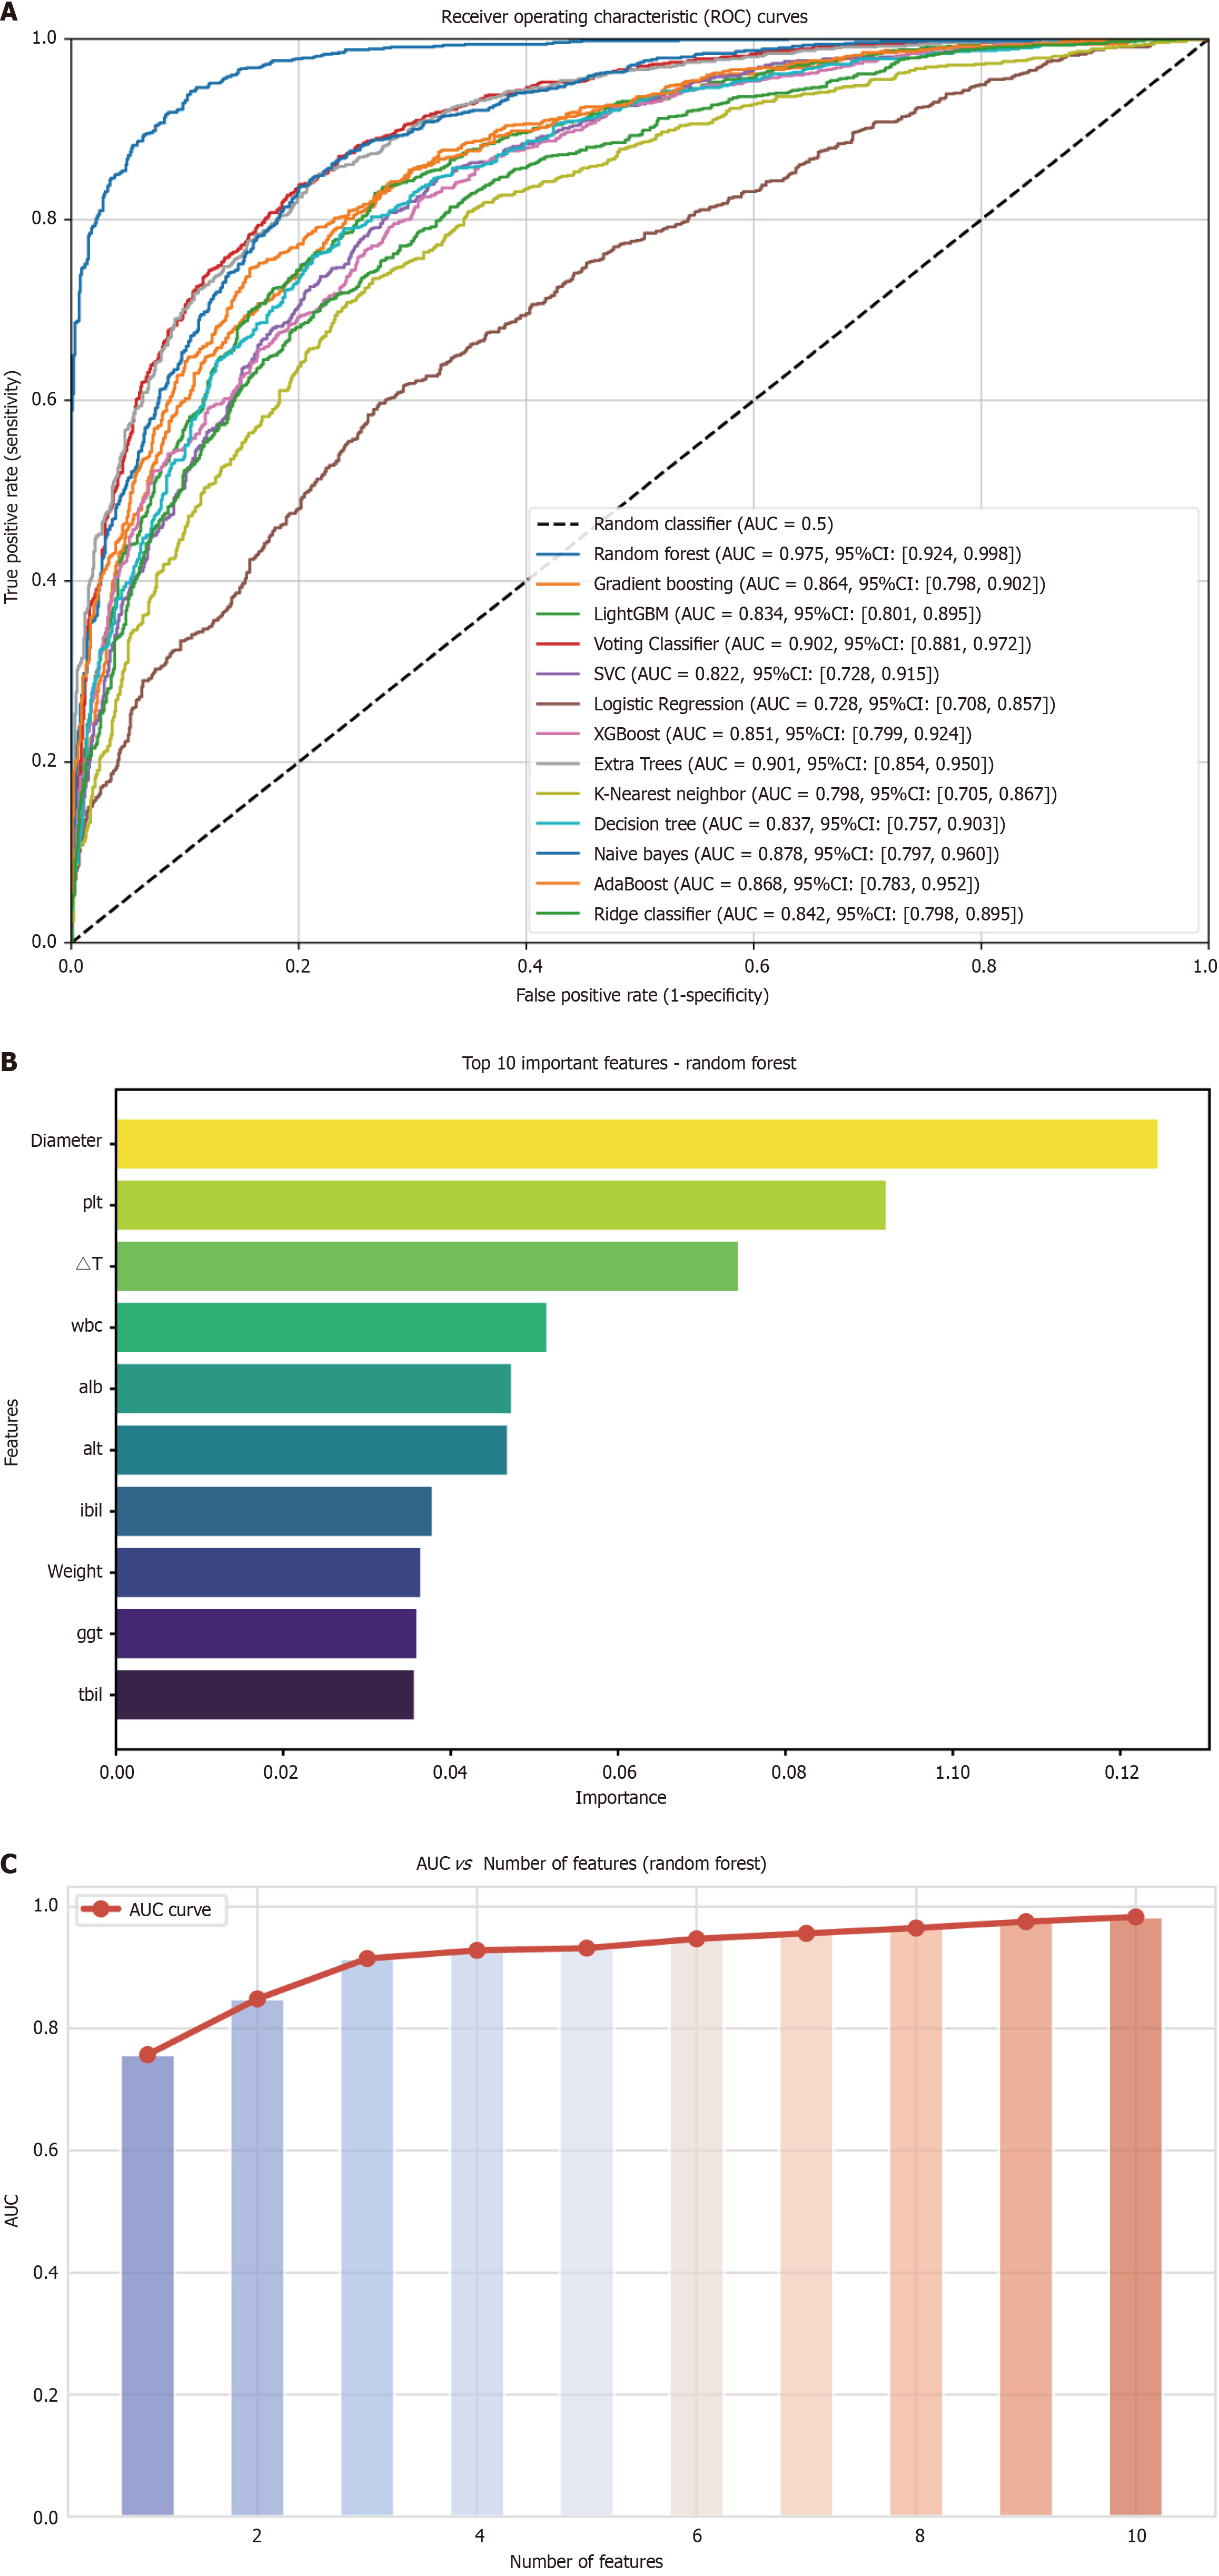
Figure 3 Analysis of variable importance and its correlation with area under the curve.
A: Receiver operating characteristic curves of different machine learning models in the internal validation cohort; B: The top ten most important variables, ranked by their contribution to the model; C: Area under the curve values corresponding to varying numbers of selected variables. A peak area under the curve is observed with four variables. AUC: Area under the curve; CI: Confidence interval; PLT: Platelet count; WBC: White blood cell count; ALB: Albumin; ALT: Alanine aminotransferase; IBIL: Indirect bilirubin; GGT: Gamma-glutamyl transferase; TBIL: Total bilirubin.
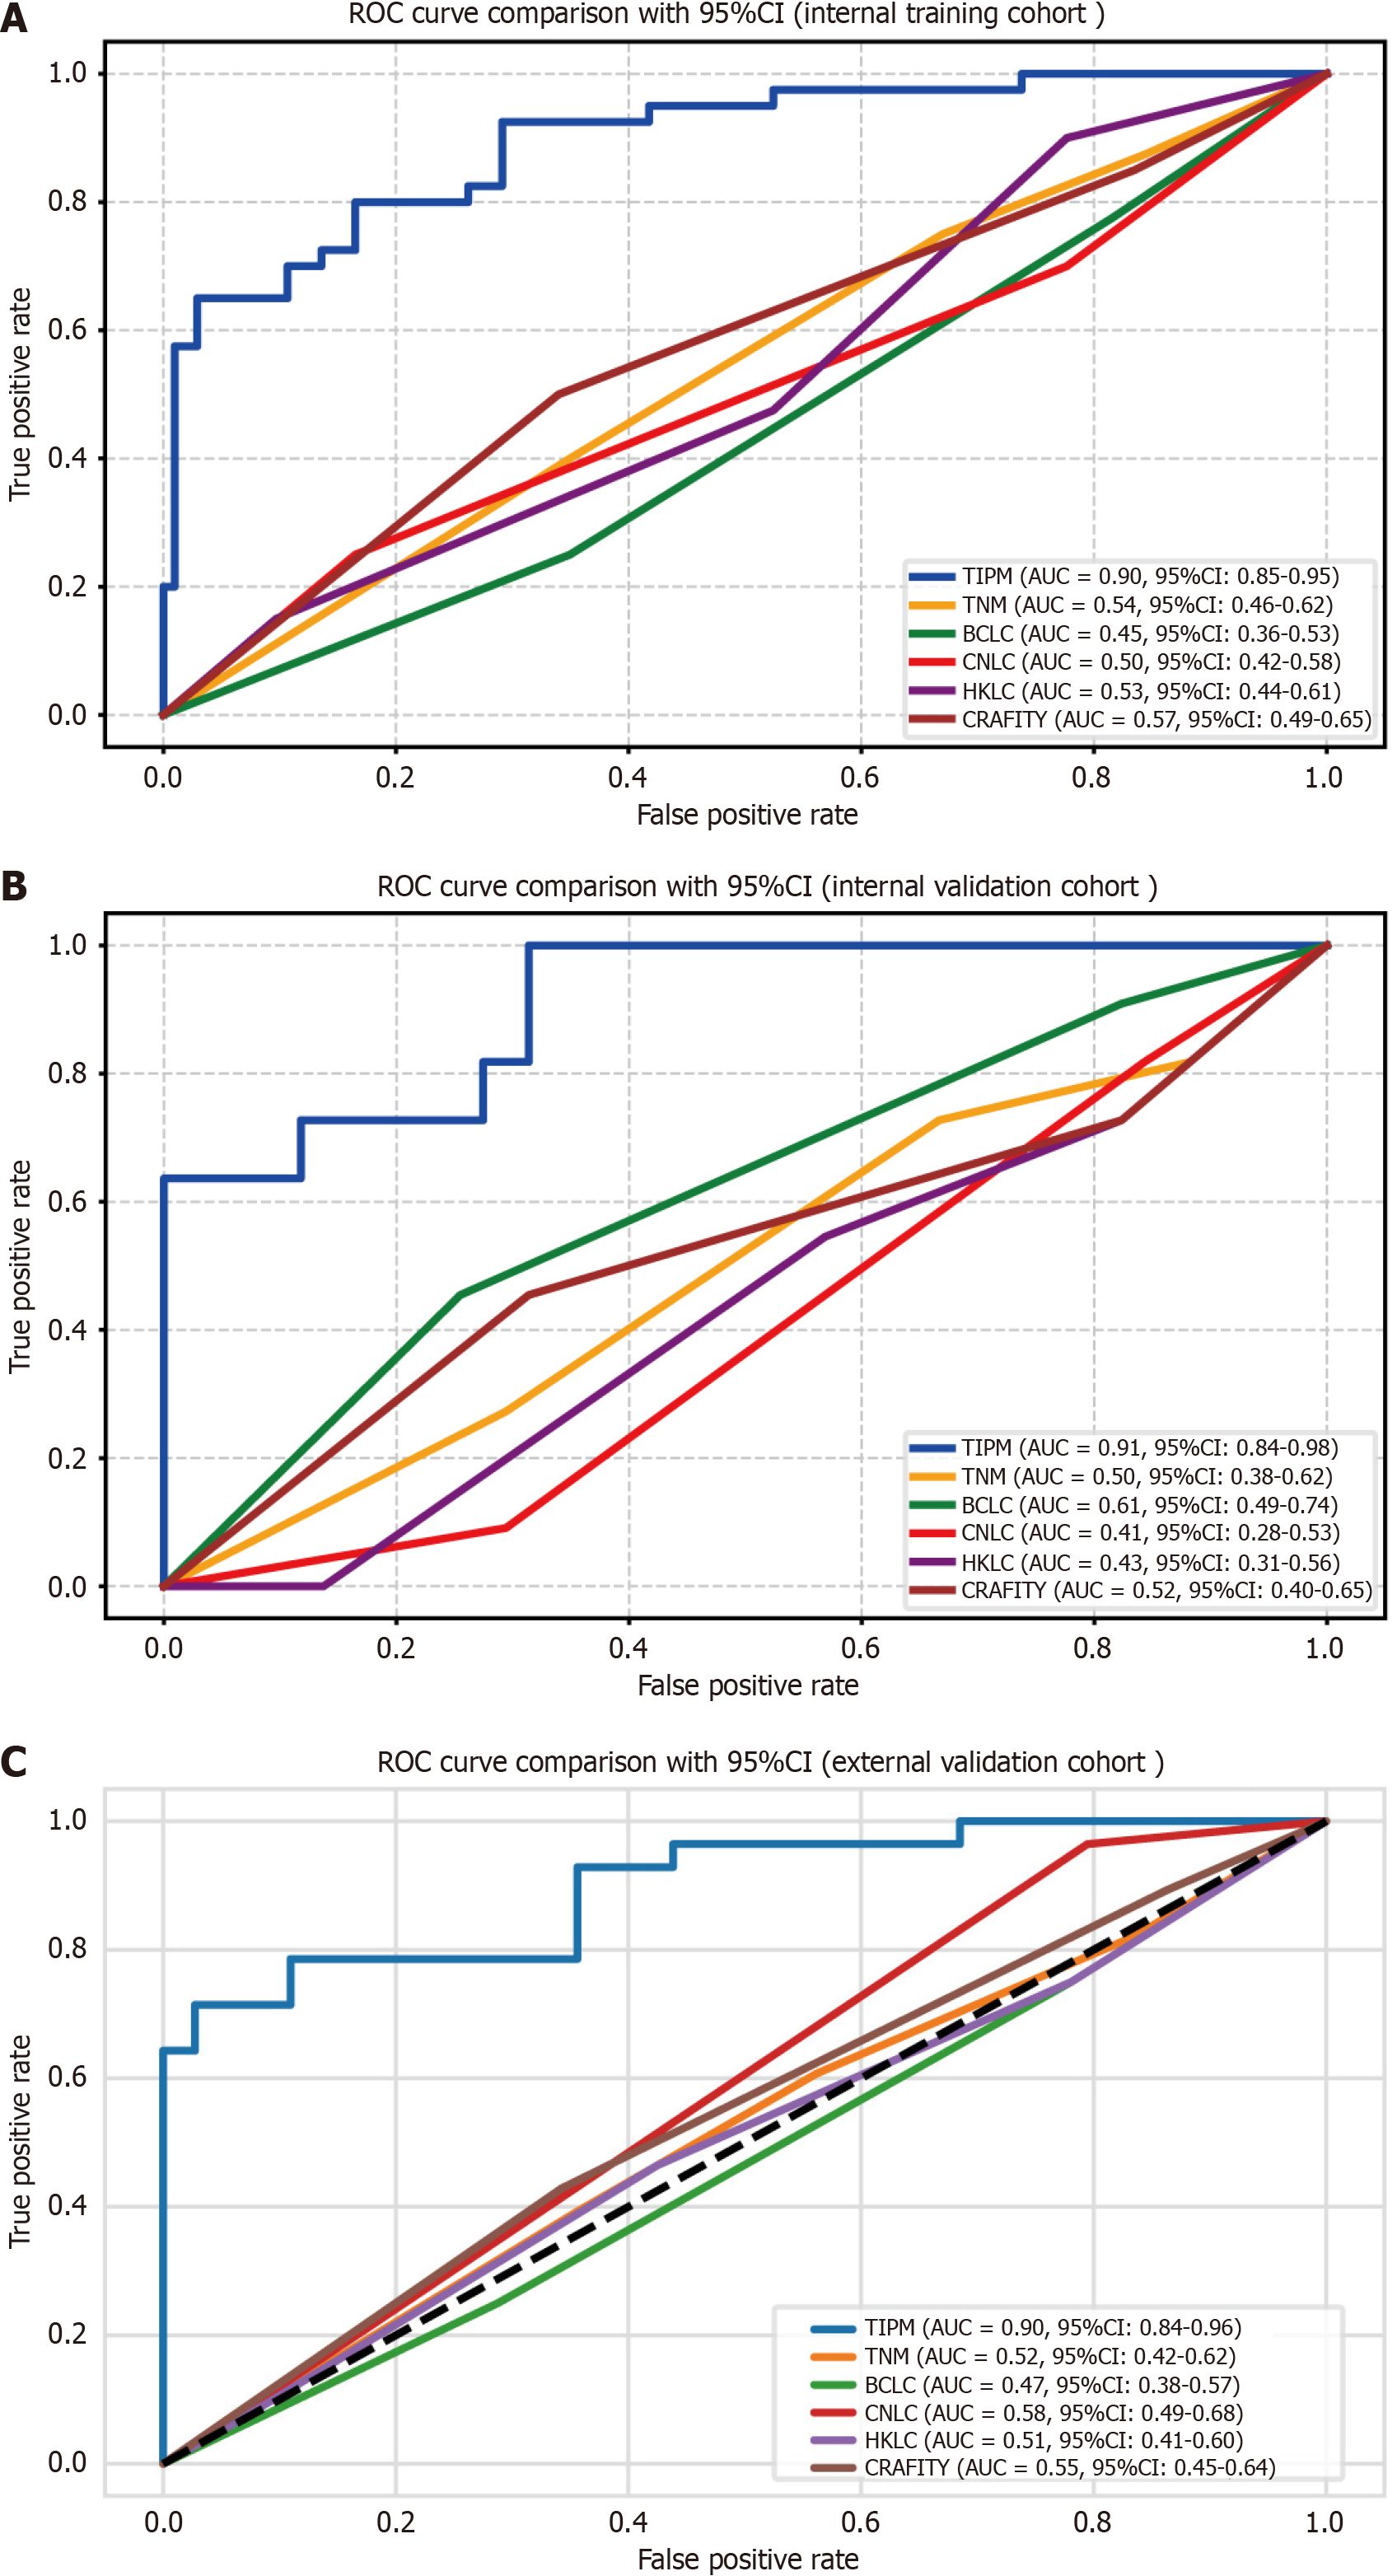
Figure 4 Receiver operating characteristic curves for the Target Immunotherapy Predictive Model and comparator models.
A: Internal training cohort shows Target Immunotherapy Predictive Model (TIPM) achieving superior discrimination with an area under the curve (AUC) of 0.895; B: Internal validation cohort demonstrates TIPM maintaining the highest predictive performance (AUC 0.907) compared to alternative models; C: External validation cohort confirms TIPM’s consistent discriminative advantage (AUC 0.899). All curves illustrate TIPM’s robust performance superiority across different patient populations. ROC: Receiver operating characteristic; AUC: Area under the curve; TIPM: Target Immunotherapy Predictive Model; TNM: Tumor-node-metastasis; BCLC: Barcelona Clinic Liver Cancer; CNLC: China Liver Cancer; HKLC: Hong Kong Liver Cancer; CRAFITY: C-reactive protein and alpha-fetoprotein in immunotherapy.
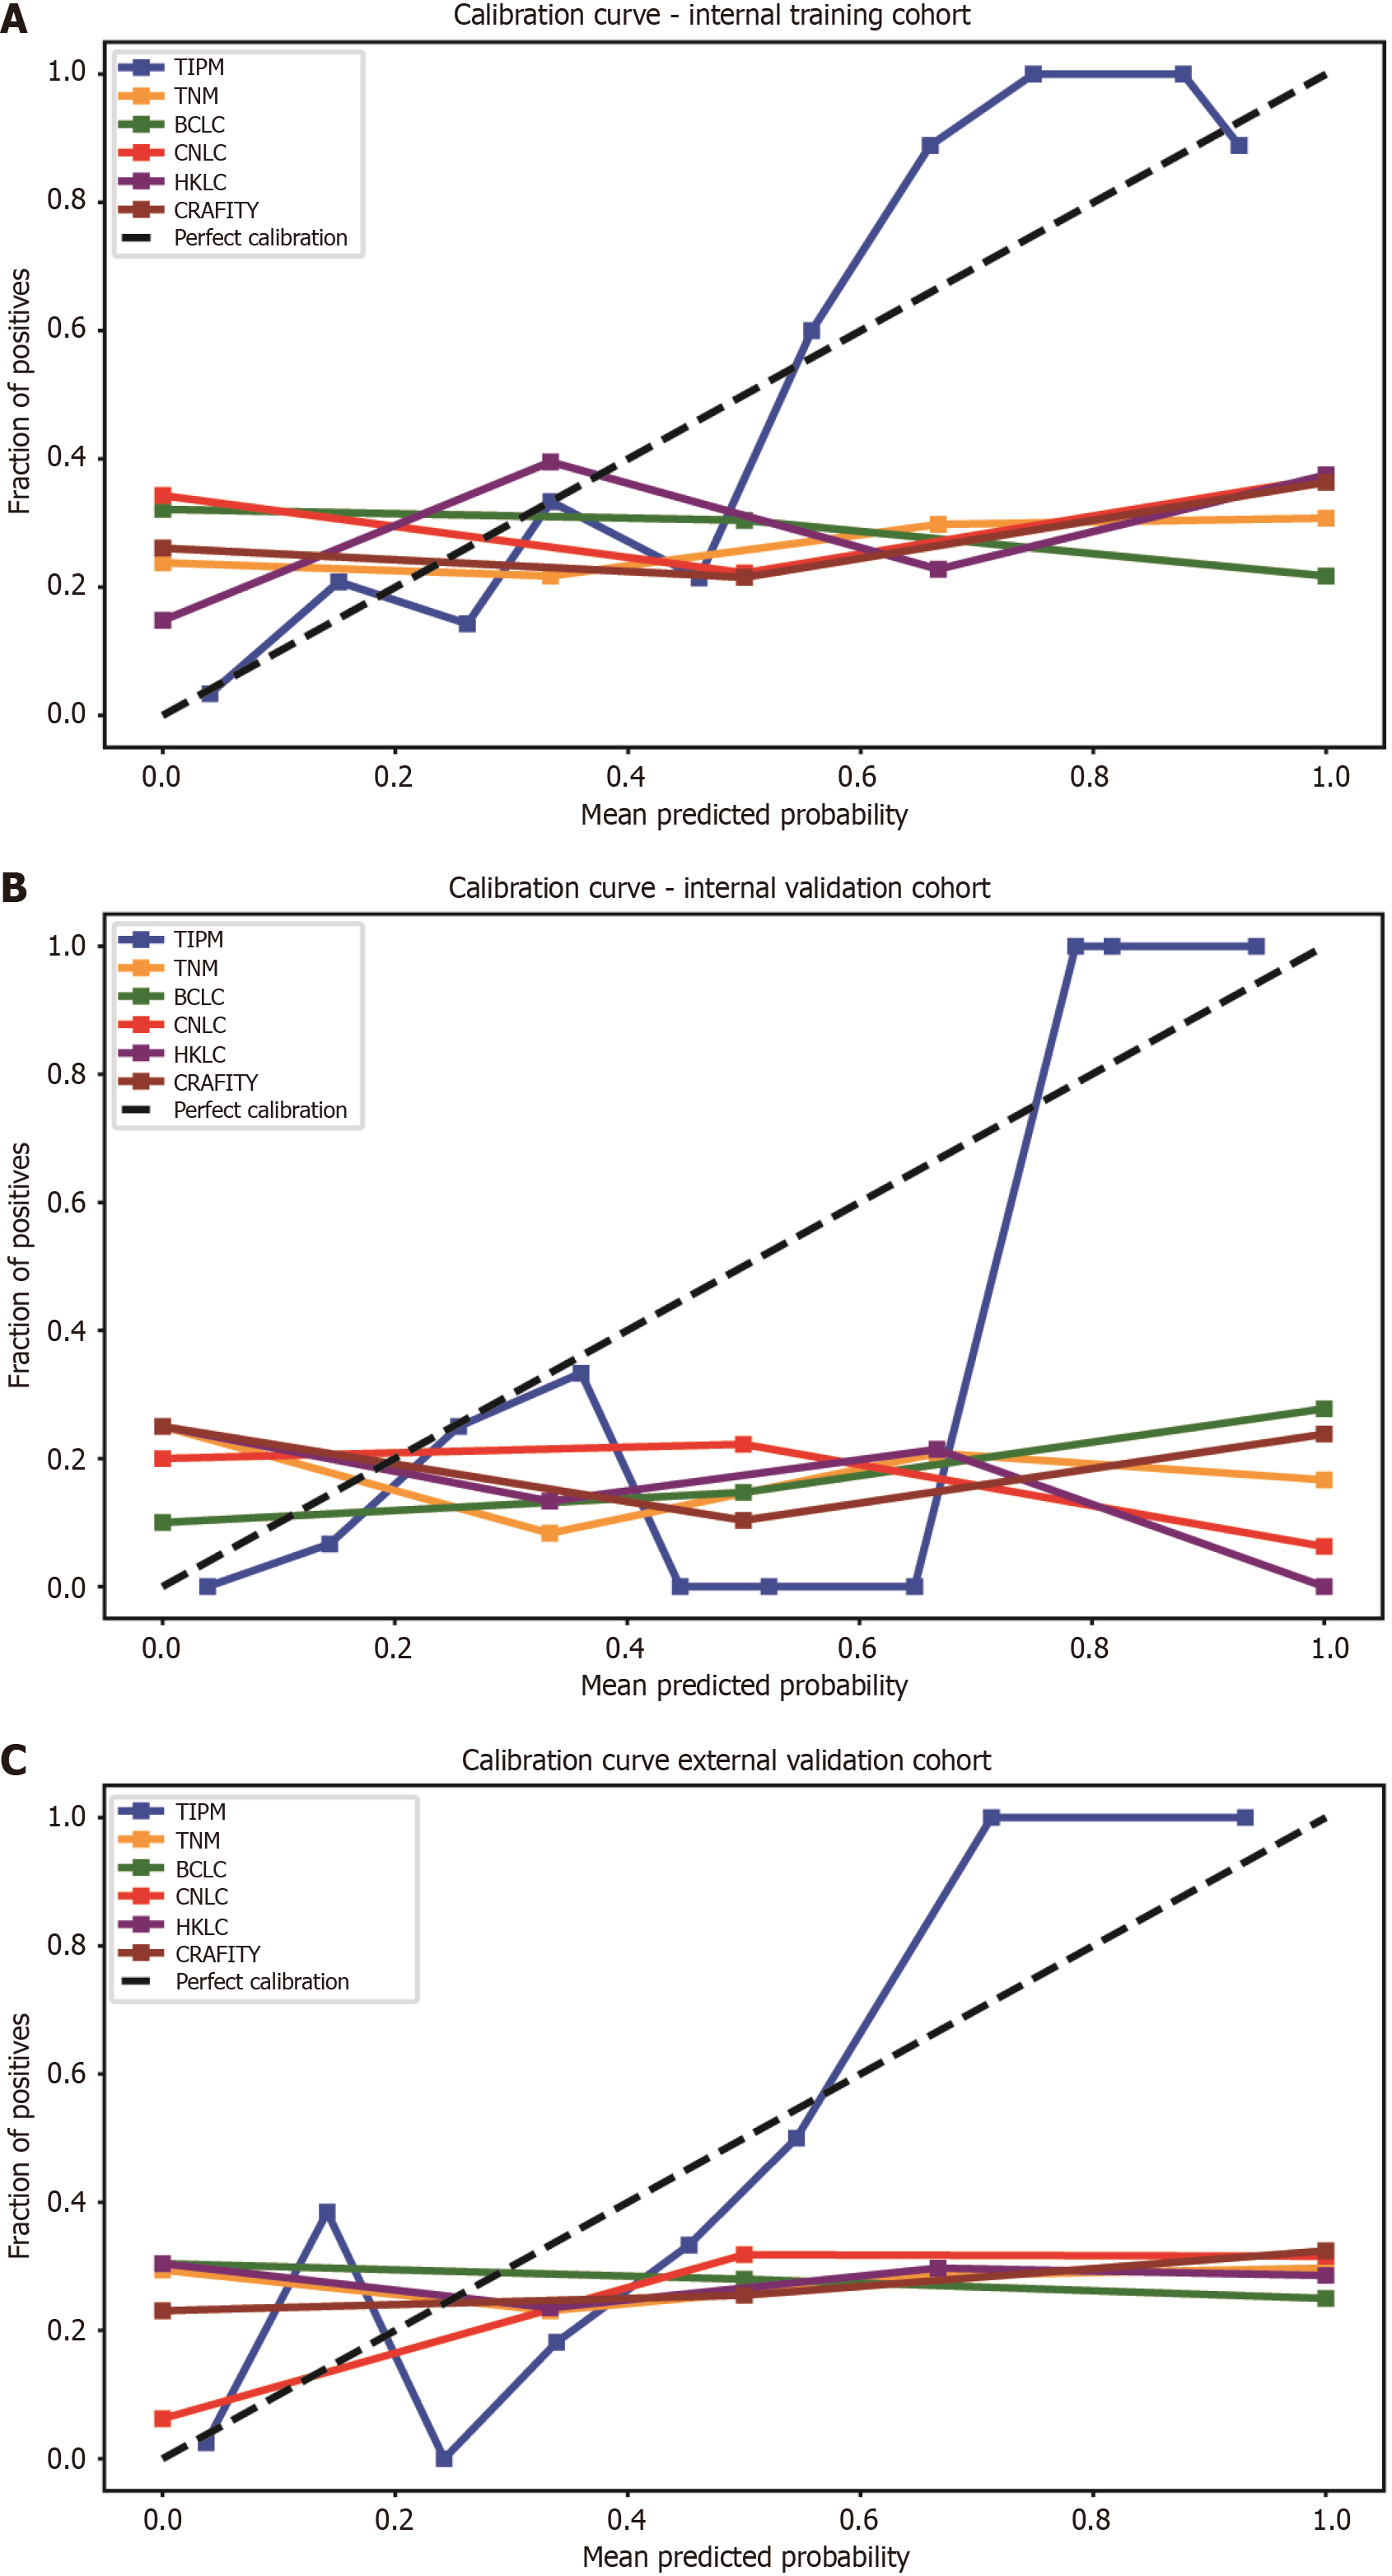
Figure 5 Calibration curves for model performance across cohorts.
A: In the internal training cohort, the Target Immunotherapy Predictive Model (TIPM)’s calibration curve closely followed the diagonal line, indicating strong agreement between predicted and observed probabilities. Other models exhibited greater deviations from ideal calibration; B: In the internal validation cohort, the TIPM model demonstrated good accuracy across both high- and low-incidence regions, though it slightly overestimated risk in the central region; C: In the external validation cohort, TIPM closely followed the actual curve, showing better calibration than other models, while conventional models tended to overestimate patient risk. TIPM: Target Immunotherapy Predictive Model; TNM: Tumor-node-metastasis; BCLC: Barcelona Clinic Liver Cancer; CNLC: China Liver Cancer; HKLC: Hong Kong Liver Cancer; CRAFITY: C-reactive protein and alpha-fetoprotein in immunotherapy.
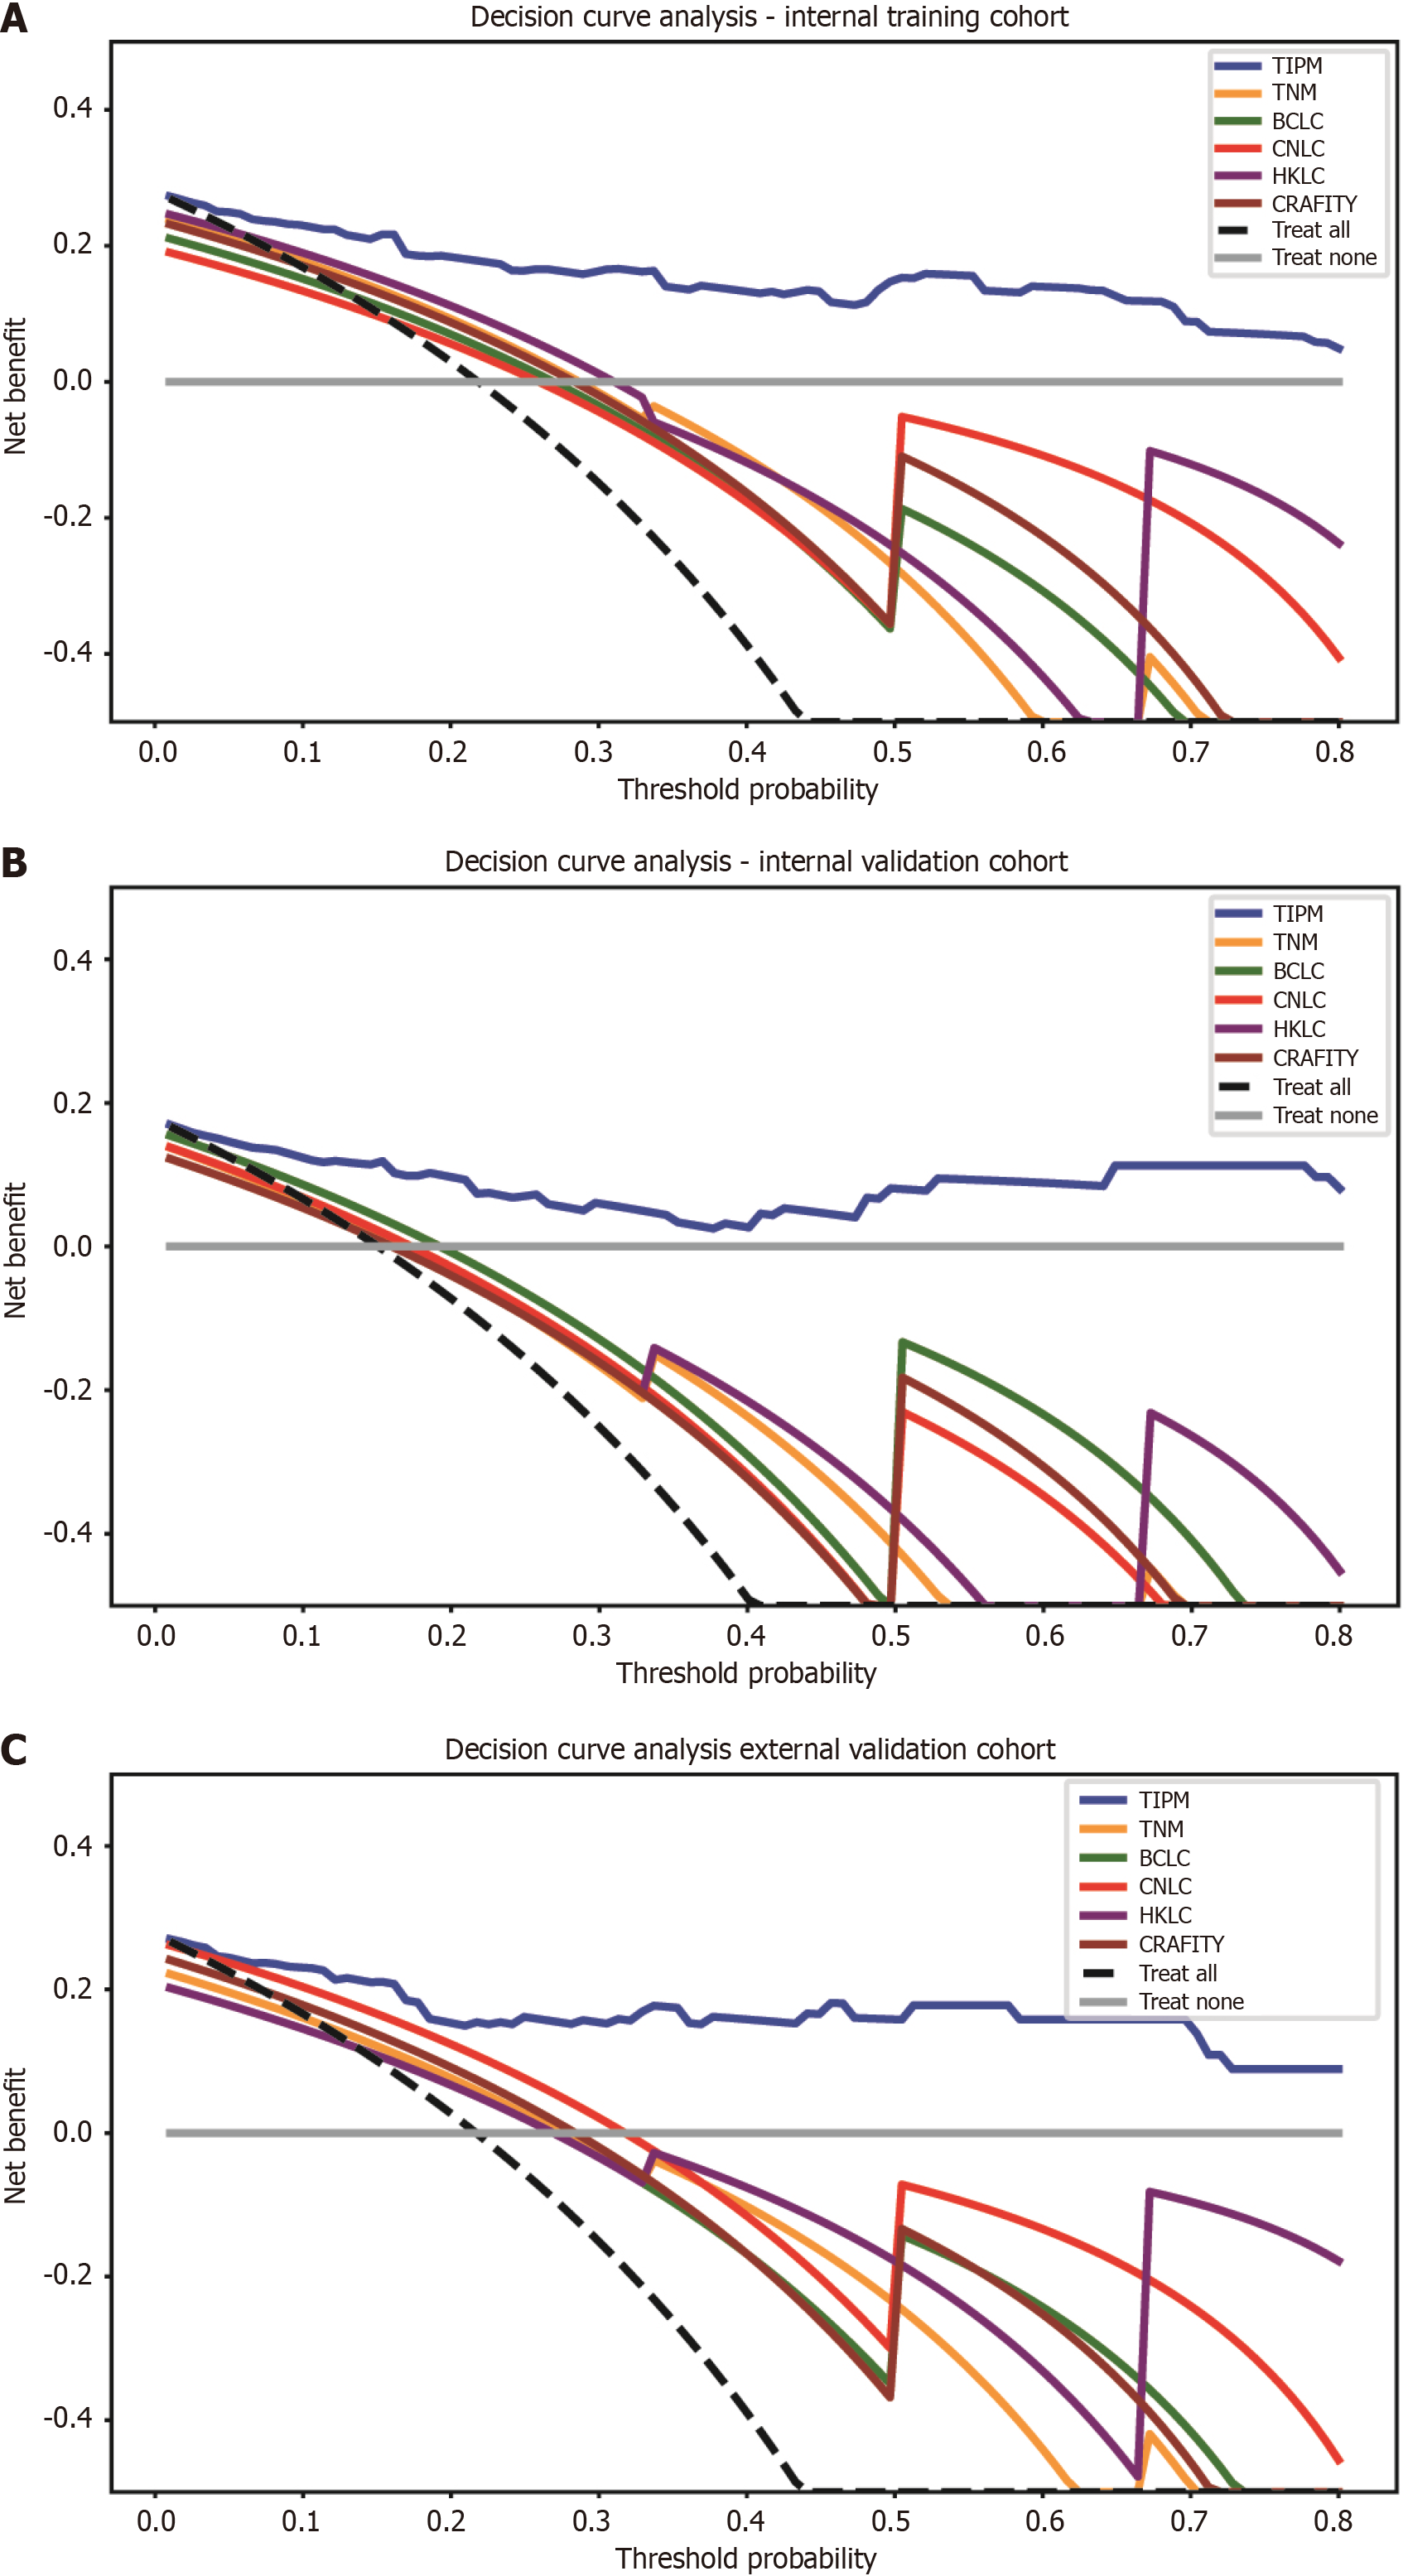
Figure 6 Decision curve analysis for model comparison across cohorts.
A: In the internal training cohort, the Target Immunotherapy Predictive Model (TIPM) is positioned in the upper right corner of the graph, indicating the highest clinical benefit rate; B: In the internal validation cohort, TIPM’s performance slightly decreased compared to the training cohort but remained in the upper right corner; C: In the external validation cohort, TIPM continued to occupy the upper right corner, demonstrating its robust external generalizability. TIPM: Target Immunotherapy Predictive Model; TNM: Tumor-node-metastasis; BCLC: Barcelona Clinic Liver Cancer; CNLC: China Liver Cancer; HKLC: Hong Kong Liver Cancer; CRAFITY: C-reactive protein and alpha-fetoprotein in immunotherapy.
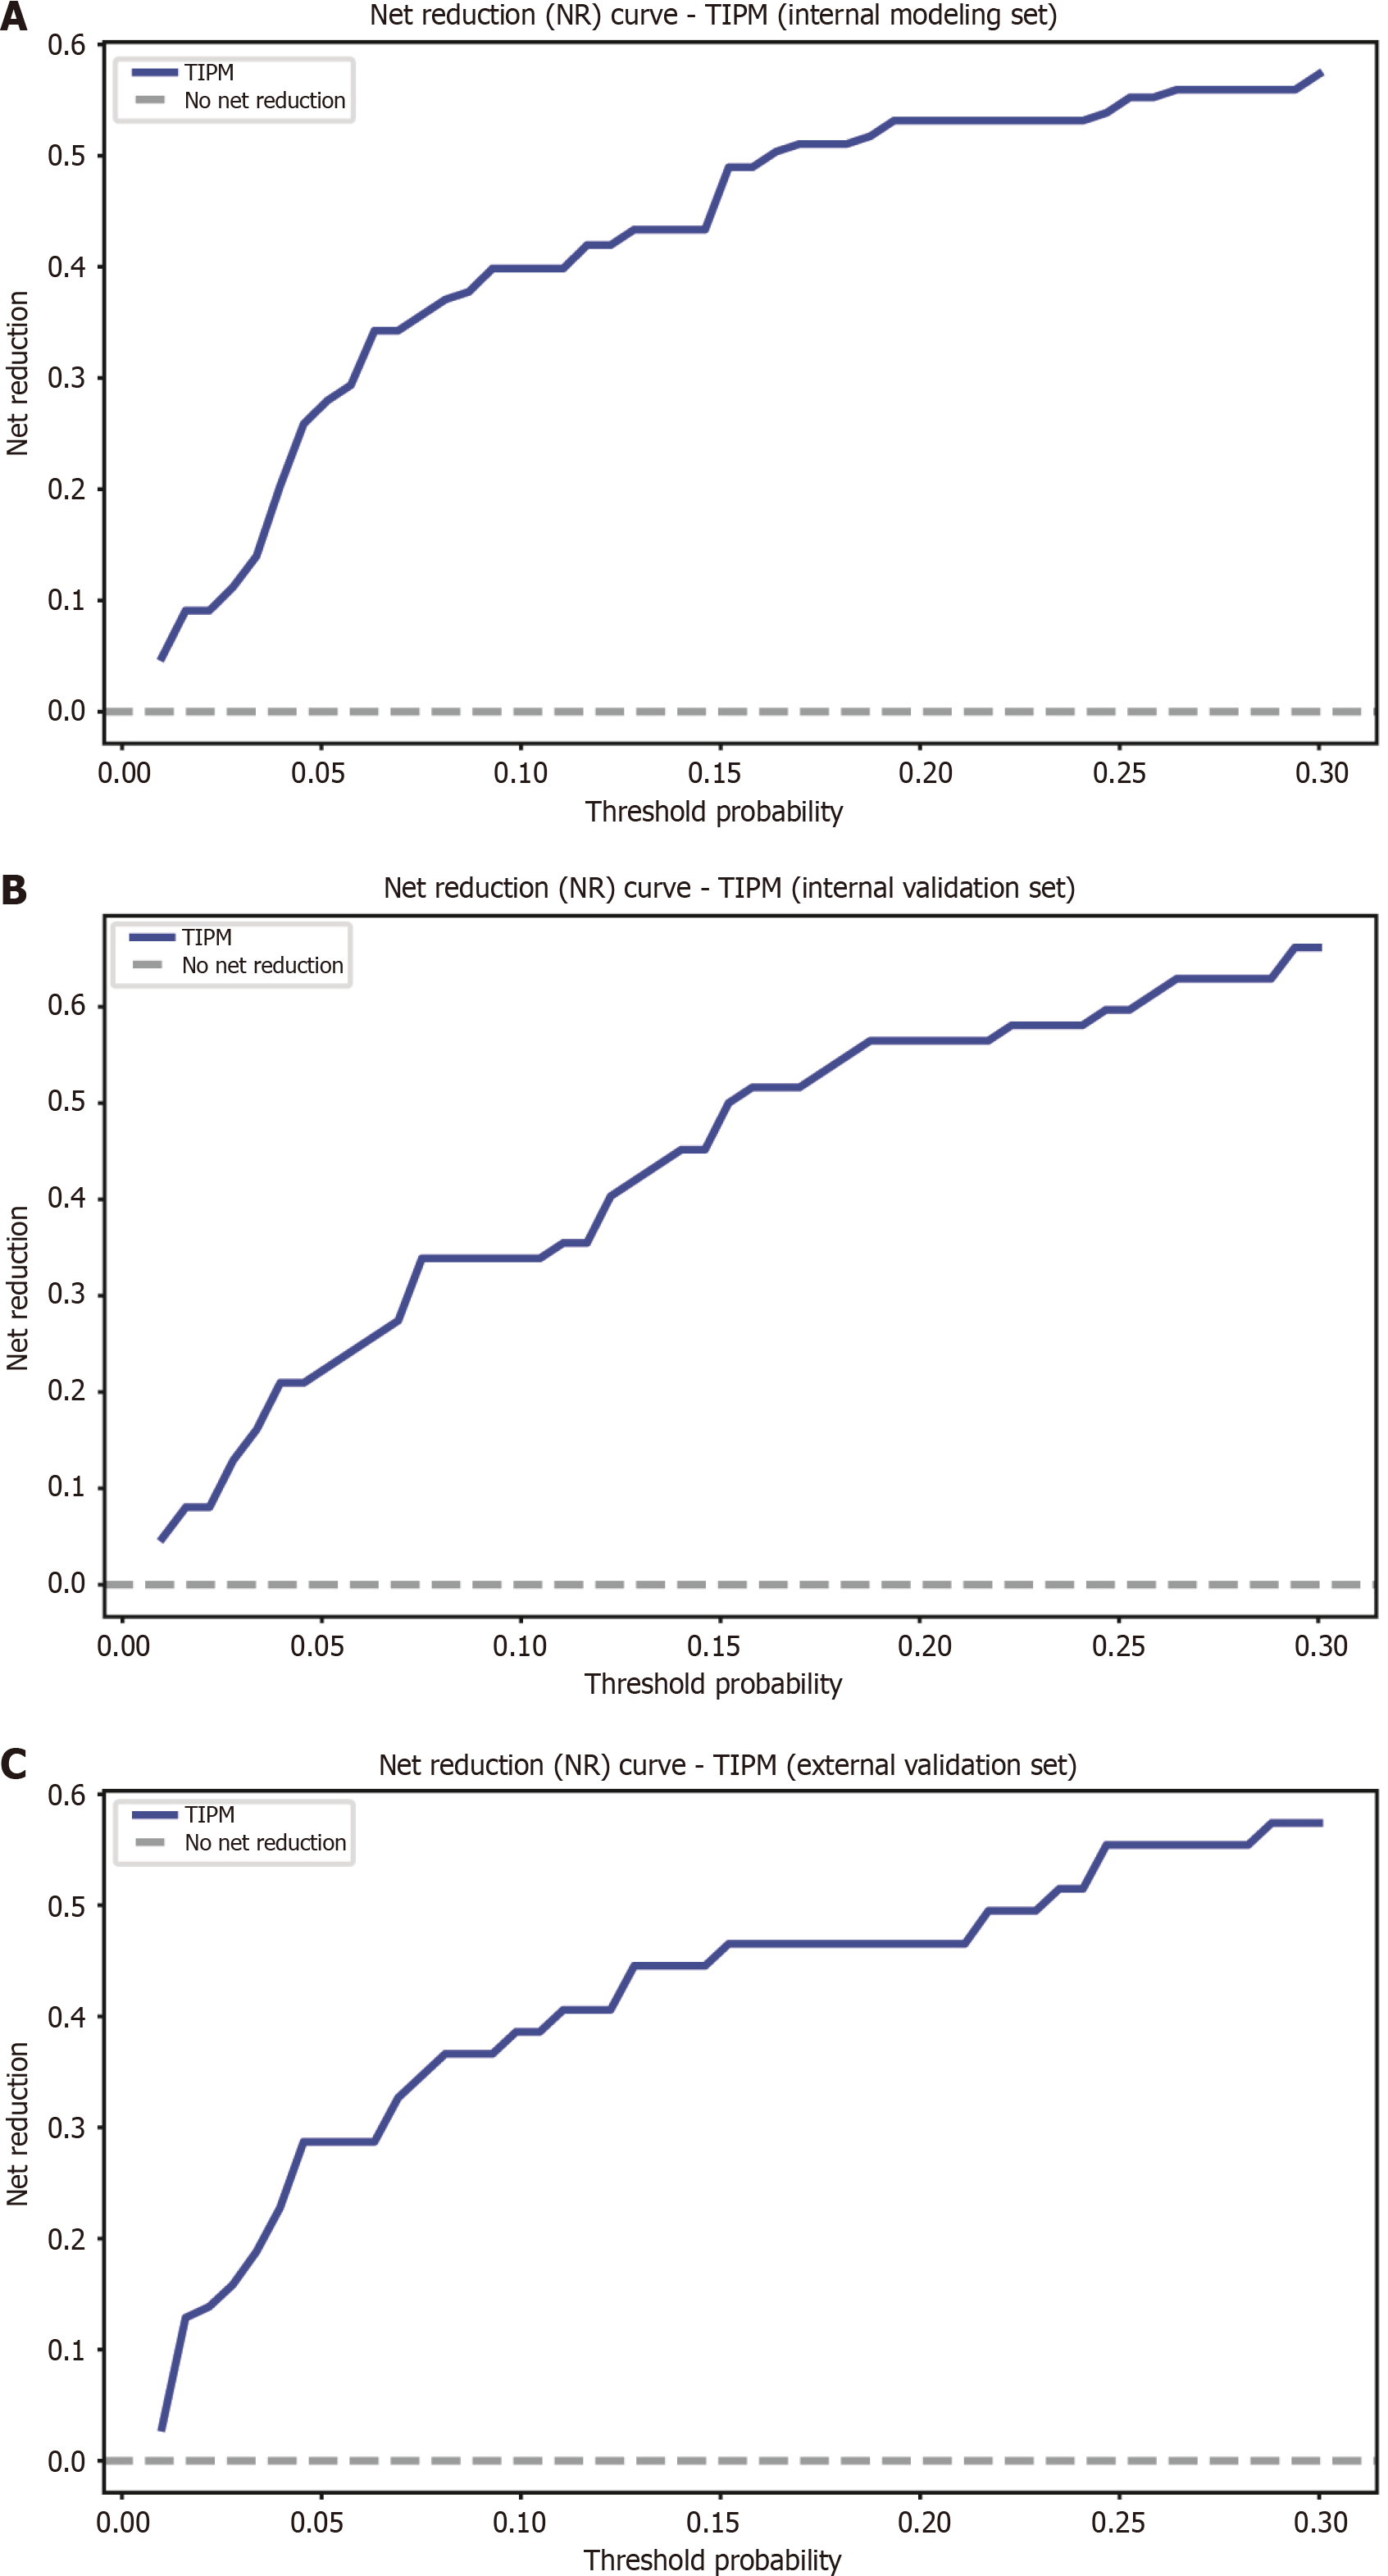
Figure 7 Net reduction graphs for Target Immunotherapy Predictive Model across various groups.
A: Net reduction (NR) curve for the Target Immunotherapy Predictive Model (TIPM) in the internal training cohort; B: NR curve for TIPM in the internal validation cohort; C: NR curve for TIPM in the external validation cohort. The graphs show that TIPM consistently achieves a greater net reduction, emphasizing its ability to minimize unnecessary interventions across all groups. TIPM: Target Immunotherapy Predictive Model.
- Citation: Tu HB, Feng SY, Chen LH, Huang YJ, Zhang JZ, Peng SY, Lin DL, Ye XJ. Integrating ultrasound and serum indicators for evaluating outcomes of targeted immunotherapy in advanced liver cancer. World J Gastrointest Oncol 2025; 17(5): 105872
- URL: https://www.wjgnet.com/1948-5204/full/v17/i5/105872.htm
- DOI: https://dx.doi.org/10.4251/wjgo.v17.i5.105872


