Copyright
©The Author(s) 2025.
World J Gastrointest Oncol. May 15, 2025; 17(5): 105872
Published online May 15, 2025. doi: 10.4251/wjgo.v17.i5.105872
Published online May 15, 2025. doi: 10.4251/wjgo.v17.i5.105872
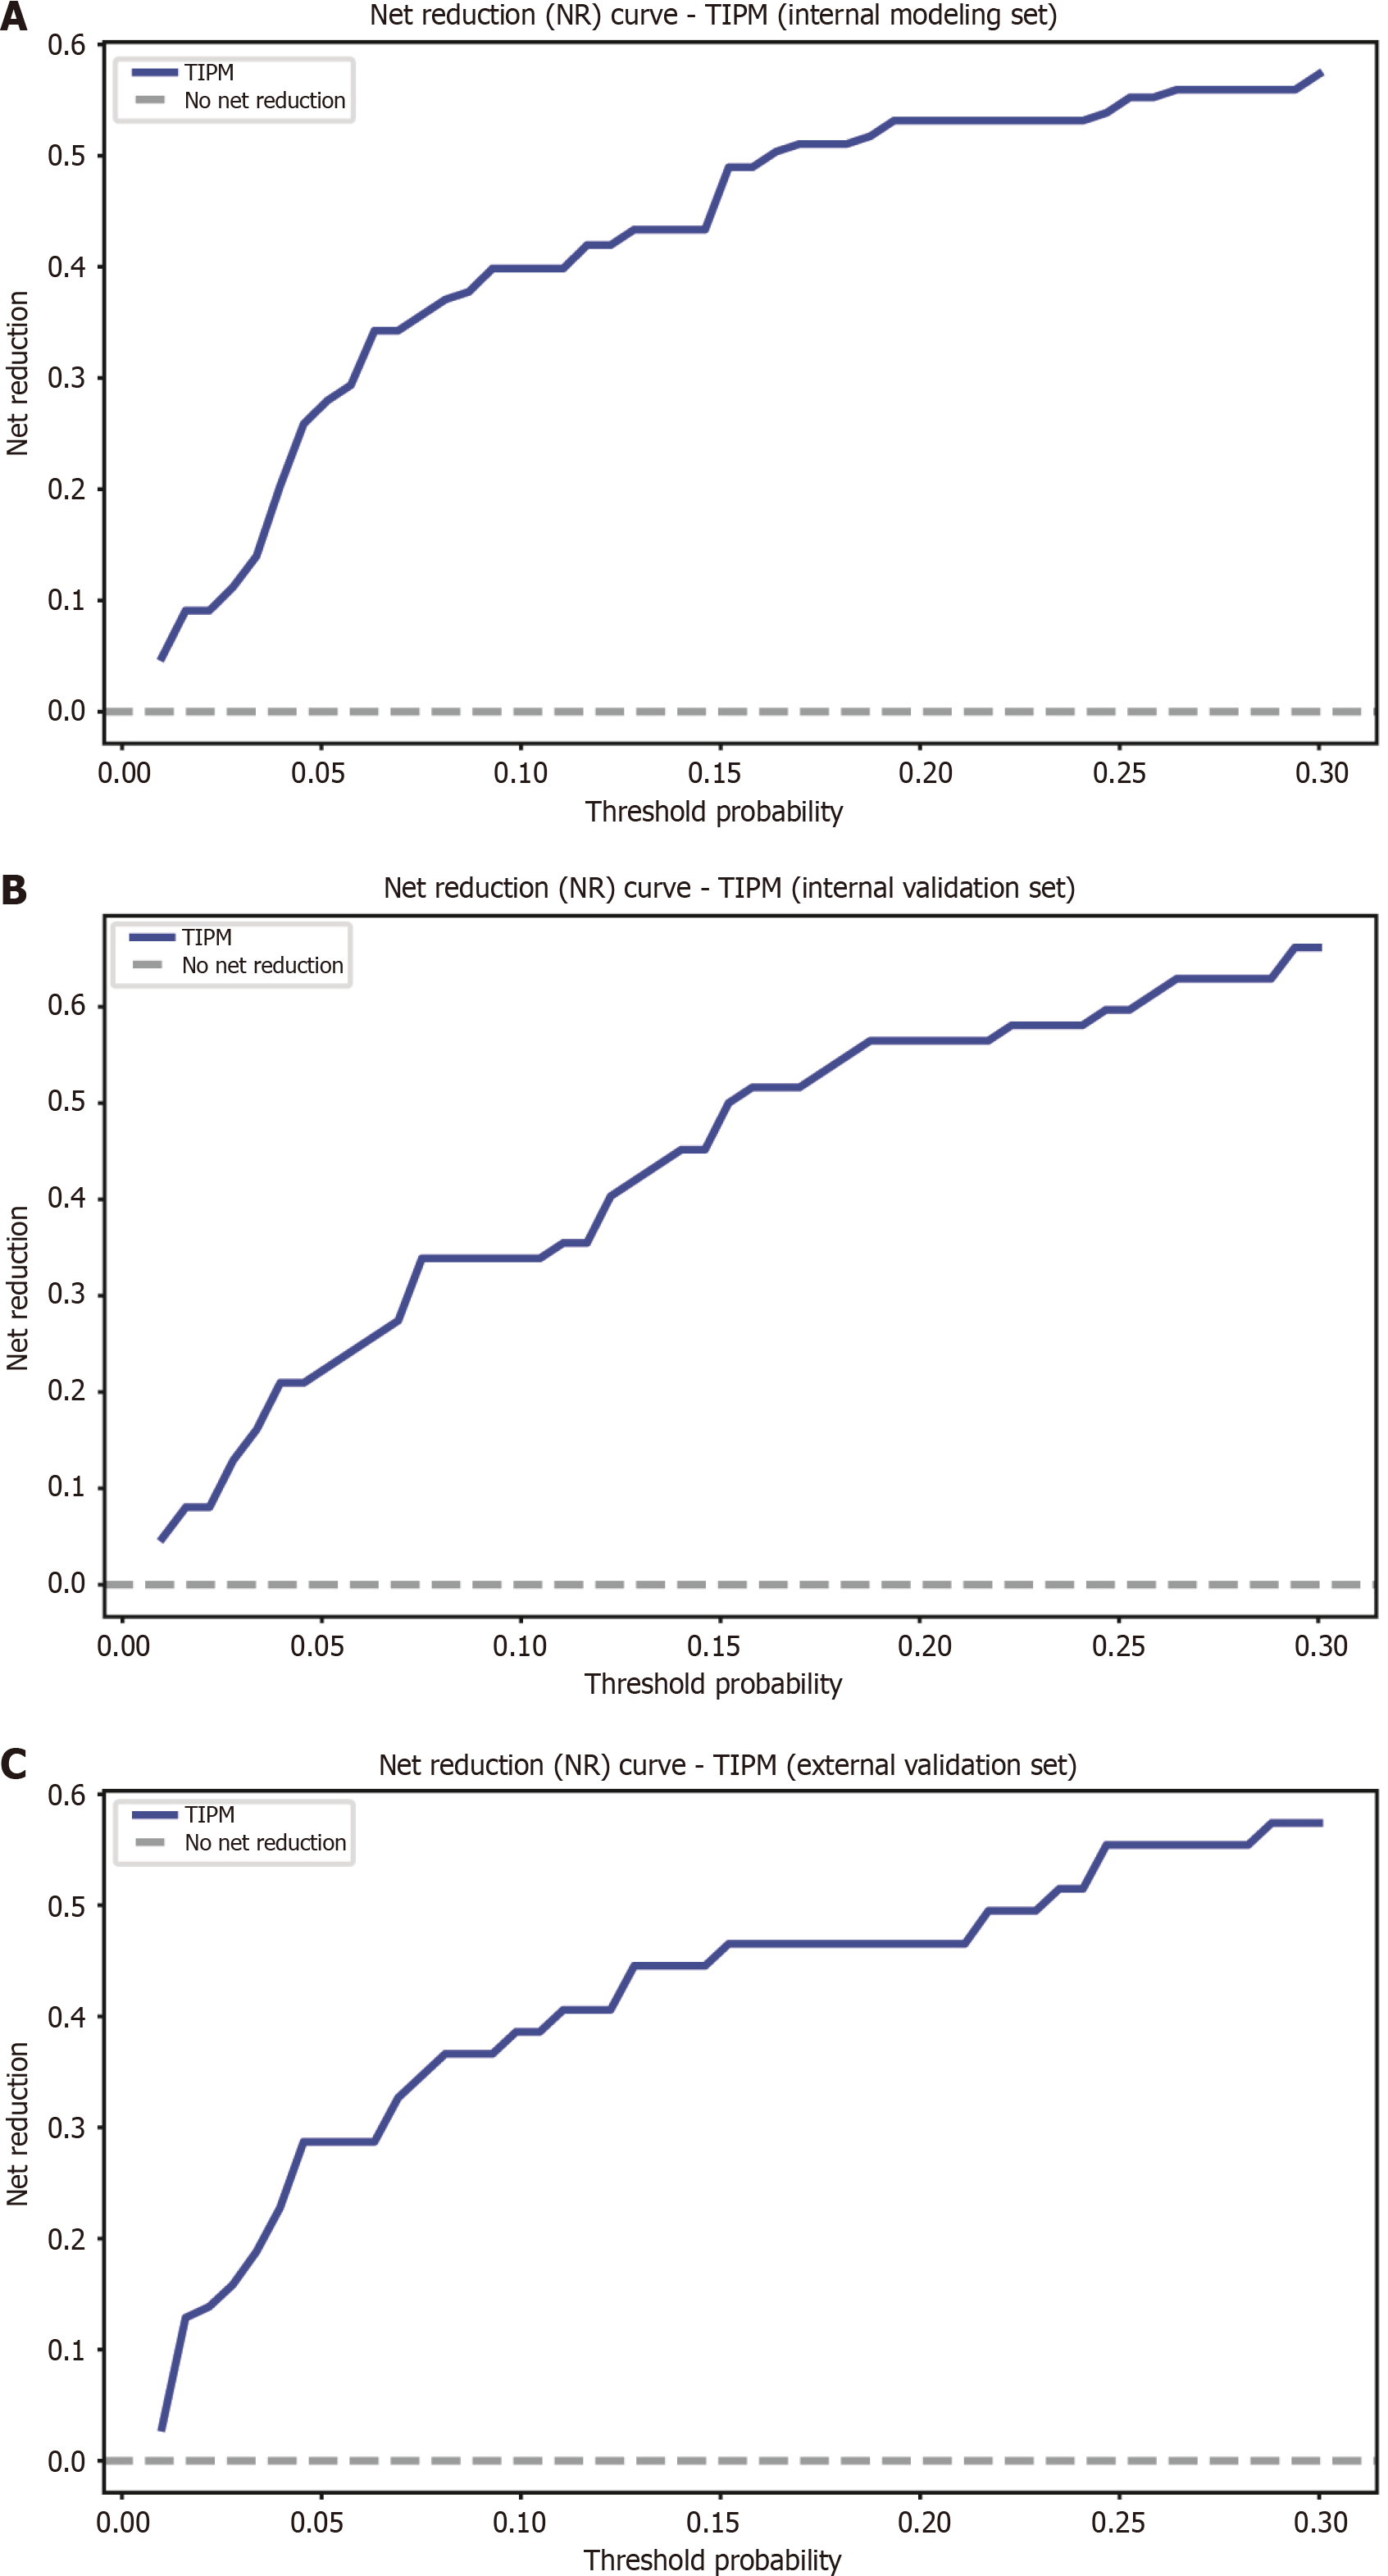
Figure 7 Net reduction graphs for Target Immunotherapy Predictive Model across various groups.
A: Net reduction (NR) curve for the Target Immunotherapy Predictive Model (TIPM) in the internal training cohort; B: NR curve for TIPM in the internal validation cohort; C: NR curve for TIPM in the external validation cohort. The graphs show that TIPM consistently achieves a greater net reduction, emphasizing its ability to minimize unnecessary interventions across all groups. TIPM: Target Immunotherapy Predictive Model.
- Citation: Tu HB, Feng SY, Chen LH, Huang YJ, Zhang JZ, Peng SY, Lin DL, Ye XJ. Integrating ultrasound and serum indicators for evaluating outcomes of targeted immunotherapy in advanced liver cancer. World J Gastrointest Oncol 2025; 17(5): 105872
- URL: https://www.wjgnet.com/1948-5204/full/v17/i5/105872.htm
- DOI: https://dx.doi.org/10.4251/wjgo.v17.i5.105872


