Copyright
©The Author(s) 2025.
World J Gastrointest Oncol. May 15, 2025; 17(5): 105872
Published online May 15, 2025. doi: 10.4251/wjgo.v17.i5.105872
Published online May 15, 2025. doi: 10.4251/wjgo.v17.i5.105872
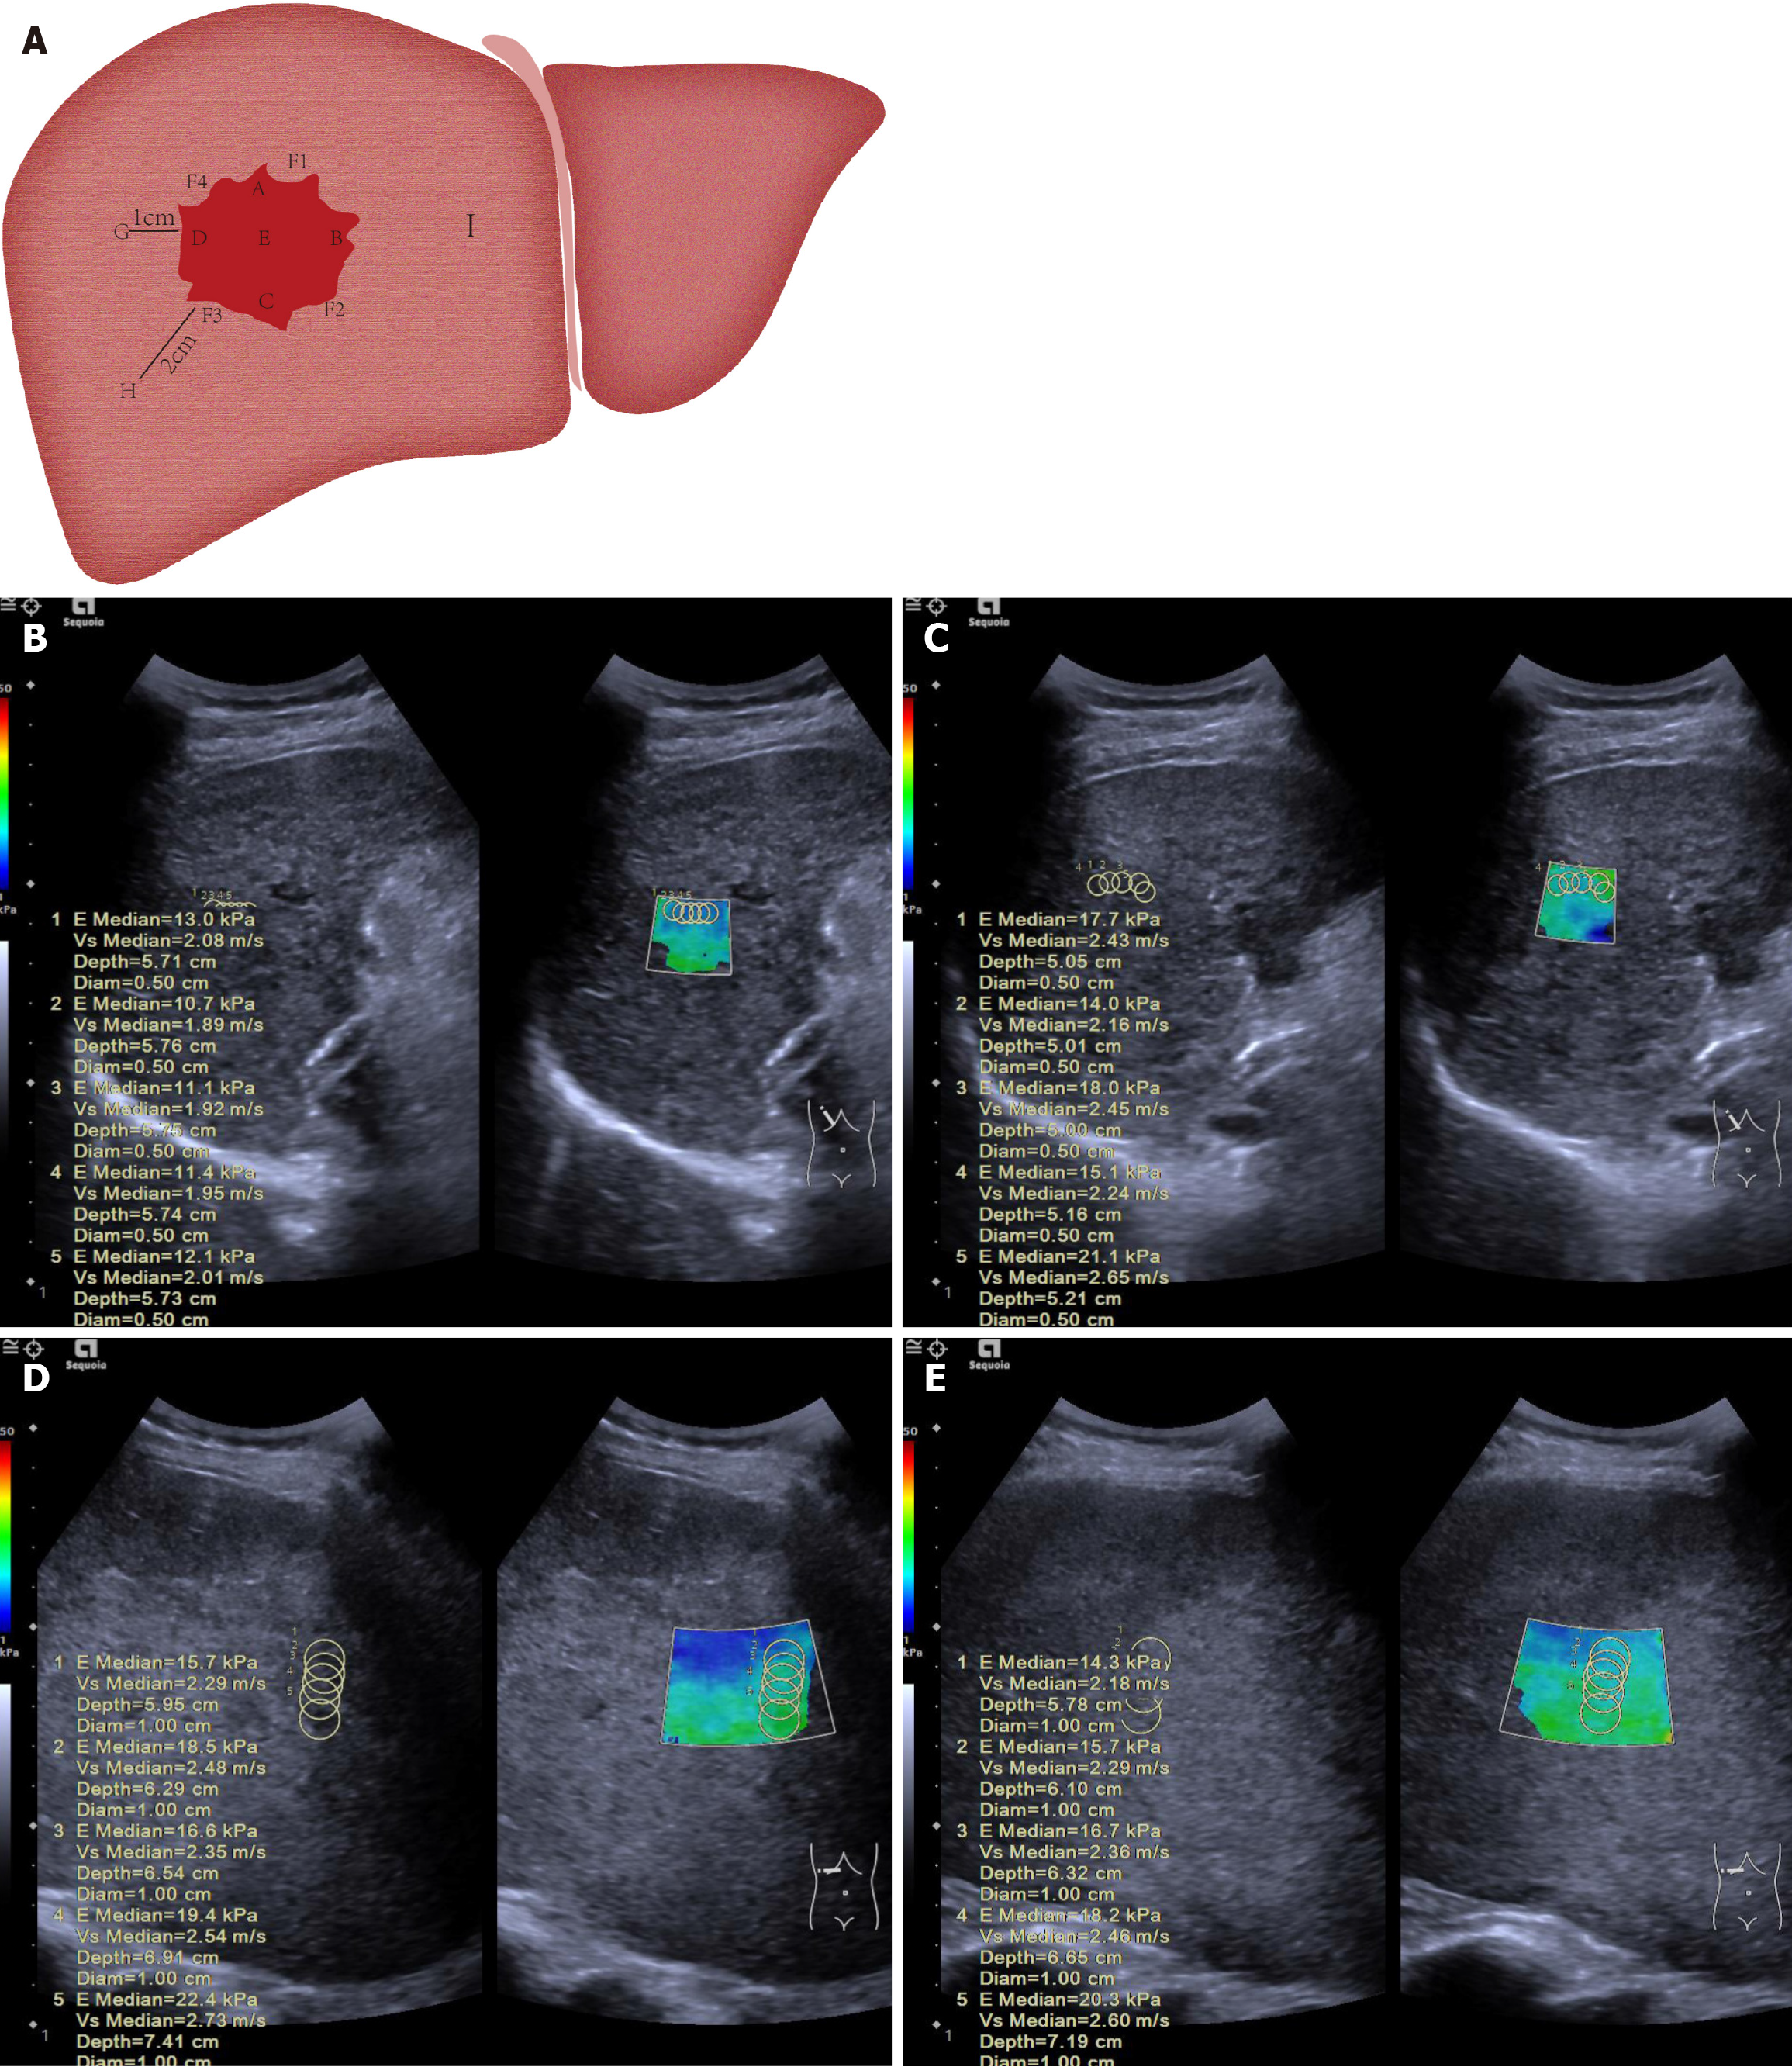
Figure 2 Diagram illustrating measurement of liver tumor and surrounding tissue stiffness.
A: The 12-point clock-face method was used to define points within and around the tumor: A (superior, 12 o’clock, closest to transducer), B (left lateral, 3 o’clock), C (inferior, 6 o’clock, furthest from transducer), D (right lateral, 9 o’clock), and E (central). Peritumoral tissue (normal liver adjacent to the tumor capsule) was sampled at F1 (2 o’clock), F2 (5 o’clock), F3 (8 o’clock), and F4 (11 o’clock). Normal liver was sampled at G (1 cm), H (2 cm), and I (> 2 cm) from the tumor margin; B: A 52-year-old male patient had a pre-treatment mean stiffness of 11.7 kPa in the anterior part of the tumor; C: After treatment, the mean stiffness increased to 17.1 kPa, with stiffness also rising at other measurement points, indicating ΔT > 0. This patient had no tumor progression at 26 weeks, confirming treatment effectiveness; D: A 48-year-old male patient had a pre-treatment mean stiffness of 18.5 kPa in the anterior part of the tumor; E: After treatment, the stiffness dropped to 17.0 kPa, with similar decreases observed at other points, indicating ΔT < 0. This patient showed tumor progression at 12 weeks.
- Citation: Tu HB, Feng SY, Chen LH, Huang YJ, Zhang JZ, Peng SY, Lin DL, Ye XJ. Integrating ultrasound and serum indicators for evaluating outcomes of targeted immunotherapy in advanced liver cancer. World J Gastrointest Oncol 2025; 17(5): 105872
- URL: https://www.wjgnet.com/1948-5204/full/v17/i5/105872.htm
- DOI: https://dx.doi.org/10.4251/wjgo.v17.i5.105872


