Copyright
©The Author(s) 2025.
World J Gastrointest Oncol. May 15, 2025; 17(5): 105872
Published online May 15, 2025. doi: 10.4251/wjgo.v17.i5.105872
Published online May 15, 2025. doi: 10.4251/wjgo.v17.i5.105872
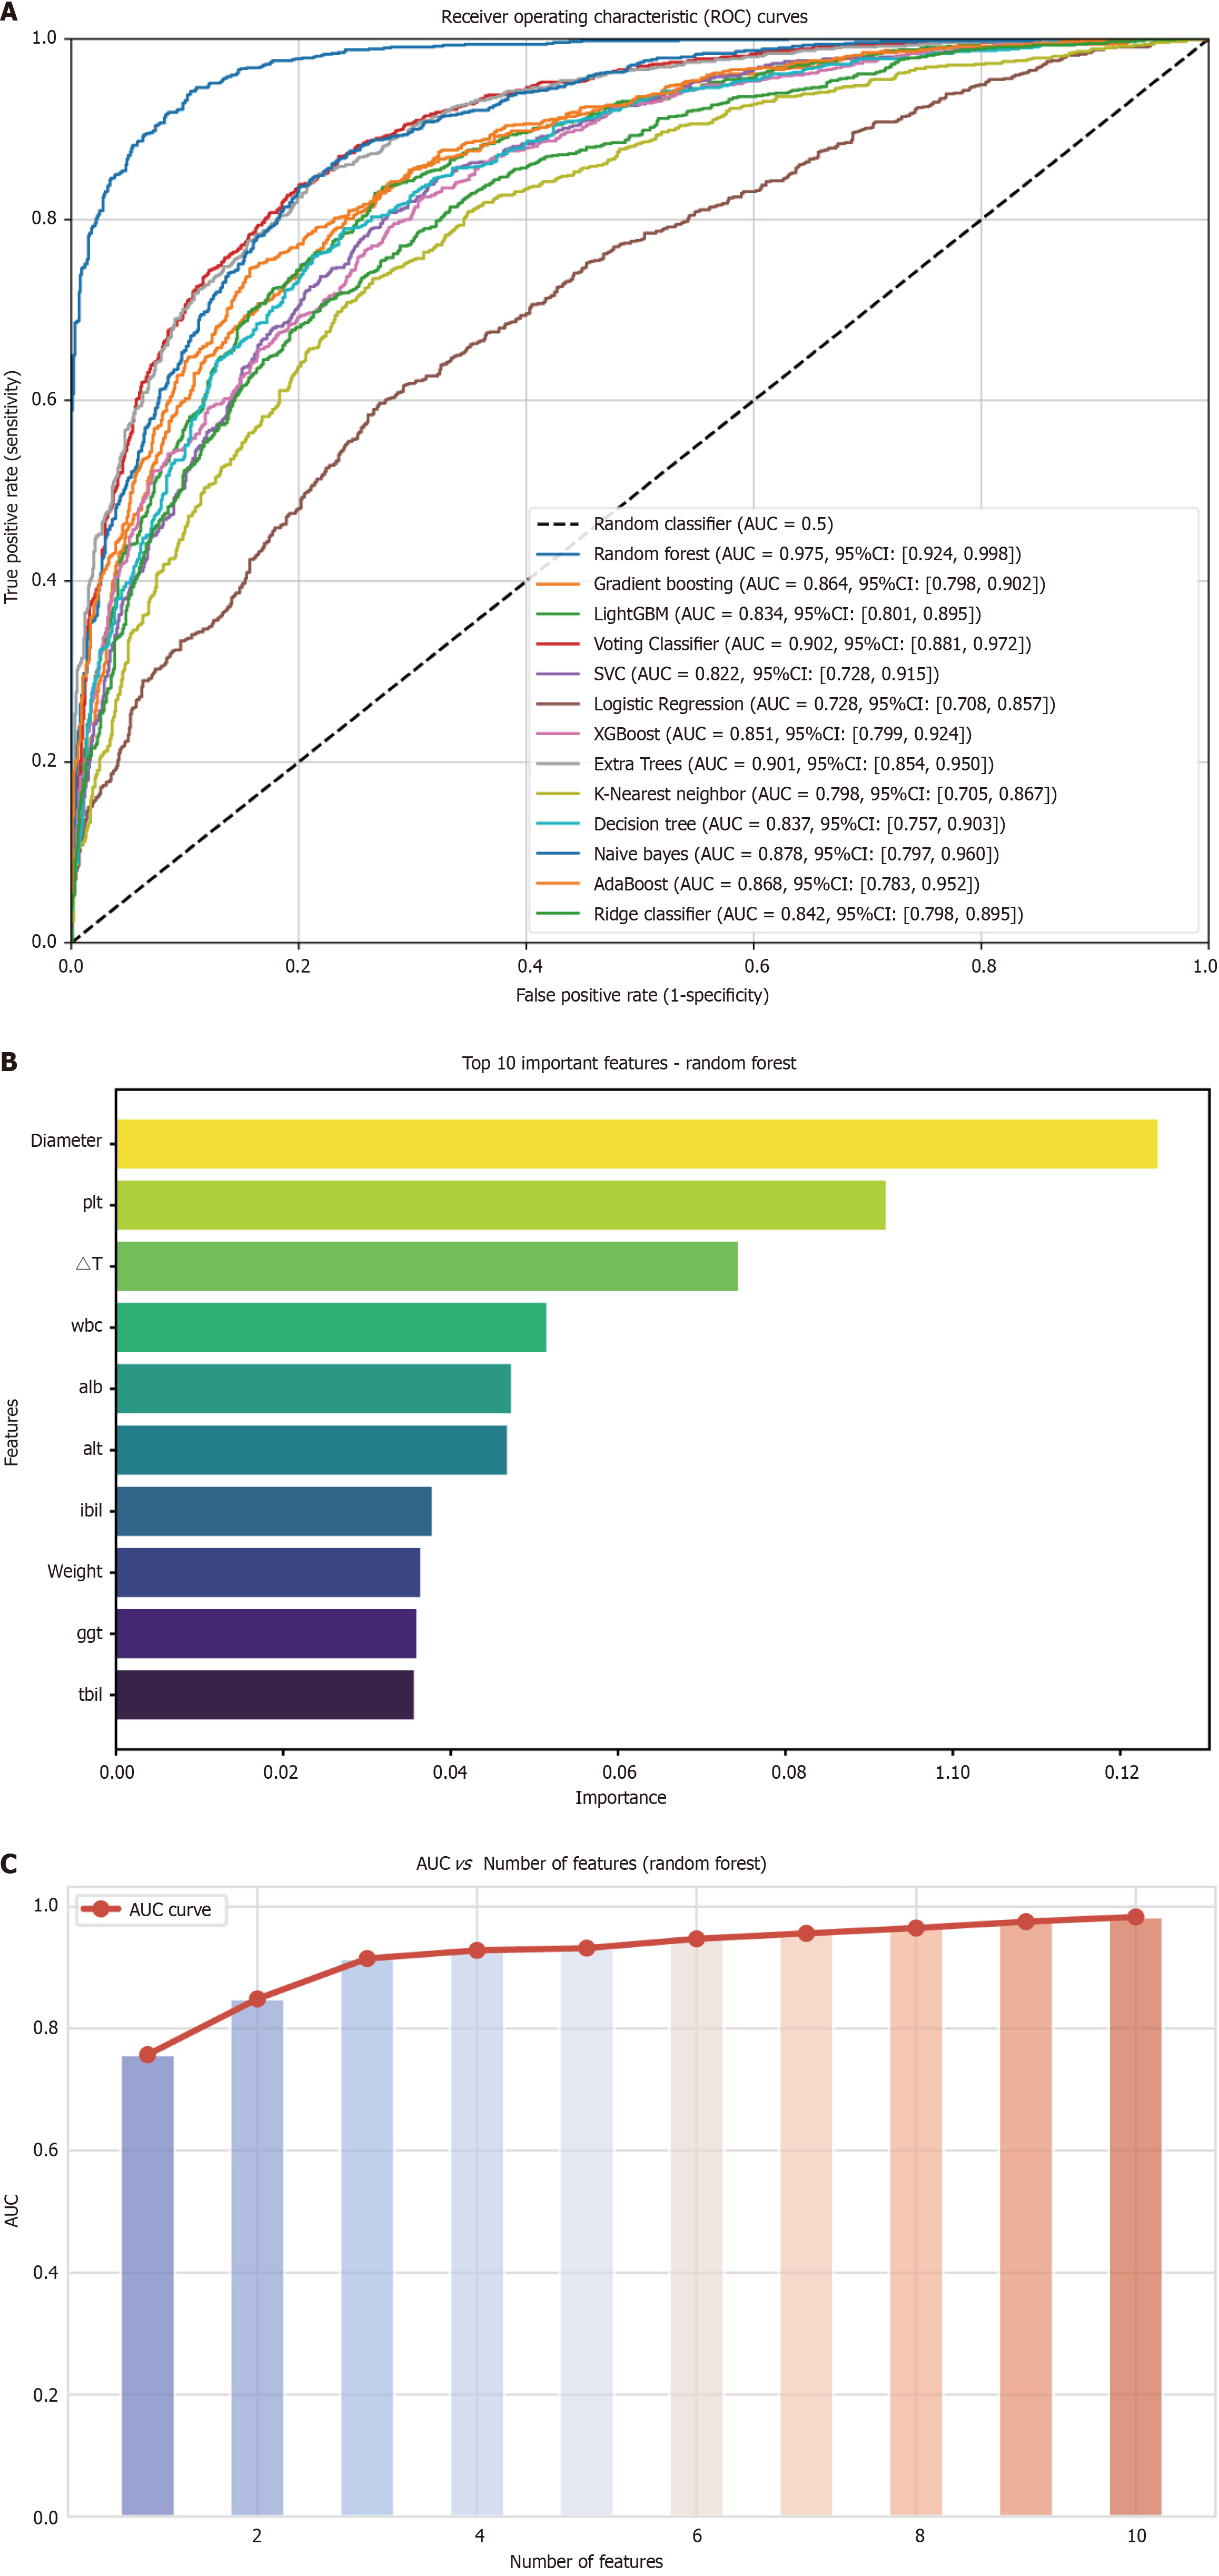
Figure 3 Analysis of variable importance and its correlation with area under the curve.
A: Receiver operating characteristic curves of different machine learning models in the internal validation cohort; B: The top ten most important variables, ranked by their contribution to the model; C: Area under the curve values corresponding to varying numbers of selected variables. A peak area under the curve is observed with four variables. AUC: Area under the curve; CI: Confidence interval; PLT: Platelet count; WBC: White blood cell count; ALB: Albumin; ALT: Alanine aminotransferase; IBIL: Indirect bilirubin; GGT: Gamma-glutamyl transferase; TBIL: Total bilirubin.
- Citation: Tu HB, Feng SY, Chen LH, Huang YJ, Zhang JZ, Peng SY, Lin DL, Ye XJ. Integrating ultrasound and serum indicators for evaluating outcomes of targeted immunotherapy in advanced liver cancer. World J Gastrointest Oncol 2025; 17(5): 105872
- URL: https://www.wjgnet.com/1948-5204/full/v17/i5/105872.htm
- DOI: https://dx.doi.org/10.4251/wjgo.v17.i5.105872


