Copyright
©The Author(s) 2025.
World J Gastrointest Oncol. May 15, 2025; 17(5): 104522
Published online May 15, 2025. doi: 10.4251/wjgo.v17.i5.104522
Published online May 15, 2025. doi: 10.4251/wjgo.v17.i5.104522
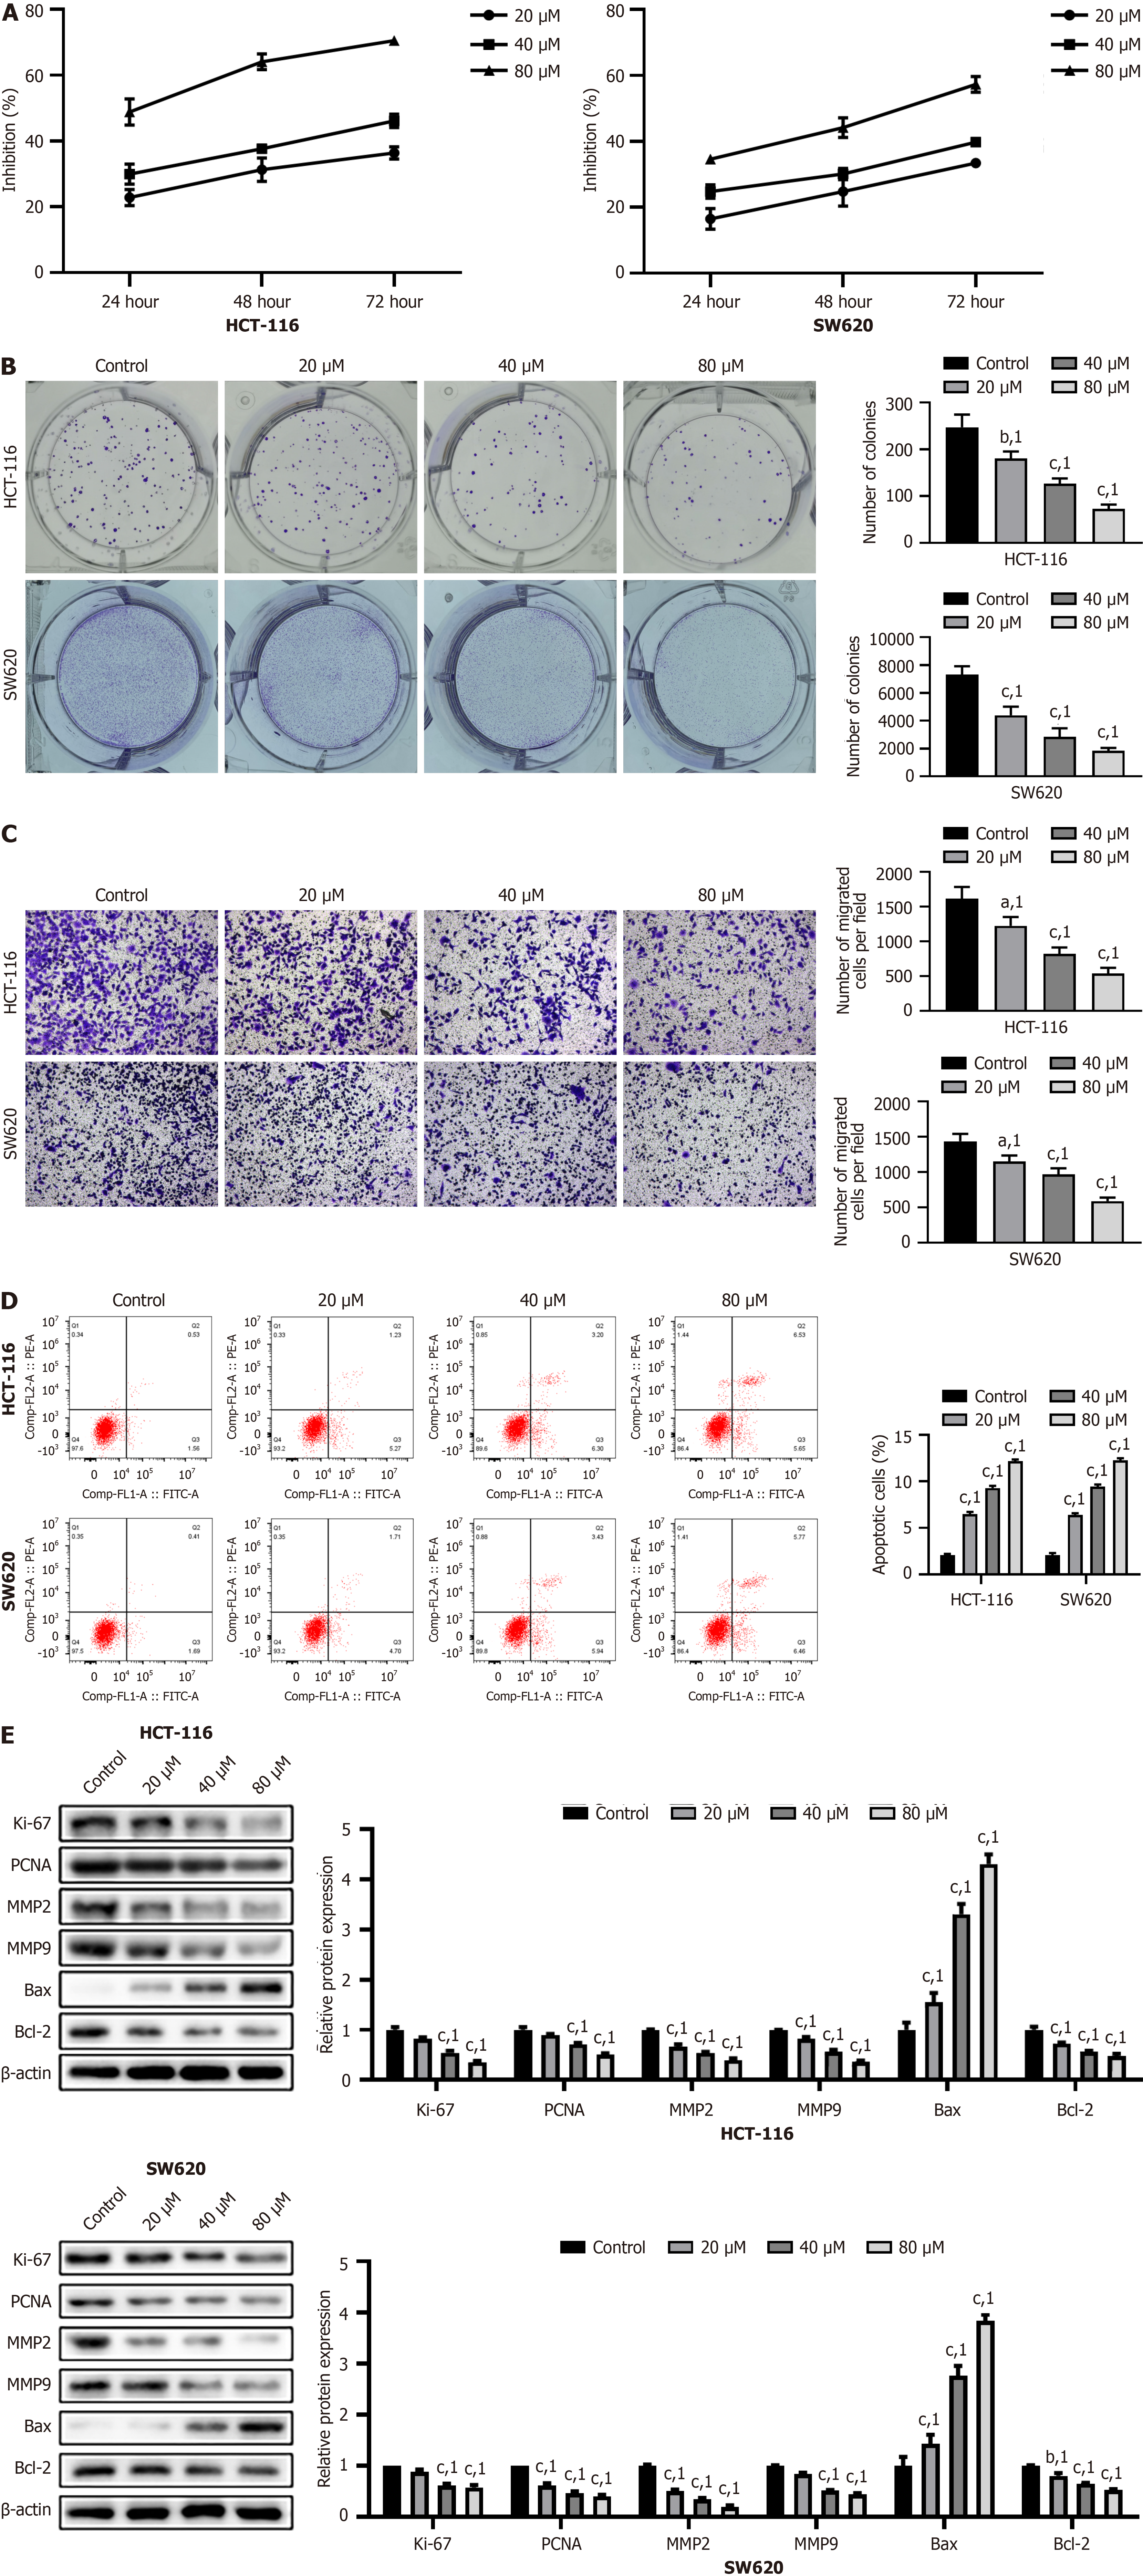
Figure 1 Effects of simvastatin on cell viability, proliferation, migration, and apoptosis in HCT-116 and SW620 cells.
A: Cell viability detected by cell counting kit-8 assay; B: Cell proliferation detected by colony formation assay; C: Cell migration measured by Transwell assay; D: Cell apoptosis detected by flow cytometry; E: The expression of Ki-67, proliferating cell nuclear antigen, MMP2, MMP9, Bcl-2 and Bax analyzed by Western blot. aP < 0.05. bP < 0.01. cP < 0.001. 1P vs control group. PCNA: Proliferating cell nuclear antigen.
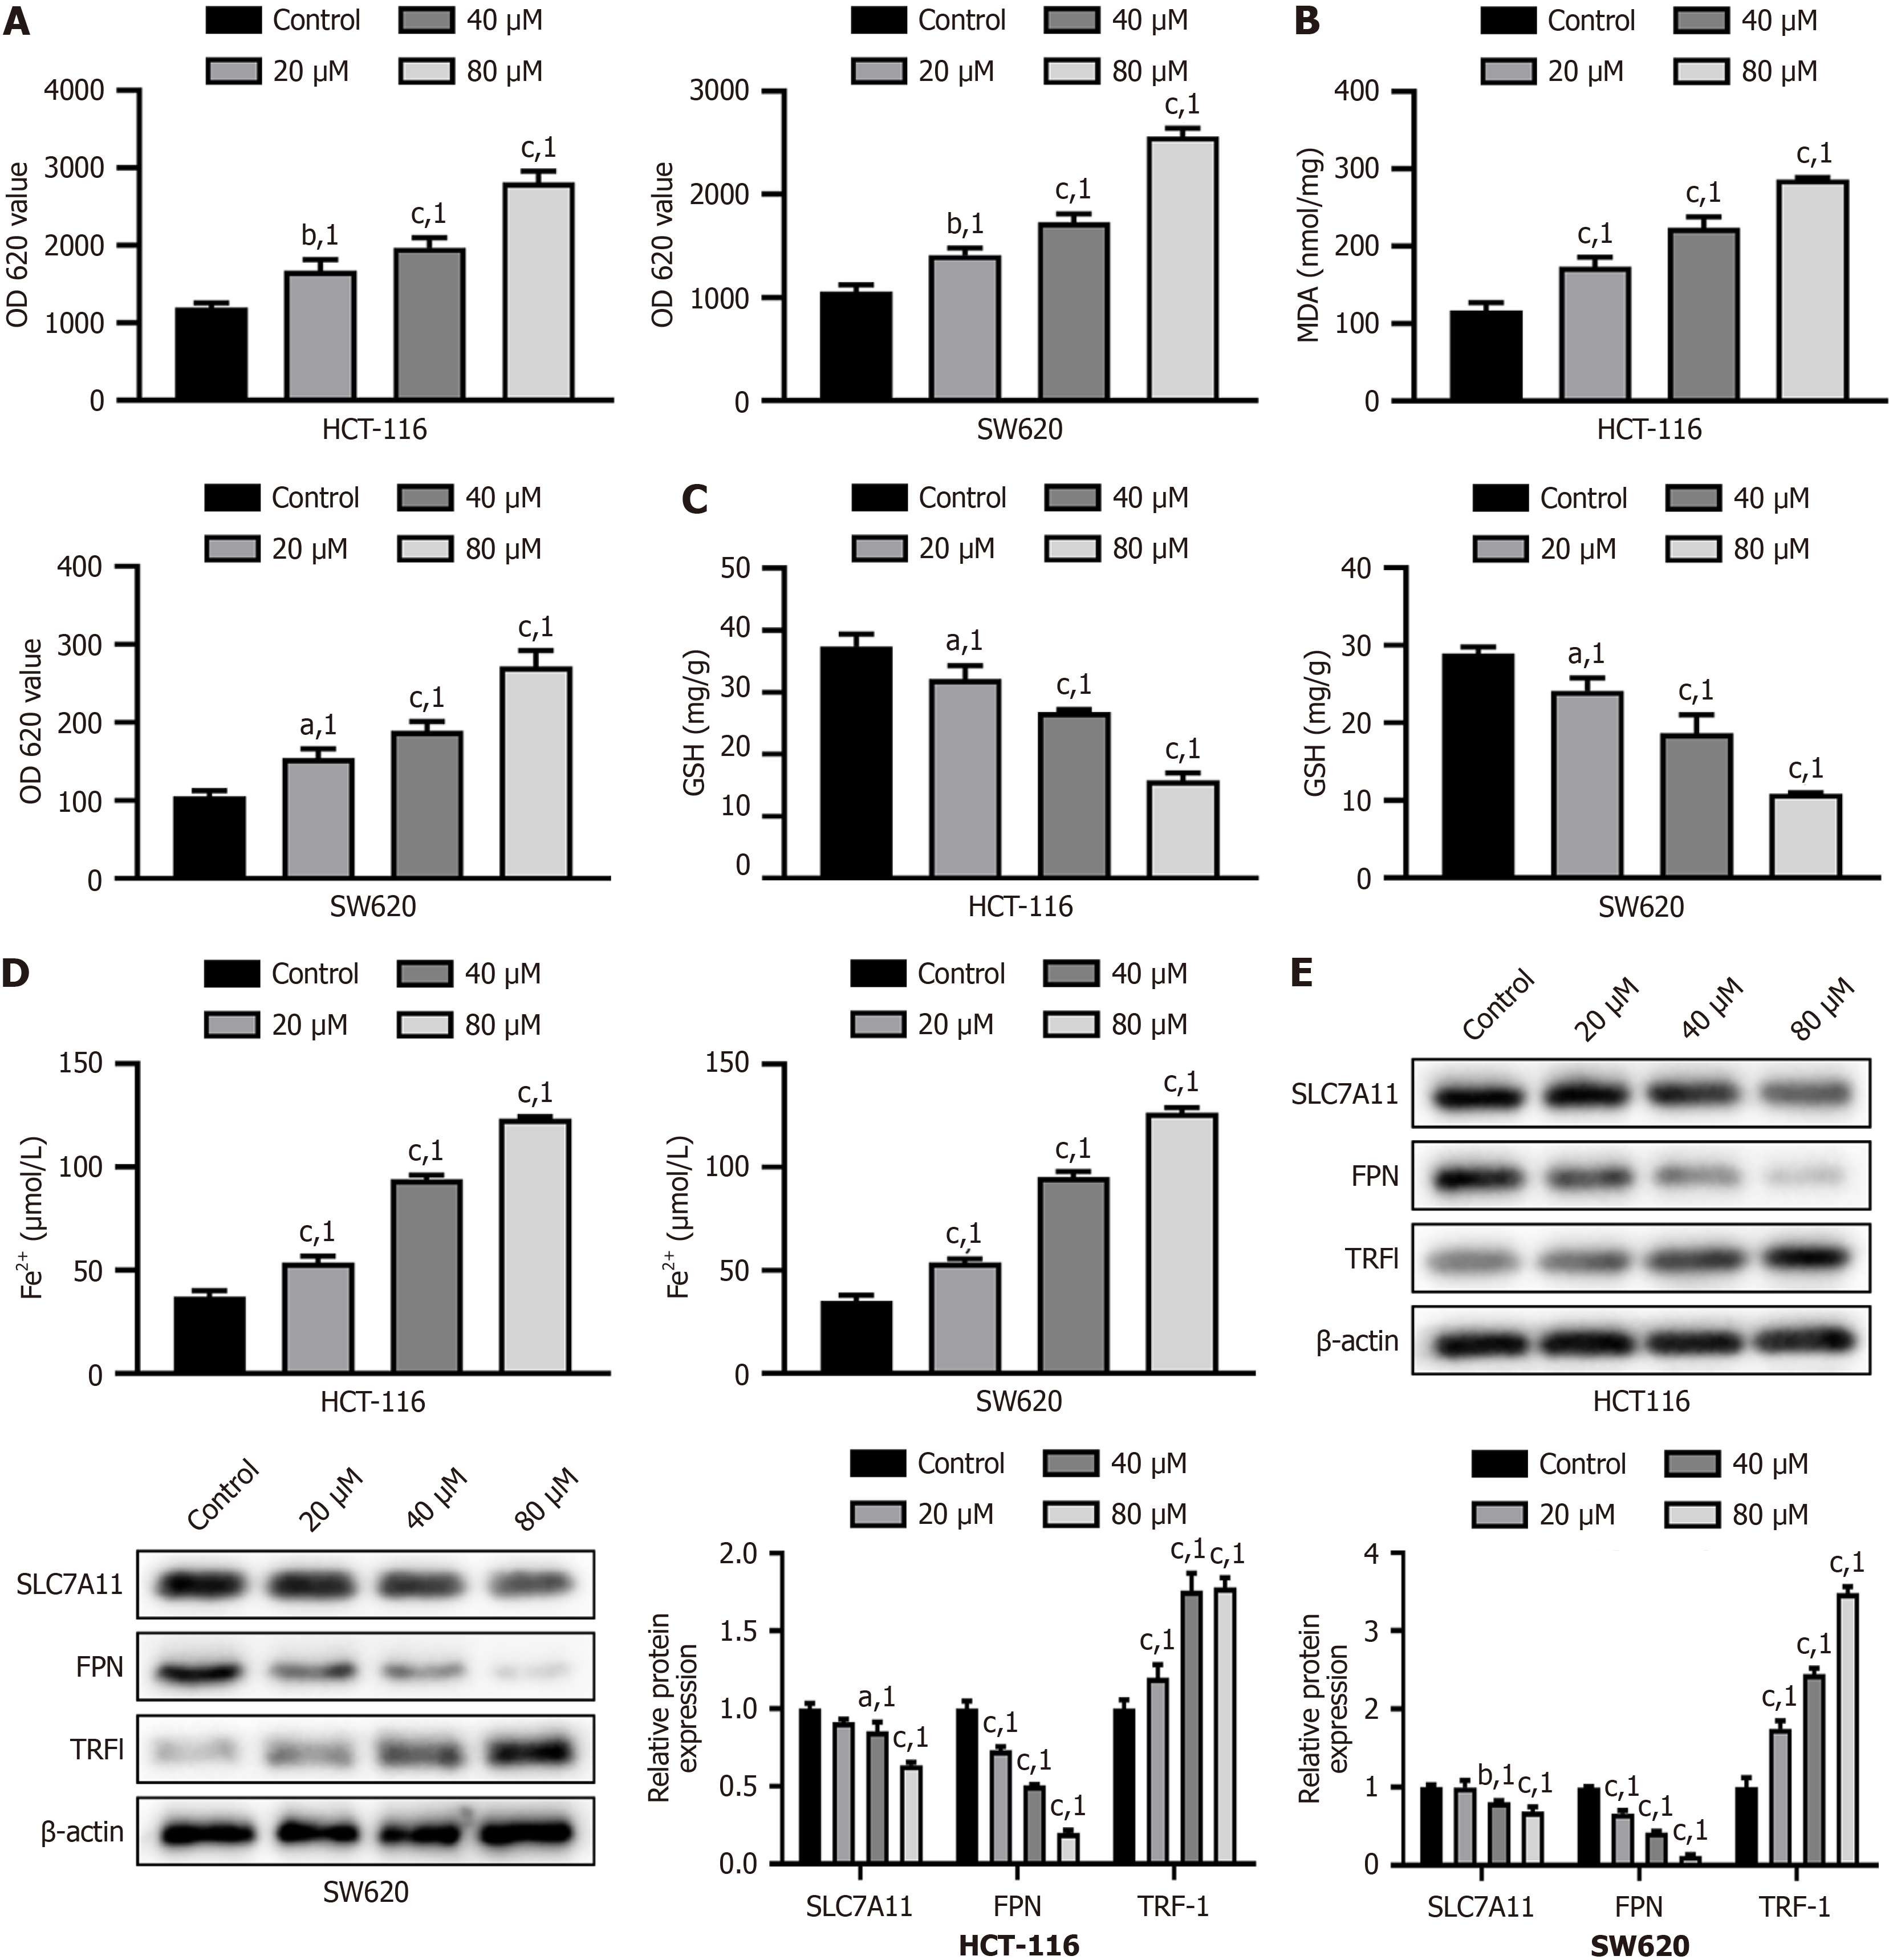
Figure 2 Simvastatin-induced oxidative stress and ferroptosis in HCT-116 and SW620 cells.
A: Reactive oxygen species content in cells; B: Malondialdehyde content in cells; C: Glutathione content in cells; D: Ferrous ion levels in cells; E: The expression of SLC7A11, ferroportin and TRF1 analyzed by Western blot. aP < 0.05. bP < 0.01. cP < 0.001. 1P vs control group. OD: Optical density; FPN: Ferroportin; MDA: Malondialdehyde; GSH: Glutathione; Fe2+: Ferrous ion.
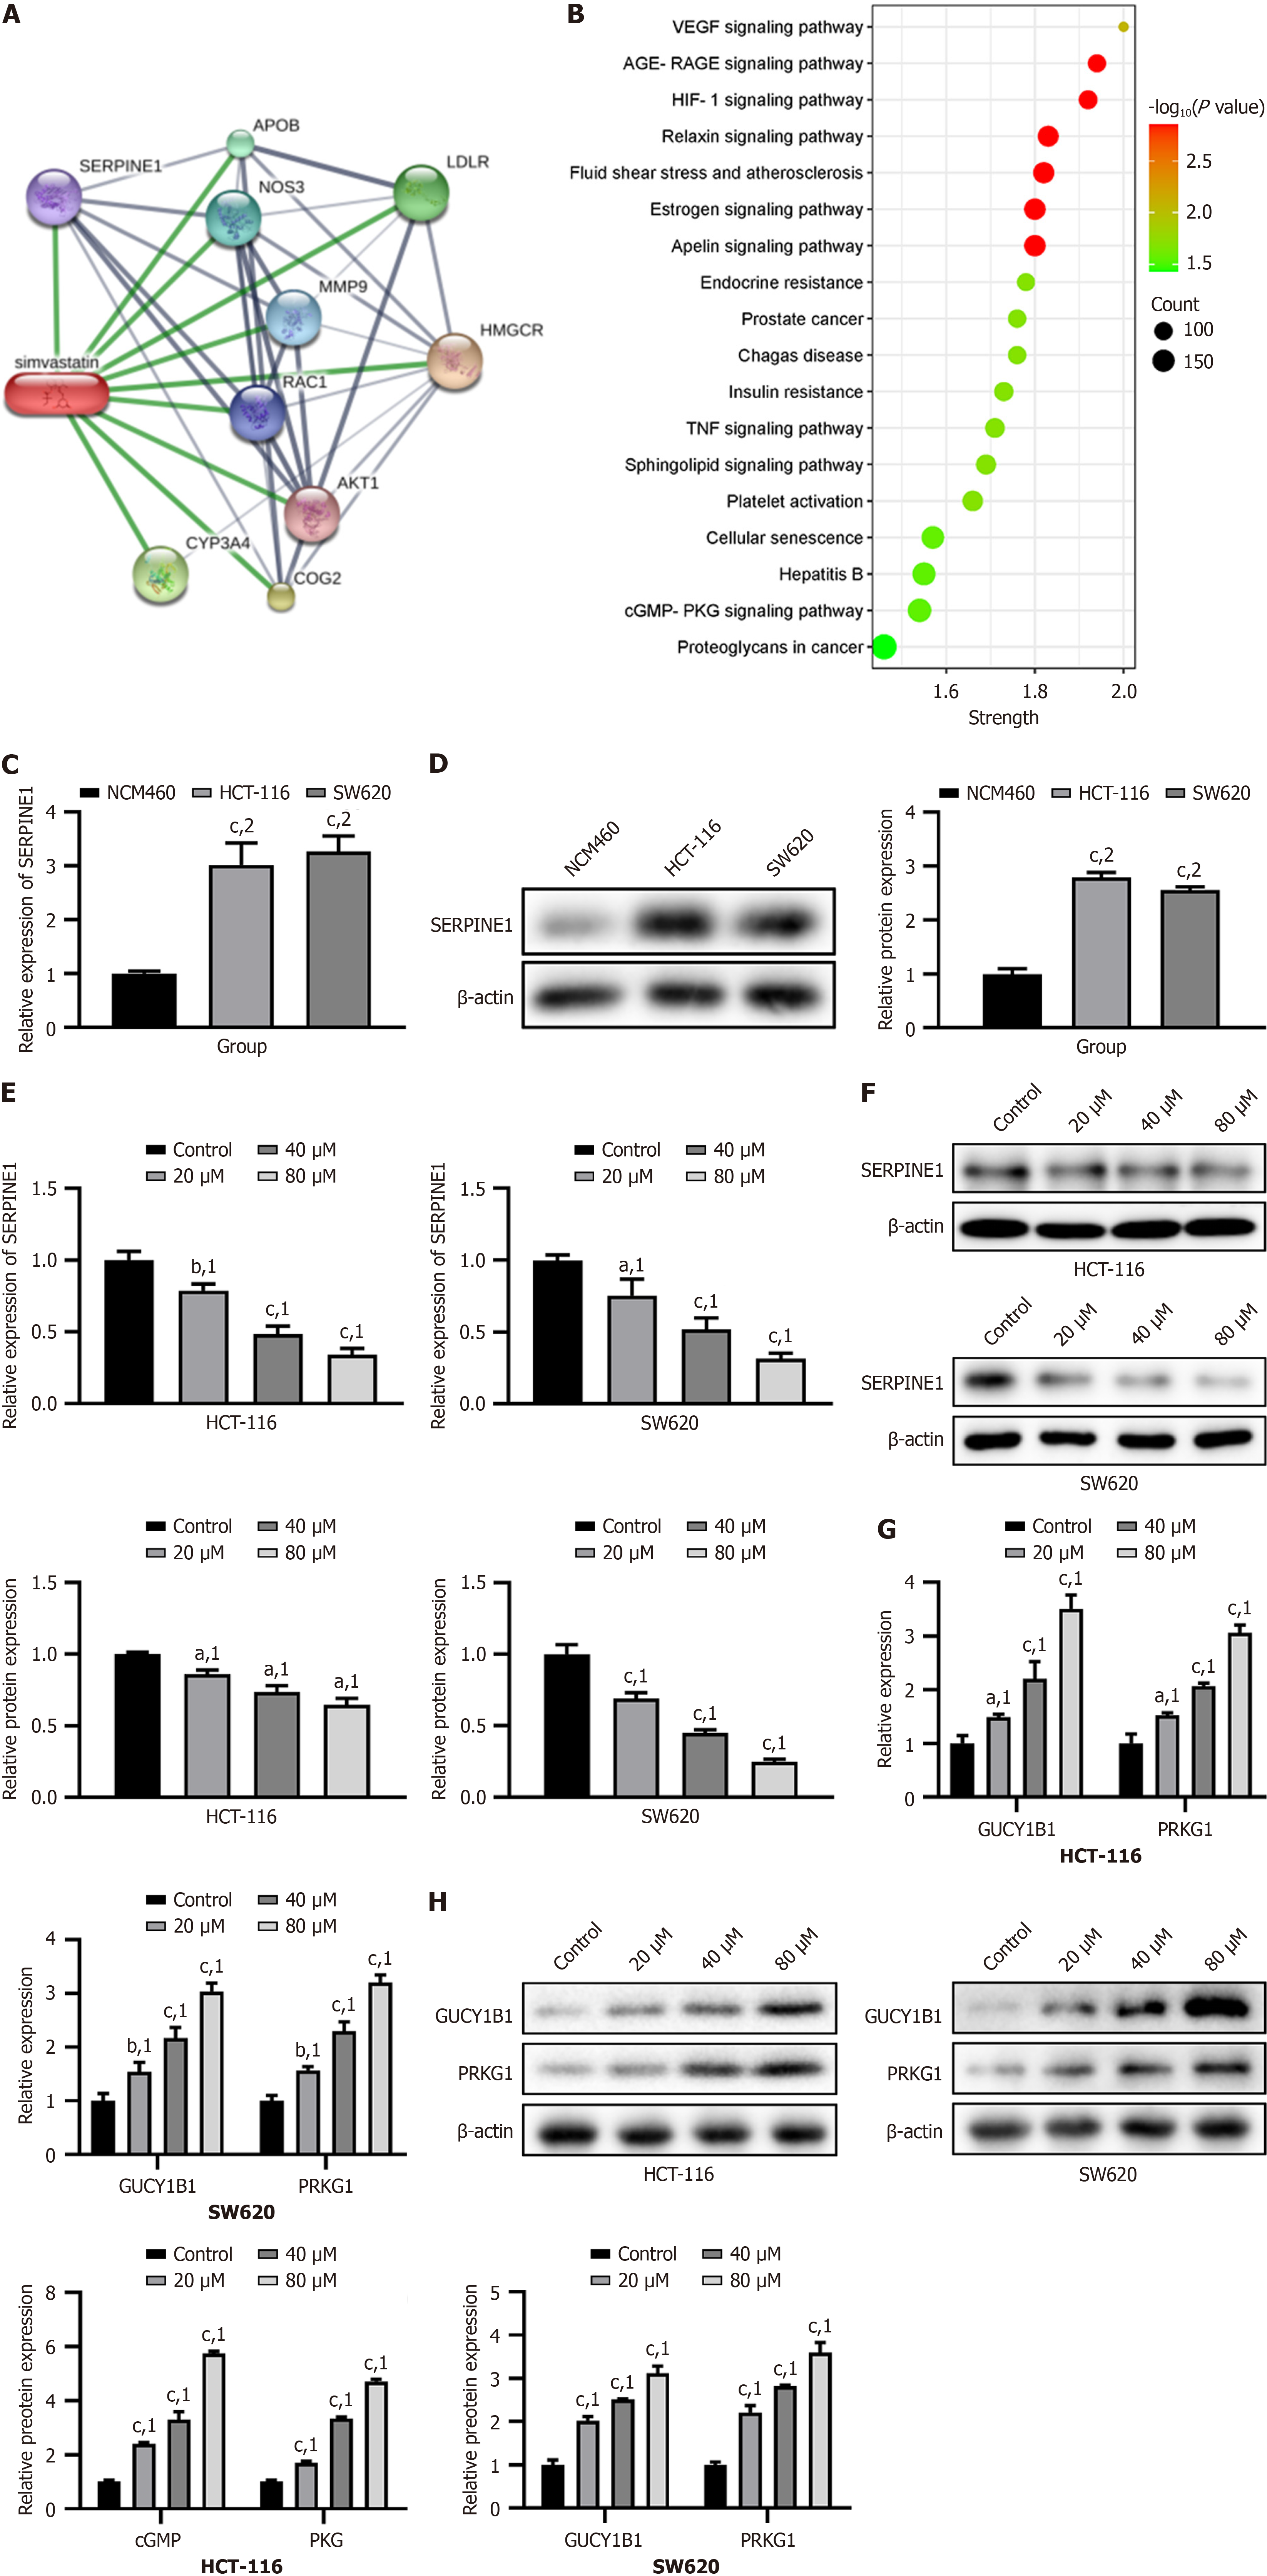
Figure 3 Simvastatin modulates SERPINE1 and activates the cyclic guanosine monophosphate-protein kinase G signaling pathway in HCT-116 and SW620 cells.
A: Protein-protein interaction network analysis of simvastatin; B: Kyoto Encyclopedia of Genes and Genomes pathway enrichment of SERPINE1; C and D: The expression of SERPINE1 analyzed by real time polymerase chain reaction (PCR) and Western blot in NCM460, HCT-116 and SW620 cells; E and F: The expression of SERPINE1 analyzed by real time PCR and Western blot in simvastatin-treated HCT-116 and SW620 cells; G and H: The expression of GUCY1B1 and PRKG1 analyzed by real time PCR and Western blot in simvastatin-treated HCT-116 and SW620 cells. aP < 0.05. bP < 0.01. cP < 0.001. 1P vs control group. 2P vs NCM460 group. VEGF: Vascular endothelial growth factor; AGE-RAGE: Advanced glycation end products-receptor for advanced glycation end products; HIF-1: Hypoxia inducible factor-1; TNF: Tumor necrosis factor; cGMP-PKG: Cyclic guanosine monophosphate-protein kinase G.
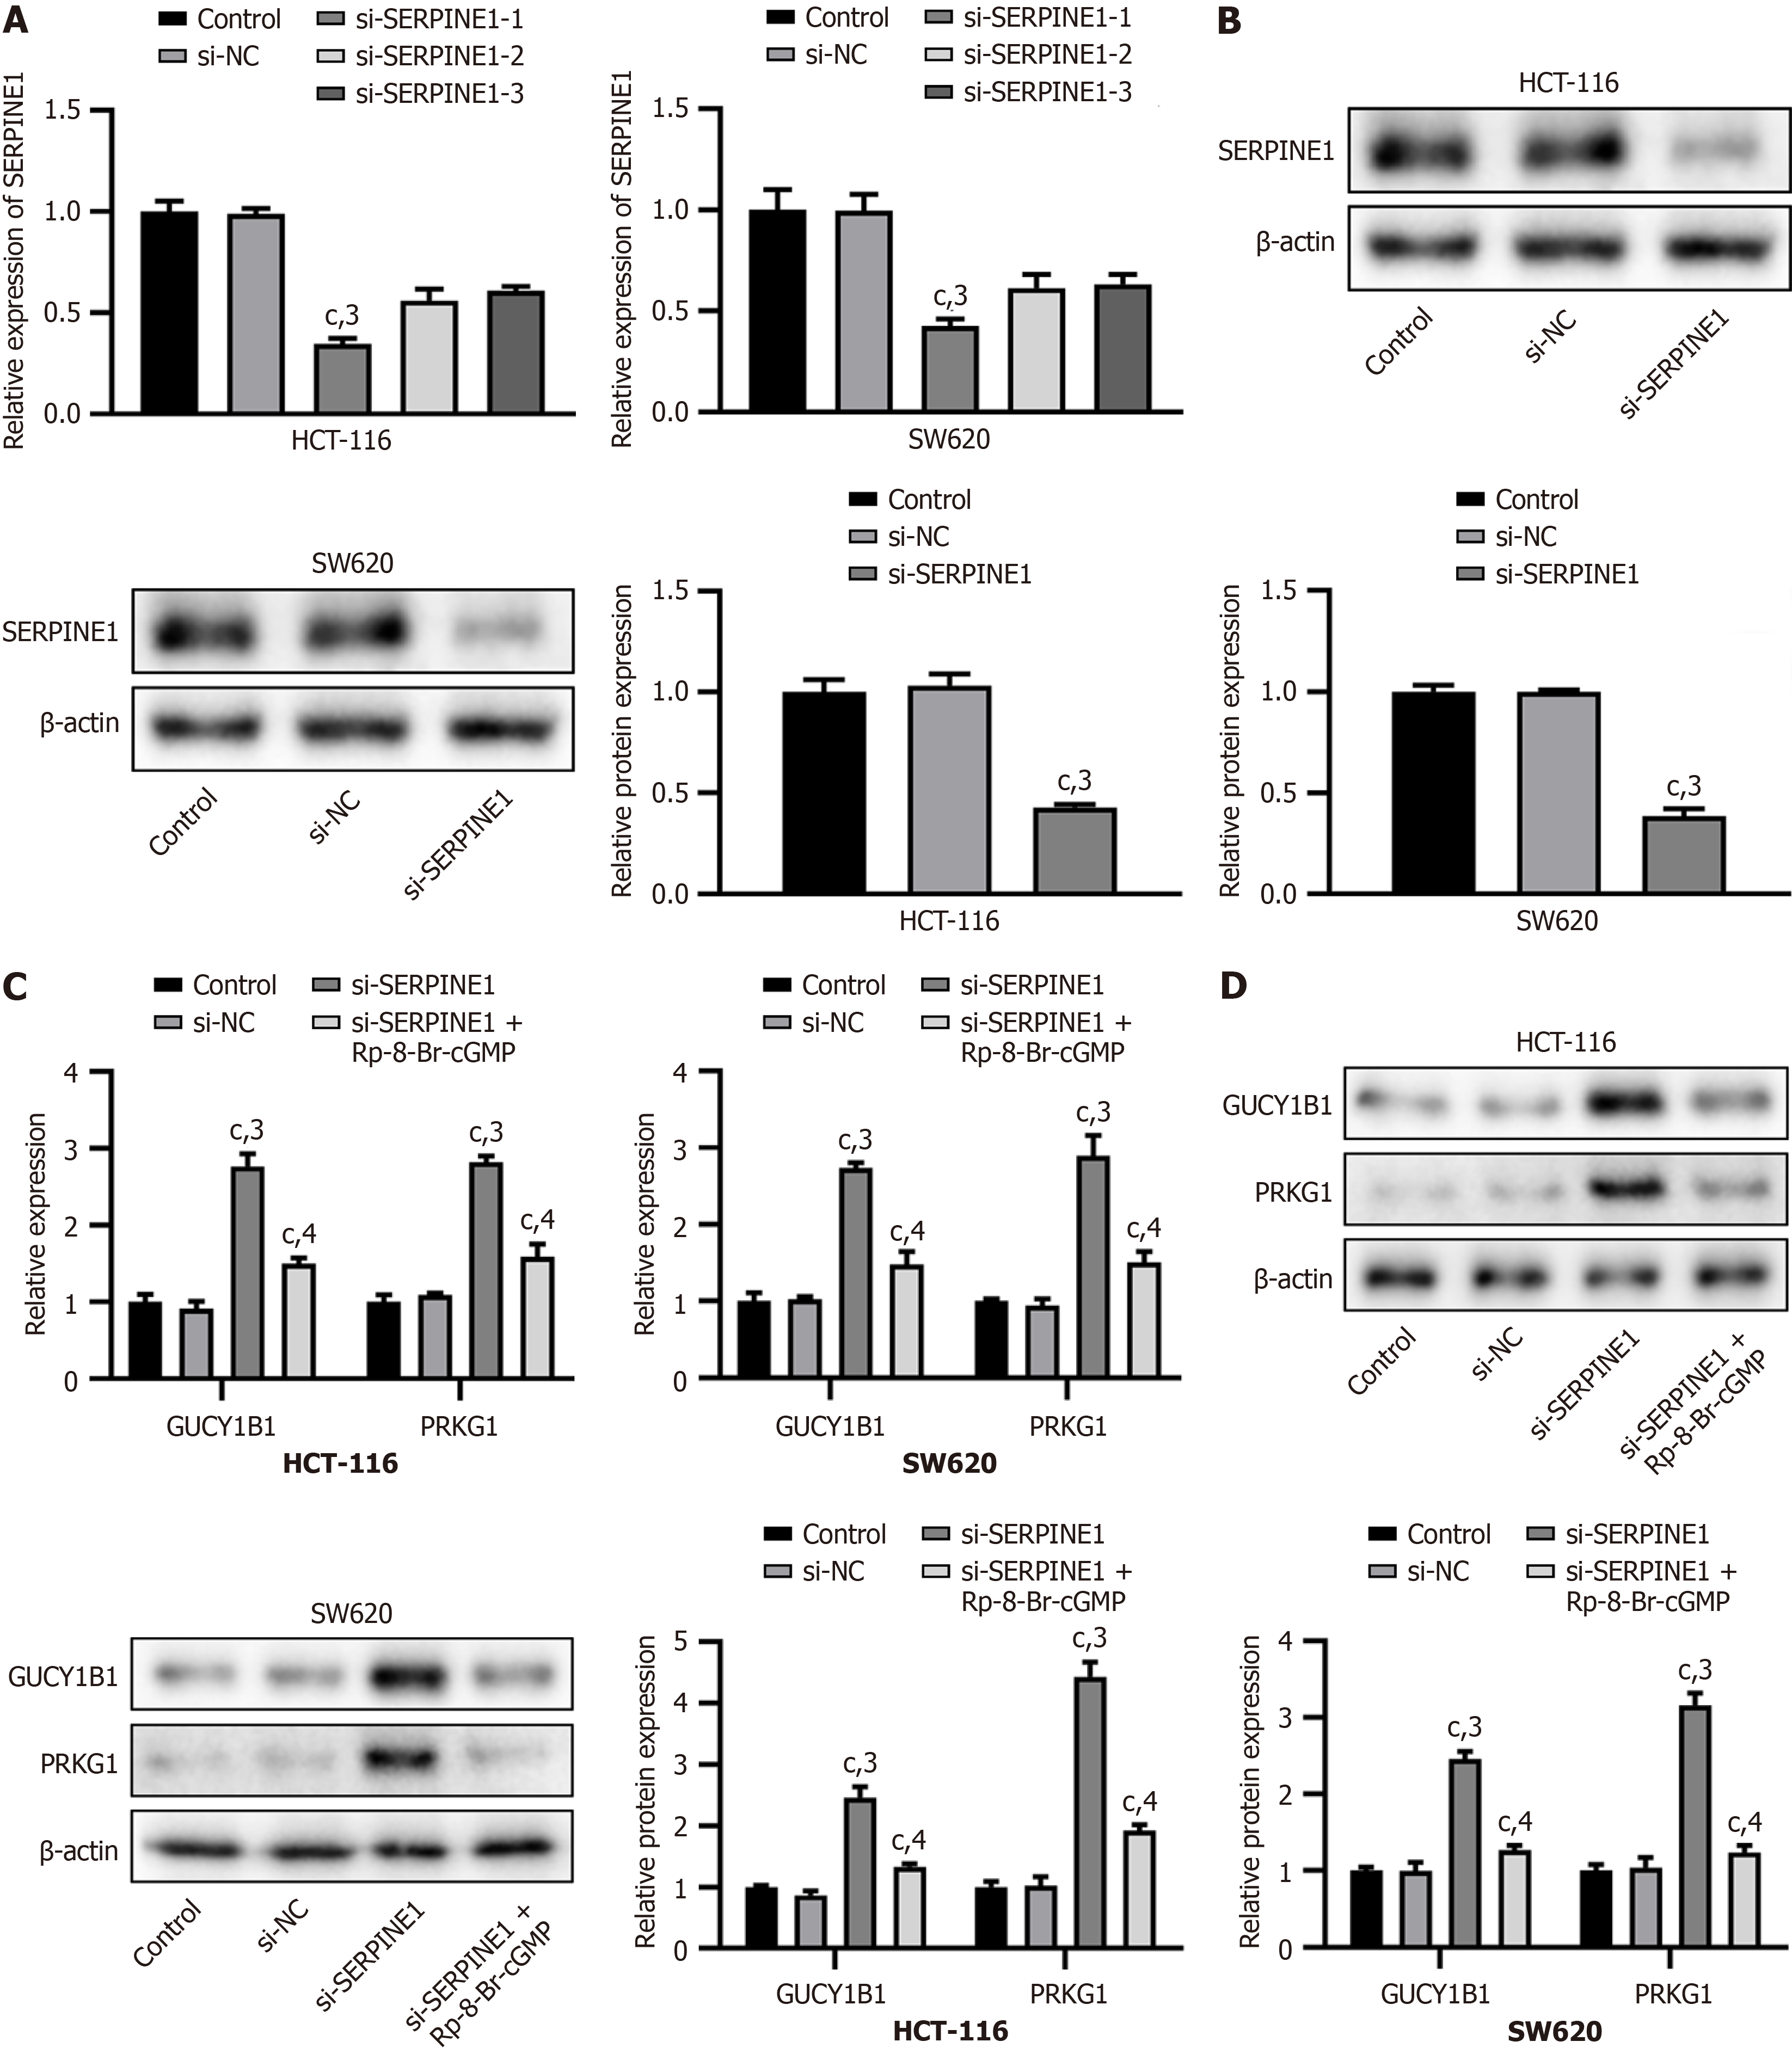
Figure 4 Knockdown of SERPINE1 activates the cyclic guanosine monophosphate-protein kinase G signaling pathway in HCT-116 and SW620 cells.
A and B: The transfection efficiency of single-cell RNA sequencing reveals SERPINE1 by real time polymerase chain reaction (PCR) and Western blot; C and D: The expression of GUCY1B1 and PRKG1 analyzed by real time PCR and Western blot. cP < 0.001. 3P vs single-cell RNA sequencing reveals-negative control group. 4P vs single-cell RNA sequencing reveals SERPINE1 group. si-NC: Single-cell RNA sequencing reveals-negative control; si-SERPINE1: Single-cell RNA sequencing reveals SERPINE1; cGMP: Cyclic guanosine monophosphate-protein.
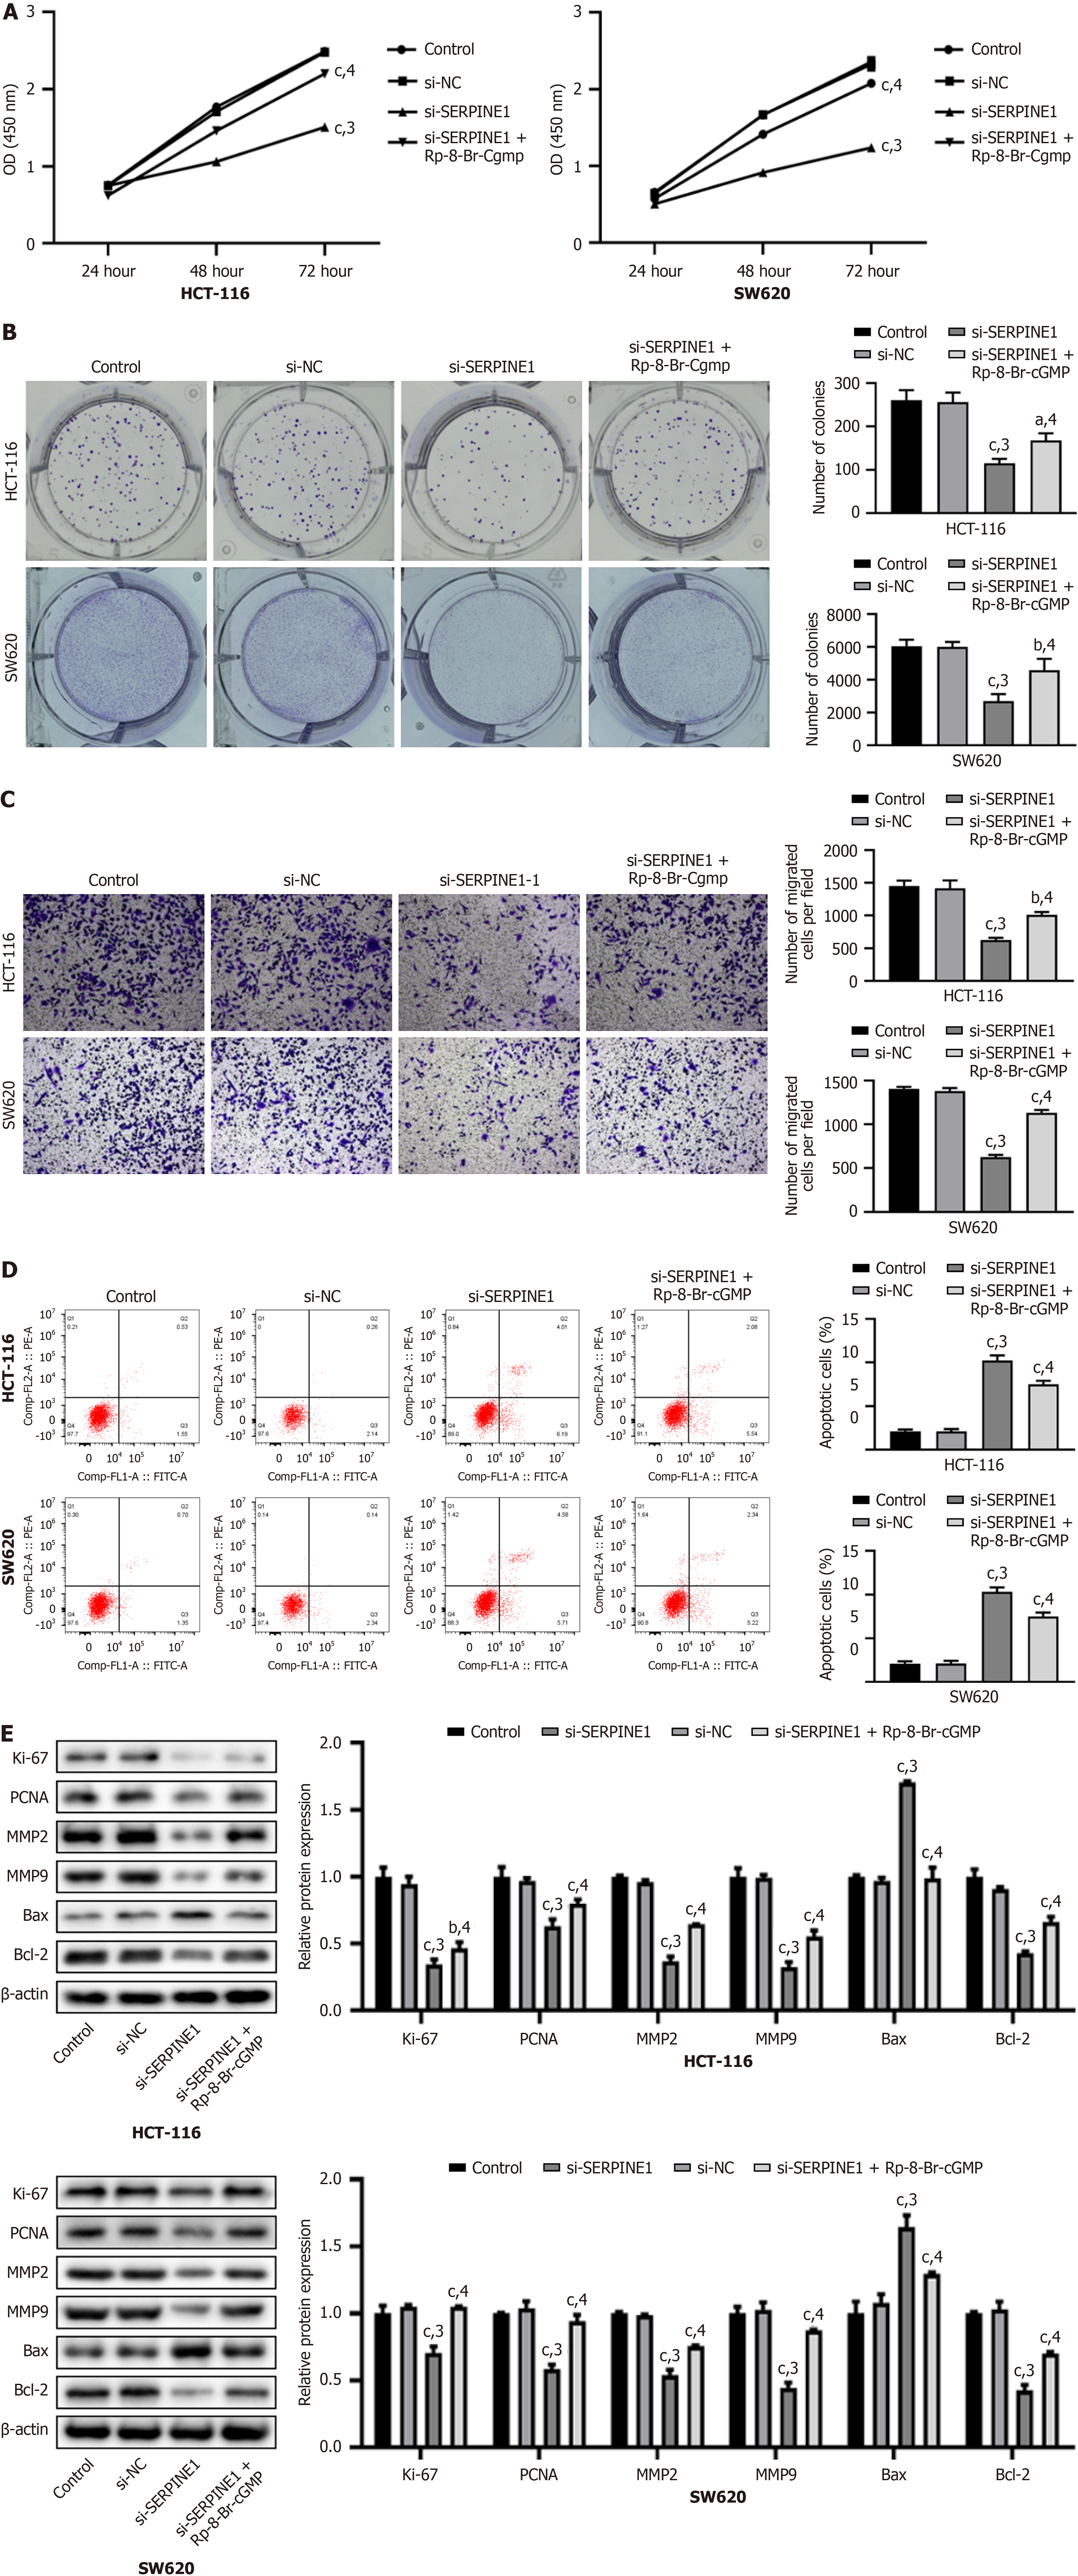
Figure 5 Knockdown of SERPINE1 inhibits cell viability and proliferation, reduces migration, and promotes apoptosis via the cyclic guanosine monophosphate-protein kinase G pathway in HCT-116 and SW620 cells.
A: Cell viability detected by cell counting kit-8 assay; B: Cell proliferation detected by colony formation assays; C: Cell migration measured by Transwell assay; D: Cell apoptosis detected by flow cytometry; E: The expression of Ki-67, proliferating cell nuclear antigen, MMP2, MMP9, Bcl-2 and Bax analyzed by Western blot. bP < 0.01. cP < 0.001. 3P vs single-cell RNA sequencing reveals-negative control group. 4P vs single-cell RNA sequencing reveals SERPINE1 group. OD: Optical density; si-NC: Single-cell RNA sequencing reveals-negative control; si-SERPINE1: Single-cell RNA sequencing reveals SERPINE1; cGMP: Cyclic guanosine monophosphate-protein; PCNA: Proliferating cell nuclear antigen.
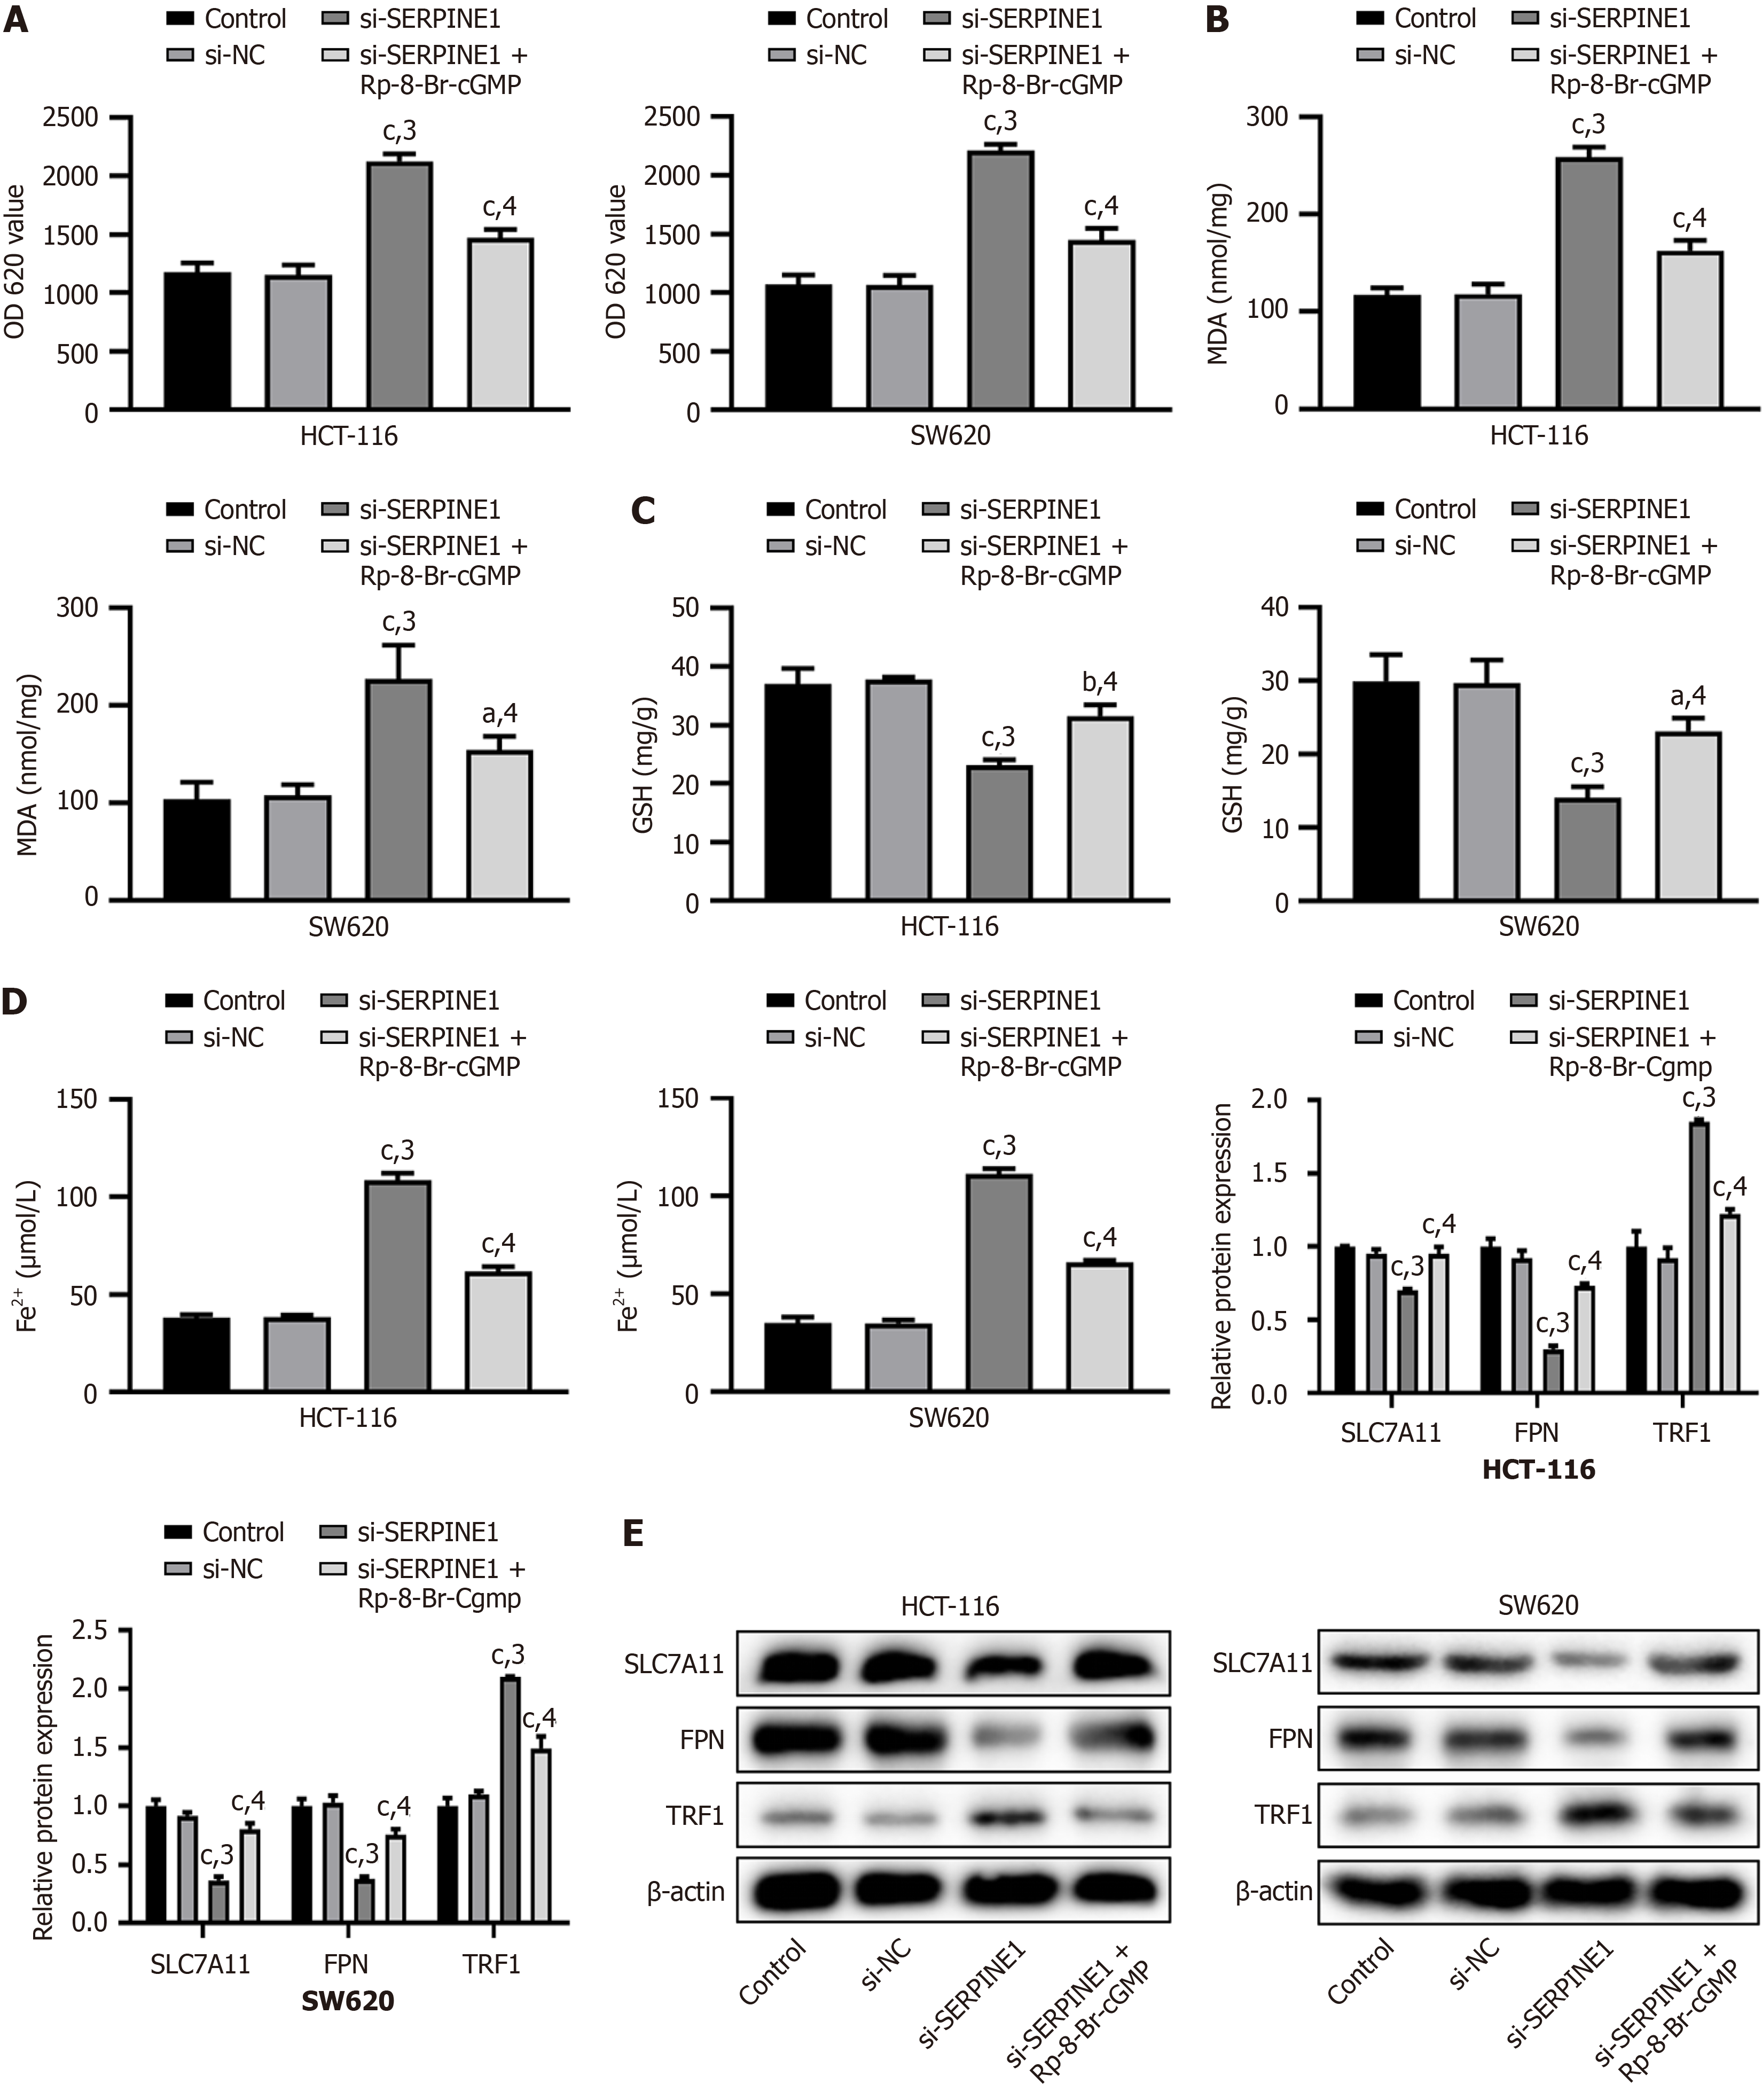
Figure 6 Knockdown of SERPINE1 induces oxidative stress and ferroptosis via the cyclic guanosine monophosphate-protein kinase G pathway in HCT-116 and SW620 cells.
A: Reactive oxygen species content in cells; B: Malondialdehyde content in cells; C: Glutathione content in cells; D: Ferrous ion levels in cells; E: The expression of SLC7A11, ferroportin and TRF1 analyzed by Western blot. aP < 0.05. bP < 0.01. cP < 0.001. 3P vs single-cell RNA sequencing reveals-negative control group. 4P vs single-cell RNA sequencing reveals SERPINE1 group. OD: Optical density; si-NC: Single-cell RNA sequencing reveals-negative control; si-SERPINE1: Single-cell RNA sequencing reveals SERPINE1; cGMP: Cyclic guanosine monophosphate-protein; FPN: Ferroportin; MDA: Malondialdehyde; GSH: Glutathione; Fe2+: Ferrous ion.
- Citation: Liu Y, Ge H, Fan ZM, Lu T, He L, Li M, Zhao HR, Leng Q. Simvastatin inhibits proliferation and migration, promotes oxidative stress and ferroptosis in colon cancer. World J Gastrointest Oncol 2025; 17(5): 104522
- URL: https://www.wjgnet.com/1948-5204/full/v17/i5/104522.htm
- DOI: https://dx.doi.org/10.4251/wjgo.v17.i5.104522


