Copyright
©The Author(s) 2025.
World J Gastrointest Oncol. May 15, 2025; 17(5): 104522
Published online May 15, 2025. doi: 10.4251/wjgo.v17.i5.104522
Published online May 15, 2025. doi: 10.4251/wjgo.v17.i5.104522
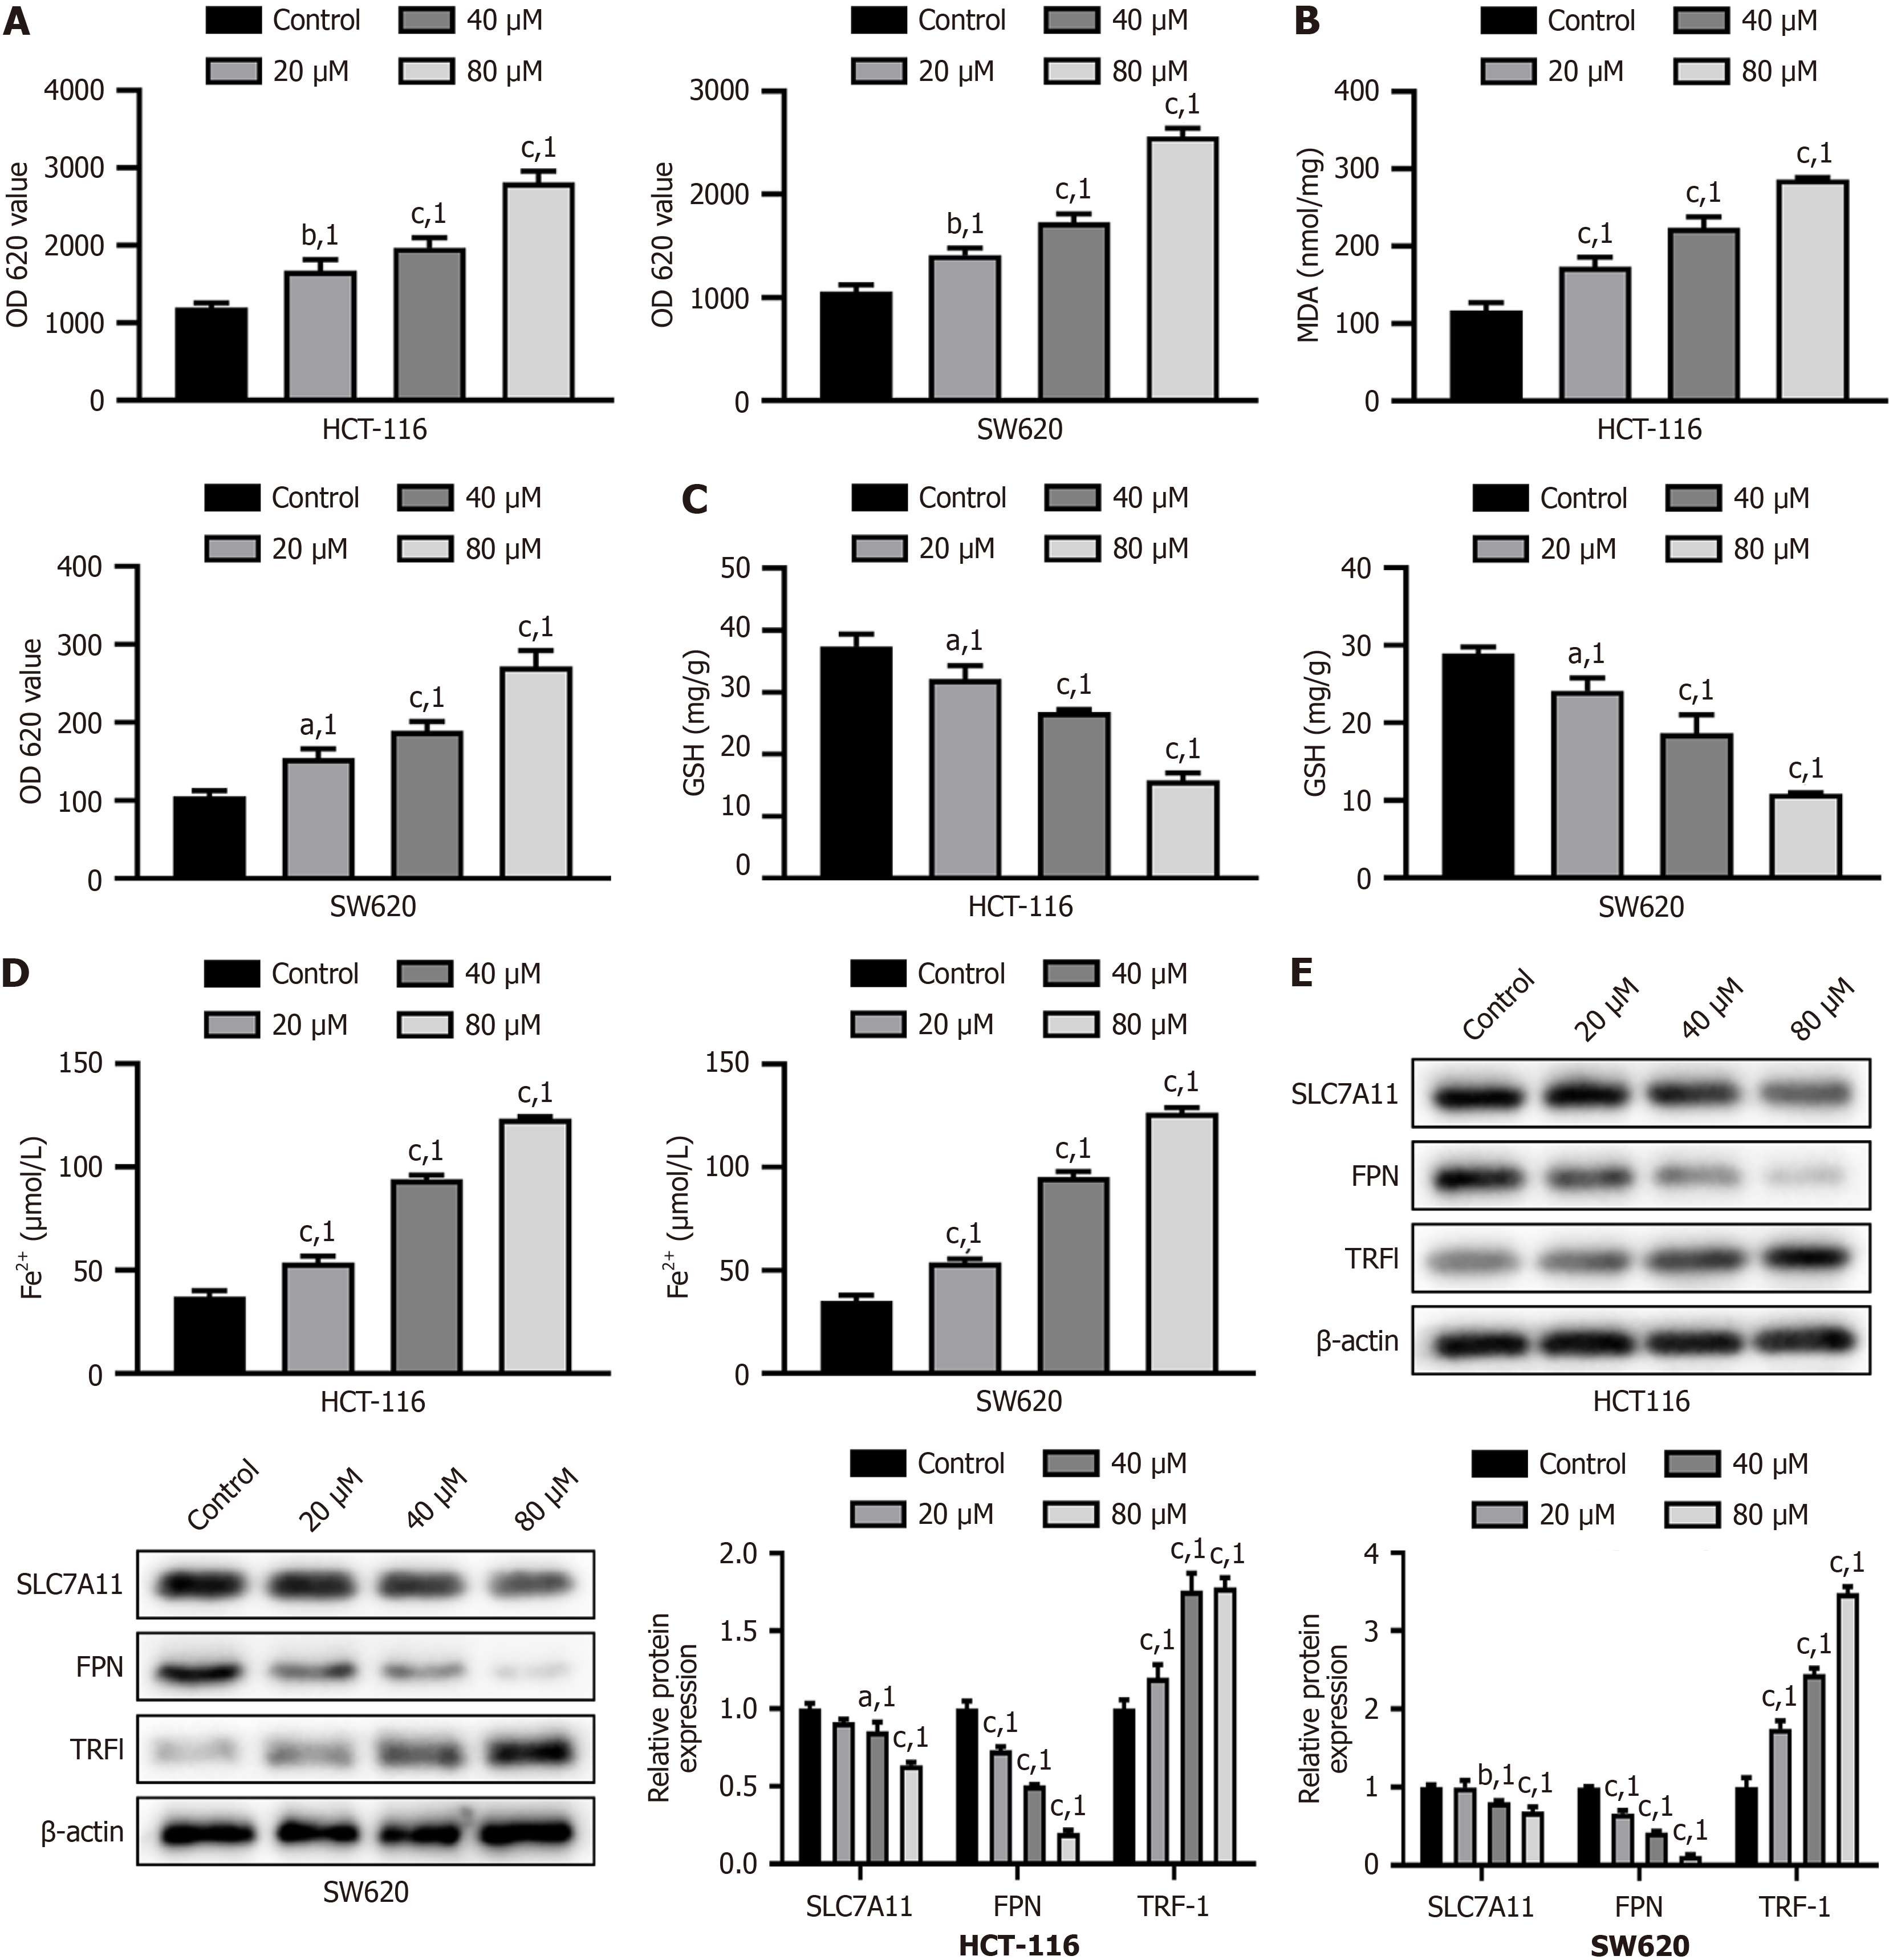
Figure 2 Simvastatin-induced oxidative stress and ferroptosis in HCT-116 and SW620 cells.
A: Reactive oxygen species content in cells; B: Malondialdehyde content in cells; C: Glutathione content in cells; D: Ferrous ion levels in cells; E: The expression of SLC7A11, ferroportin and TRF1 analyzed by Western blot. aP < 0.05. bP < 0.01. cP < 0.001. 1P vs control group. OD: Optical density; FPN: Ferroportin; MDA: Malondialdehyde; GSH: Glutathione; Fe2+: Ferrous ion.
- Citation: Liu Y, Ge H, Fan ZM, Lu T, He L, Li M, Zhao HR, Leng Q. Simvastatin inhibits proliferation and migration, promotes oxidative stress and ferroptosis in colon cancer. World J Gastrointest Oncol 2025; 17(5): 104522
- URL: https://www.wjgnet.com/1948-5204/full/v17/i5/104522.htm
- DOI: https://dx.doi.org/10.4251/wjgo.v17.i5.104522


