Published online Jul 7, 2015. doi: 10.3748/wjg.v21.i25.7777
Peer-review started: January 6, 2015
First decision: January 22, 2015
Revised: February 14, 2015
Accepted: March 31, 2015
Article in press: March 31, 2015
Published online: July 7, 2015
Processing time: 183 Days and 18.3 Hours
AIM: To investigate the molecular mechanisms of berberine inhibition of hepatic gluconeogenesis in a diabetic rat model.
METHODS: The 40 rats were randomly divided into five groups. One group was selected as the normal group. In the remaining groups (n = 8 each), the rats were fed on a high-fat diet for 1 mo and received intravenous injection of streptozotocin for induction of the diabetic models. Berberine (156 mg/kg per day) (berberine group) or metformin (184 mg/kg per day) (metformin group) was intragastrically administered to the diabetic rats and 5-aminoimidazole-4-carboxamide1-β-D-ribofuranoside (AICAR) (0.5 mg/kg per day) (AICAR group) was subcutaneously injected to the diabetic rats for 12 wk. The remaining eight diabetic rats served as the model group. Fasting plasma glucose and insulin levels as well as lipid profile were tested. The expressions of proteins were examined by western blotting. The nuclear translocation of CREB-regulated transcription co-activator (TORC)2 was observed by immunohistochemical staining.
RESULTS: Berberine improved impaired glucose tolerance and decreased plasma hyperlipidemia. Moreover, berberine decreased fasting plasma insulin and homeostasis model assessment of insulin resistance (HOMA-IR). Berberine upregulated protein expression of liver kinase (LK)B1, AMP-activated protein kinase (AMPK) and phosphorylated AMPK (p-AMPK). The level of phophorylated TORC2 (p-TORC2) protein in the cytoplasm was higher in the berberine group than in the model group, and no significant difference in total TORC2 protein level was observed. Immunohistochemical staining revealed that more TORC2 was localized in the cytoplasm of the berberine group than in the model group. Moreover, berberine treatment downregulated protein expression of the key gluconeogenic enzymes (phosphoenolpyruvate carboxykinase and glucose-6-phosphatase) in the liver tissues.
CONCLUSION: Our findings revealed that berberine inhibited hepatic gluconeogenesis via the regulation of the LKB1-AMPK-TORC2 signaling pathway.
Core tip: We showed that liver kinase (LK)B1 acts as the upstream regulator of AMP-activated protein kinase (AMPK) and participates in gluconeogenesis. AMPK phosphorylation triggers CREB-regulated transcription co-activator (TORC)2 phosphorylation, which results in the inhibition of the nuclear translocation of TORC2. Thus, gluconeogenesis is restrained. No previous studies have reported the molecular mechanisms of berberine reducing hyperglycemia via the inhibition of hepatic gluconeogenesis. We found that berberine upregulated protein expression of LKB1, AMPK, p-AMPK and p-TORC2. Moreover, we observed that berberine inhibited the translocation of TOCR2 into the cell nucleus.
-
Citation: Jiang SJ, Dong H, Li JB, Xu LJ, Zou X, Wang KF, Lu FE, Yi P. Berberine inhibits hepatic gluconeogenesis
via the LKB1-AMPK-TORC2 signaling pathway in streptozotocin-induced diabetic rats. World J Gastroenterol 2015; 21(25): 7777-7785 - URL: https://www.wjgnet.com/1007-9327/full/v21/i25/7777.htm
- DOI: https://dx.doi.org/10.3748/wjg.v21.i25.7777
The liver plays a crucial role in the maintenance of systemic glucose homeostasis. In the absorptive state, the liver increases glucose uptake via the absorption of glucose by hepatocytes and subsequent transformation into glycogen and lipids. In the fasting state, hepatocytes provide glucose via glycogenolysis and gluconeogenesis to maintain glucose homeostasis. However, abnormal hepatic gluconeogenesis results in the elevation of glucose levels. Gluconeogenesis in the liver is regulated through the transcriptional modulation of gluconeogenic enzymes such as glucose-6-phosphatase (G-6-Pase) and phosphoenolpyruvate carboxykinase (PEPCK)[1].
AMP-activated protein kinase (AMPK) plays a vital role in gluconeogenesis in the liver. AMPK is a conserved sensor and regulator of cellar energy balance that is activated when the cellular AMP: ATP ratio exhibits a large increase due to conditions of nutrient deprivation or pathological stress[2]. Liver kinase (LK)B1 is a serine/threonine protein kinase that was originally identified as a tumor suppressor gene. The LKB1 mutation is responsible for the familiar Peutz-Jeghers syndrome[3]. The deletion of hepatic LKB1 in adult mice results in the nearly complete loss of AMPK activity, which in turn, results in hyperglycemia due to increased gluconeogenic gene expression[4]. Previous research has indicated that LKB1 acts as the upstream regulator of AMPK and participates in gluconeogenesis. Koo et al[5] illustrated that CREB-regulated transcription co-activator (TORC)2 is a key regulator of glucose output that acts through the cAMP responsive element binding protein (CREB) and found that TORC2-deficient mice exhibit fasting hypoglycemia. Subsequently, CREB stimulates hepatic gluconeogenesis to drive the expression of the nuclear receptor coactivator peroxisome proliferator-activated receptor co-activator (PGC)-1α[4,5]. PGC-1α is a transcriptional coactivator of nuclear receptors and plays a vital role in activating the expression of the genes for key gluconeogenic enzymes such as PEPCK and G-6-P[6,7]. The research of Koo et al[5] showed that AMPK phosphorylation due to ATP depletion triggers TORC2 phosphorylation, which results in the inhibition of the nuclear translocation of TORC2; in turn, the cytoplasmic localization of TORC2 prevents its combination with CREB elements. Thus, gluconeogenesis is restrained. In the future, the LKB1-AMPK-TORC2 signaling pathway will probably be a target for the treatment of type 2 diabetes.
Berberine is an isoquinoline alkaloid extracted from Rhizoma Coptidis. The hypoglycemic effect of berberine was first identified in 1988 via the treatment of diarrhea in diabetic patients[8]. Since that time, many studies about the influence of berberine on hyperglycemia-reducing and insulin resistance-improving have been reported. Recently, berberine was proven to be capable of reducing hyperglycemia via the inhibition of hepatic gluconeogenesis[1,9,10]. Based on the inhibition of gluconeogenesis by the LKB1-AMPK-TORC2 signaling pathway, we hypothesized that berberine reduces hyperglycemia via the LKB1-AMPK-TORC2 signaling pathway to control gluconeogenesis.
Male Wistar rats, weighing 160 g, supplied by the Centers for Disease Control and Prevention (Wuhan, China) were fed adaptively for 1 wk in an ambient temperature of 22 ± 1 °C and on a 12-h light/dark cycle with free access to water and the standard rat diet (containing 35% flour, 20% soy meal, 20% corn meal, 15.5% bran, 0.5% bean oil, 5% fish meal, 2.5% bone meal, 1% dusty yeast, and 0.5% salt). All experimental procedures were performed in accordance with the guide principle for experimental animals (MSTPRC Directive of 1988, No. 88-2).
Streptozotocin (STZ) was produce by Sigma (St Louis, MO, United States). The assay kits used for blood lipid determinations were purchased from Jiancheng Bio-engineering Institute (Nanjing, China). Berberine was provided by the National Institute for the Control of Pharmaceutical and Biological Products (Beijing, China). Metformin was purchased from Shenzhen Vanda Pharmaceuticals (Shenzhen, China), and AICAR was procured from the Beyotime Institute of Biotechnology (Jiangsu, China).
The rats were randomly assigned to a normal control group that received the standard rat diet (normal) or the remaining four groups that received a high-fat diet (containing 67.5% standard laboratory rat chow, 15% lard, 15% sugar, 2% cholesterol, and 0.5% bile salts) for 4 wk. Next, the rats received tail vein injections of STZ (30 mg/kg) dissolved in 0.05mol/L sodium citrate (pH 4.5) after 12-h fast for induction of the diabetic models[11]. One week later, oral glucose tolerance test (OGTT) was performed. The 95% confidence intervals were calculated based on the plasma glucose levels of normal rats. The rats with diabetes (i.e., rats with plasma glucose levels that were above the normal upper limit at two time points or 20% greater than the normal upper limit at one time point) were selected. Next, the diabetic rats were randomized into the following four groups (n = 8 per group): an untreated diabetic group (model), a berberine-treated group (berberine), a metformin-treated group (metformin) and an AICAR-treated group (AICAR). Berberine (156 mg/kg per day) and metformin (184 mg/kg per day) were dissolved in sodium carboxymethylcellulose and intragastrically administered to the rats daily for 12 wk. AICAR (0.5 mg/kg per day) was dissolved in normal saline, and the rats in the AICAR-treated group were given daily subcutaneous injections of AICAR for 12 wk. The doses were adjusted according to the body weight, which was recorded once per week. The day before the rats were sacrificed, the rats were anesthetized with diethyl ether after fasting for 12 h, and orbital venous blood was obtained. Next, the rats were given glucose by gavage (2 g/kg), and additional blood samples were collected at regular intervals (t = 60 and 120 min) for glucose and insulin measurements. The rats were deeply anesthetized with pentobarbital in the fasting (12-h) condition. Blood samples were collected from the abdominal aorta and allowed to clot for 30 min at 4 °C. After centrifuging at 3000 r/min for 15 min at 4 °C, the serum was separated and stored at -80 °C until examination. The liver was removed and flushed with saline. Next the liver was collected and stored at -80 °C until use.
Blood glucose levels were examined with the glucose oxidase method using a glucose monitor (LifeScan Milpitas, CA, United States). Serum fasting insulin concentrations were measured with radioimmunoassay.
The serum total cholesterol (TC), triglycerides (TG), low-density lipoprotein cholesterol (LDL-C) and high-density lipoprotein cholesterol (HDL-C) concentrations were estimated via the oxidase method using commercial reagents.
Liver total protein was extracted, and the concentrations of total protein were measured by the BCA method. The liver extractions (100 μg) were mixed with sample buffer (25 μg), boiled for 10 min, and separated on 10% SDS-PAGE. The separated proteins were electrophoretically transferred to nitrocellulose membranes. The membranes were blocked with 5% nonfat dry milk dissolved in phosphate-buffered saline with Tween-20 (PBST) or 0.5% bovine serum albumin for 2 h at room temperature. The membranes were then washed in PBST and incubated overnight with primary antibodies (LKB1, AMPK, p-AMPK, TORC2, p-TORC2, G-6-P, PEPCK, and β-actin) at 4 °C. After three washes in PBST, the membranes were incubated with the Dylight 800-labeled antibody to rabbit IgG (KPL, Hongkong, China) for 2 h. Immunoreactive proteins were visualized with a near-infrared double color laser imaging system (Odyssey, Lincoln, NE, United States). Quantity one 4.6.2 was used for assaying the protein quantification.
The liver tissues were fixed with 4% paraformaldehyde for paraffin embedding. The paraffin-embedded sections were subjected to immunohistochemical staining for TORC2 in the liver. The tissue sections were incubated with rabbit anti-TORC2 primary antibody (1:50). After washing with PBST, the sections were incubated with secondary antibody, and the diaminobenzidine method was used. Next, the TORC2 protein expressions were observed under an optical microscope.
The data are presented as the means ± SD and were assayed with SPSS version 19.0 statistical software. All experience data were analyzed with one-way analysis of variance (ANOVA). Data with equal variances were evaluated with Tukey’s test. A P value below 0.05 was considered significant. The statistical methods of the study were reviewed by Sheng Wei from the school of Public Health of Tongji Medical College.
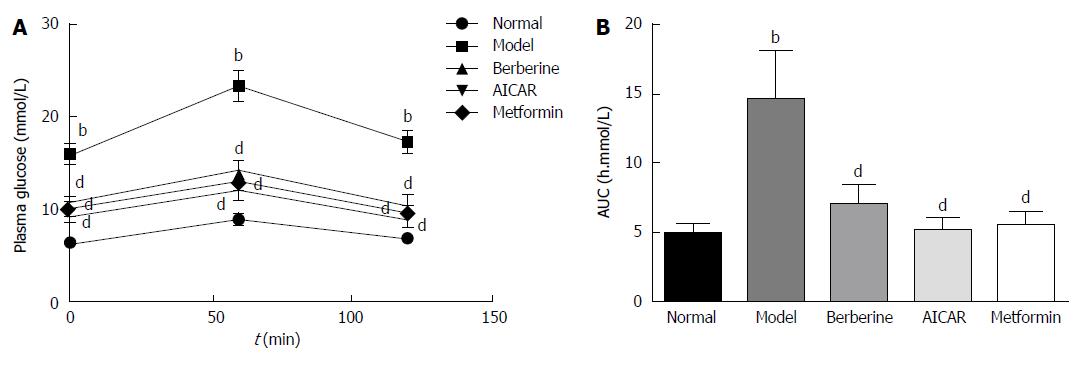
As shown in Figure 1A, the plasma glucose levels in the model group were significantly higher than those in the normal control group at 0, 1 and 2 h (P < 0.01). Glucose tolerances were improved in the berberine, AICAR and metformin groups compared to the model group (P < 0.01). In the berberine, AICAR and metformin groups, the areas under the curves (AUCs) constructed from the plasma glucose levels at the three time points were decreased by 52%, 64% and 62%, respectively, compared to the model group (Figure 1B).
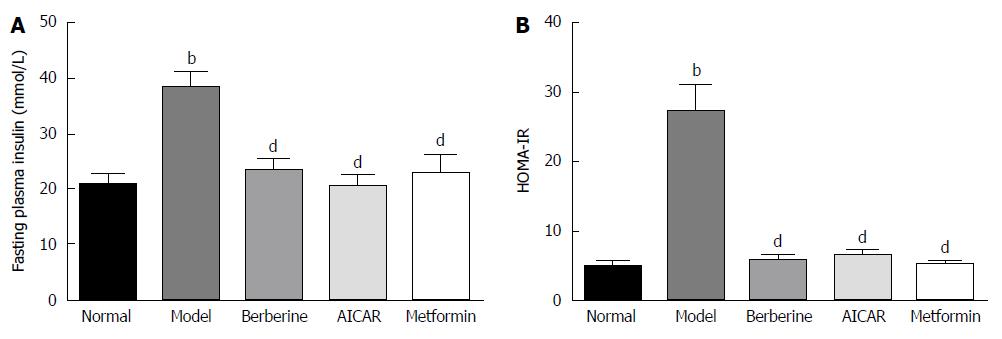
Blood insulin was monitored to assay pancreatic beta cell function. As shown in Figure 2, fasting insulin level was significantly higher in the model group than in the normal control group (P < 0.01), and berberine significantly lowered fasting insulin level compared to the model group (P < 0.01) (Figure 2A). Moreover, the fasting plasma insulin and homeostasis model assessment of insulin resistance (HOMA-IR) in the model group was higher than in the normal control group (P < 0.01), and berberine notably decreased HOMA-IR compared to the model group (P < 0.01) (Figure 2B).
As shown in Table 1, the model rats exhibited severe dyslipidemia. The serum TG, TC, and LDL-C levels were higher in the model group than in the normal control group (P < 0.01). Treatments with berberine, AICAR and metformin markedly ameliorated the increases in the TG, TC and LDL-C levels in the diabetic rats compared to the model rats (P < 0.01). The HDL-C levels of the model group were lower than those of the normal control group, and the HDL-C levels of the treatment groups were increased compared to those of the model rats (P < 0.01).
| Group | TG (mmol/L) | TC (mmol/L) | LDL-C (mmol/L) | HDL-C (mmol/L) |
| Normal | 0.98 ± 0.15 | 3.74 ± 0.56 | 1.48 ± 0.18 | 2.68 ± 0.48 |
| Model | 2.7 ± 0.57b | 6.66 ± 1.14b | 4.26 ± 0.63b | 1.14 ± 0.15b |
| Berberine | 1.44 ± 0.23d | 4.88 ± 0.96d | 1.46 ± 0.32d | 2.12 ± 0.63d |
| AICAR | 1.28 ± 0.31d | 4.54 ± 0.55d | 1.82 ± 0.22d | 2.34 ± 0.40d |
| Metformin | 1.26 ± 0.37d | 4.72 ± 0.56d | 1.60 ± 0.27d | 2.52 ± 0.59d |
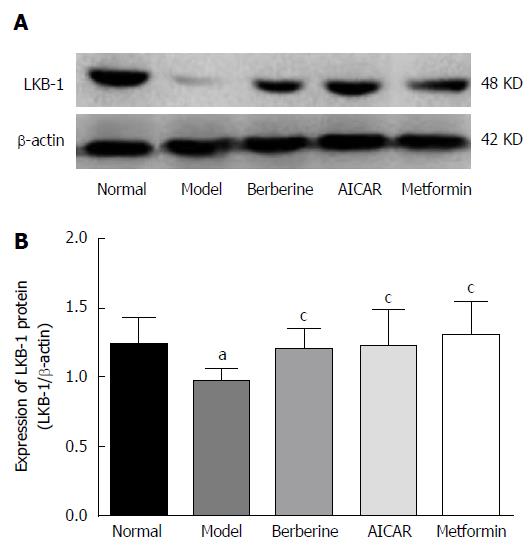
As shown in Figure 3, the expression of LKB1 protein in the model rats decreased compared to the normal control group (P < 0.05). However, treatments of berberine, AICAR and metformin increased the expression of LKB1 protein compared to the model rats (P < 0.05).
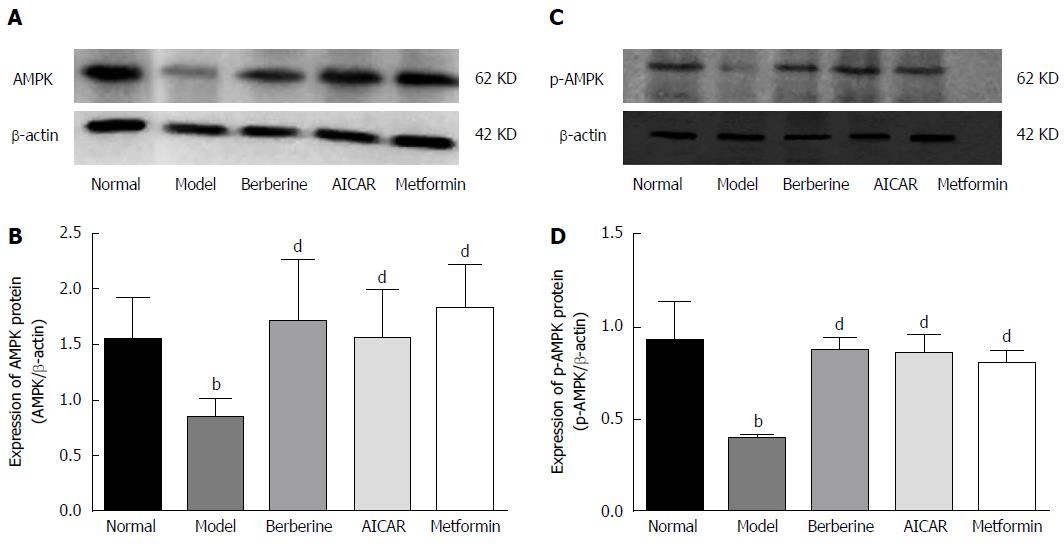
AMPK is an energy sensor, and phosphorylation of AMPK is increased when it is activated. As shown in Figure 4, the liver AMPK and P-AMPK protein levels were lower in the model group than in the normal control group, and berberine, AICAR and metformin treatments considerably increased the expressions of AMPK and P-AMPK proteins compared to the model rats (P < 0.01).
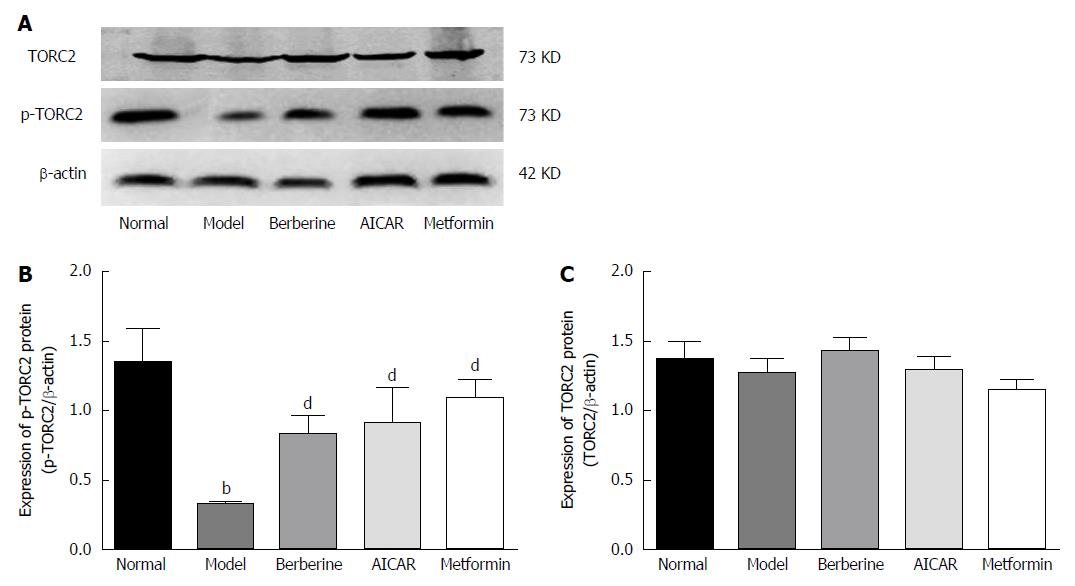
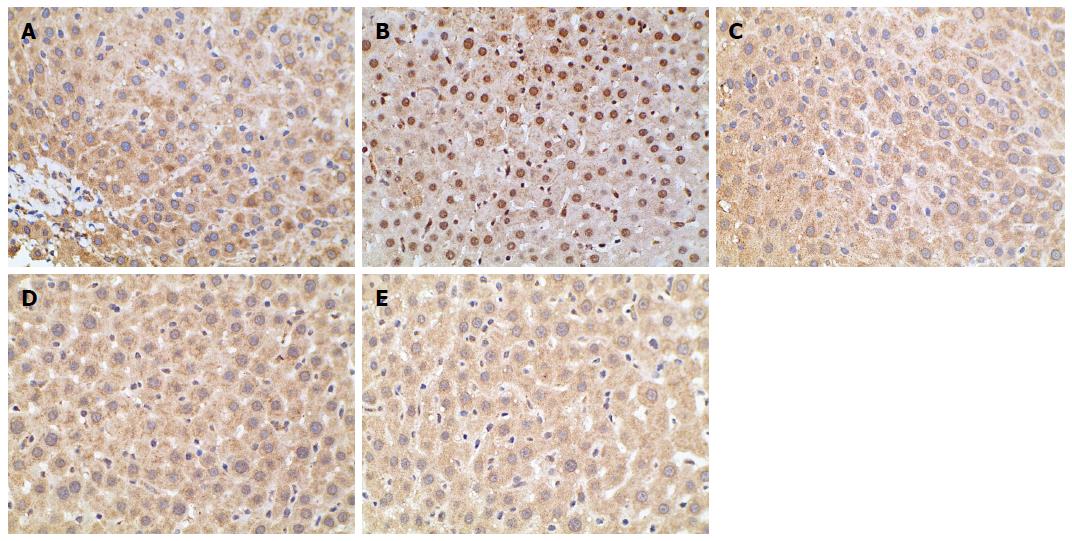
When TORC2 is phosphorylated in the liver, it is located in the cytoplasm and gluconeogenesis does not occur. As shown in Figure 5, the p-TORC2 levels of the model group was lower than that of the normal control group (P < 0.01), and the p-TORC2 levels were significantly increased in groups treated with berberine, AICAR or metformin compared to the model group (P < 0.01). However, there was no significant difference in the expression of total TORC2 protein across the five groups (P > 0.01). As shown in Figure 6, we also verified that berberine inhibited TORC2 nuclear translocation in the liver tissues via immunohistochemical staining. The nuclear expression of TORC2 protein was obviously increased in the model group compared to the normal group; however, the treatments with berberine, AICAR and metformin inhibited the nuclear translocation of the TORC2 protein.
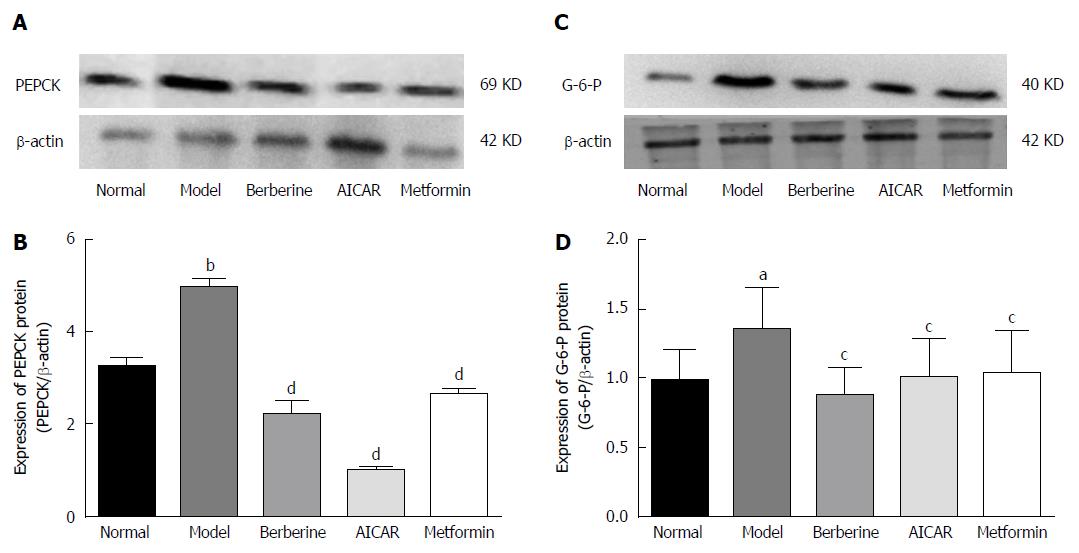
PEPCK and G-6-P are key gluconeogenesis enzymes and can affect plasma glucose. Expression of PEPCK and G-6-P proteins was increased in the model rats compared to the normal control group (P < 0.01), and treatment with berberine, AICAR and metformin decreased expression of PEPCK and G-6-P protein compared to the model rats (P < 0.05) (Figure 7).
Berberine was first found to exhibit hypoglycemic actions in 1988, and numerous studies related to the ability of berberine to attenuate diabetes have been reported in the last 25 years. Previous evidence has shown that berberine can decrease blood glucose, regulate lipids, and improve insulin resistance via many different molecular mechanisms[12-14]; however, little research has focused on whether berberine inhibits hepatic gluconeogenesis via AMPK. Previous studies have illustrated that the regulation of gluconeogenesis is involved in the insulin signaling pathway. In re-feeding mice, insulin inhibits gluconeogenic gene expression via the promotion of the phosphorylation of TOCR2[15]. In the models of insulin signaling deficiency, the expression of PGC-1 which plays a role in liver gluconeogenesis is elevated. Thus, insulin is a primary suppressor of gluconeogenesis[16]. However, the current study revealed that glucose metabolism was regulated independently of insulin action. The loss of LKB1 in the mouse liver resulted in an increase in TOCR2 gene expression and drove gluconeogenesis via the AMPK signaling pathway[4]. In a clinical trial, Keshavarz et al[17] examined identification of single nucleotide polymorphisms in LKB1 and TOCR2 genes, and the results suggested a probable association between the LKB1-AMPK-TOCR2 signaling pathway and glucose homeostasis in the liver. These studies provided more insight to consider whether berberine suppresses gluconeogenesis to attenuate hyperglycemia via the AMPK signaling pathway.
In this study, we showed that berberine restrained protein expression of the key gluconeogenic enzymes PEPCK and G-6-Pase in model rats (Figure 7). These results agree with those of previous reports[9,10]. Berberine inhibited PEPCK and G-6-Pase protein expression via the suppression of mitochondrial function[10]. The glucose-lowering effect of berberine is related to the suppression of the expression of the key hepatic gluconeogenic enzymes PEPCK and G-6-Pase via the AMPK signaling pathway[9]. AMPK is a potential target for balancing glucose and lipid metabolism in the treatment of type 2 diabetes. Berberine treatment increases AMPK activity and contributes to the elevations in the level of AMPK phosphorylation in the liver[9,10,18,19]. In the present study, we examined the protein expression of AMPK and p-AMPK in the liver tissues (Figure 4). We observed that berberine increased the amount of total AMPK and phosphorylation of AMPK. Treatment with berberine restored the AMPK activity observed in the diabetic condition to the level observed in the non-diabetic condition (Figure 5). This increase in AMPK activity was accompanied by reductions in PEPCK and G-6-Pase expression. These results are consistent with previous data. The research of Shaw et al[4] provided us with inspiration to explore further the hypoglycemic actions of berberine. In their study, LKB1 deletion in the liver led to a reduction in AMPK phosphorylation; thus, the activation of AMPK depends on LKB1. We considered whether LKB1 acts as a critical upstream target of AMPK when berberine treatment is accompanied by a change in AMPK. In our study, we measured the expression of LKB1 in the diabetic liver. Intriguingly, we found that LKB1 protein expression in treated groups was increased compared to the levels observed in the diabetic rats (Figure 3). Next, we sought to understand how AMPK affects the expression of the gluconeogenic enzymes PEPCK and G-6-Pase. Koo et al[5] reported that the activation of AMPK promotes TOCR2 phosphorylation and blocks its nuclear accumulation. Consequently, gluconeogenic enzyme expression is interrupted[4,20]. In the current research, we detected no significant difference in the total amount of TOCR2 between the normal and diabetic rats, but TOCR2 phosphorylation in the cytoplasm was increased by the berberine treatment relative to model rats (Figure 5). Berberine treatment inhibited the translocation of TOCR2 into the cell nucleus, and the TORC2 nuclear accumulation observed in the berberine group was lower than that observed in the model group (Figure 6). Thus, the transcription of gluconeogenic genes was reduced, and the liver glucose output was decreased. In our study, we observed lower blood glucose levels in the treated group than in the model group (Figure 1). High blood glucose levels stimulate the pancreas to secrete insulin and result in hyperinsulinemia. Our results revealed that berberine treatment reduced fasting insulin level compared to those observed in the model group (Figure 2).
To research the therapeutic effects of berberine, we chose to use AICAR and metformin as positive control groups. Some studies have shown that AICAR and metformin are AMPK agonists, and that they inhibit gluconeogenesis to regulate glucose metabolism through the AMPK signaling pathway[4,21-23]. In our research, we found no significant differences between these treatment groups.
In conclusion, our study revealed that berberine inhibited expression of the gluconeogenic proteins PEPCK and G-6-Pase in the liver. Consequently, reductions in blood glucose levels were accompanied by reductions in blood insulin levels reduction due to the inhibition of gluconeogenesis. Moreover, blood lipid levels simultaneously improved (Table 1). The mechanisms responsible for the effects of berberine treatment might be related to the suppression of gluconeogenesis through the LKB1-AMPK-TOCR2 signaling pathway.
Numerous studies related to the ability of berberine to attenuate diabetes have been reported. Previous evidence has shown that berberine can decrease blood glucose, regulate lipids, and improve insulin resistance via many different molecular mechanisms. However, little research has focused on whether berberine inhibits hepatic gluconeogenesis via AMP-activated protein kinase (AMPK).
Animal experiments showed that the loss of liver kinase (LK)B1 in the mouse liver resulted in an increase in CREB-regulated transcription co-activator (TORC)2 gene expression and drove gluconeogenesis via the AMPK signaling pathway. Moreover, a clinical trial suggested a probable association between the LKB1-AMPK-TOCR2 signaling pathway and glucose homeostasis in the liver. Recently, berberine was proven to be capable of reducing hyperglycemia via the inhibition of hepatic gluconeogenesis. Therefore, we hypothesized that berberine reduces hyperglycemia via the LKB1-AMPK-TORC2 signaling pathway to control gluconeogenesis.
This is the first study to show that berberine reduces hyperglycemia via the LKB1-AMPK-TORC2 signaling pathway to control gluconeogenesis.
In the future, the LKB1-AMPK-TORC2 signaling pathway will probably be a target for berberine treating type 2 diabetes.
Hepatic gluconeogenesis is strongly stimulated in the fasting state and converts glycogen into glucose to increase glucose output. AMPK is a conserved sensor and regulator of cellar energy balance that is activated when the cellular AMP: ATP ratio exhibits a large increase.
In this paper, the authors identified the association between the LKB1- AMPK-TOCR2 signaling pathway and glucose homeostasis in the liver. At the time, this study proved the molecular mechanisms of berberine inhibiting hepatic gluconeogenesis. The research is important for further research of berberine.
P- Reviewer: Xu Z, Wang L S- Editor: Qi Y L- Editor: Kerr C E- Editor: Wang CH
| 1. | Radziuk J, Pye S. Hepatic glucose uptake, gluconeogenesis and the regulation of glycogen synthesis. Diabetes Metab Res Rev. 2001;17:250-272. [PubMed] |
| 2. | Kahn BB, Alquier T, Carling D, Hardie DG. AMP-activated protein kinase: ancient energy gauge provides clues to modern understanding of metabolism. Cell Metab. 2005;1:15-25. [RCA] [PubMed] [DOI] [Full Text] [Cited by in Crossref: 2152] [Cited by in RCA: 2175] [Article Influence: 108.8] [Reference Citation Analysis (0)] |
| 3. | Hemminki A, Markie D, Tomlinson I, Avizienyte E, Roth S, Loukola A, Bignell G, Warren W, Aminoff M, Höglund P. A serine/threonine kinase gene defective in Peutz-Jeghers syndrome. Nature. 1998;391:184-187. [RCA] [PubMed] [DOI] [Full Text] [Cited by in Crossref: 1136] [Cited by in RCA: 1082] [Article Influence: 40.1] [Reference Citation Analysis (0)] |
| 4. | Shaw RJ, Lamia KA, Vasquez D, Koo SH, Bardeesy N, Depinho RA, Montminy M, Cantley LC. The kinase LKB1 mediates glucose homeostasis in liver and therapeutic effects of metformin. Science. 2005;310:1642-1646. [RCA] [PubMed] [DOI] [Full Text] [Full Text (PDF)] [Cited by in Crossref: 1555] [Cited by in RCA: 1501] [Article Influence: 75.1] [Reference Citation Analysis (0)] |
| 5. | Koo SH, Flechner L, Qi L, Zhang X, Screaton RA, Jeffries S, Hedrick S, Xu W, Boussouar F, Brindle P. The CREB coactivator TORC2 is a key regulator of fasting glucose metabolism. Nature. 2005;437:1109-1111. [RCA] [PubMed] [DOI] [Full Text] [Cited by in Crossref: 724] [Cited by in RCA: 790] [Article Influence: 39.5] [Reference Citation Analysis (0)] |
| 6. | Lin J, Wu PH, Tarr PT, Lindenberg KS, St-Pierre J, Zhang CY, Mootha VK, Jäger S, Vianna CR, Reznick RM. Defects in adaptive energy metabolism with CNS-linked hyperactivity in PGC-1alpha null mice. Cell. 2004;119:121-135. [RCA] [PubMed] [DOI] [Full Text] [Cited by in Crossref: 1006] [Cited by in RCA: 969] [Article Influence: 46.1] [Reference Citation Analysis (0)] |
| 7. | Yoon JC, Puigserver P, Chen G, Donovan J, Wu Z, Rhee J, Adelmant G, Stafford J, Kahn CR, Granner DK. Control of hepatic gluconeogenesis through the transcriptional coactivator PGC-1. Nature. 2001;413:131-138. [RCA] [PubMed] [DOI] [Full Text] [Cited by in Crossref: 1494] [Cited by in RCA: 1436] [Article Influence: 59.8] [Reference Citation Analysis (0)] |
| 8. | Ni YX. [Therapeutic effect of berberine on 60 patients with type II diabetes mellitus and experimental research]. Zhong Xi Yi Jie He Za Zhi. 1988;8:711-713, 707. [PubMed] |
| 9. | Zhang M, Lv X, Li J, Meng Z, Wang Q, Chang W, Li W, Chen L, Liu Y. Sodium caprate augments the hypoglycemic effect of berberine via AMPK in inhibiting hepatic gluconeogenesis. Mol Cell Endocrinol. 2012;363:122-130. [RCA] [PubMed] [DOI] [Full Text] [Cited by in Crossref: 56] [Cited by in RCA: 68] [Article Influence: 5.2] [Reference Citation Analysis (0)] |
| 10. | Xia X, Yan J, Shen Y, Tang K, Yin J, Zhang Y, Yang D, Liang H, Ye J, Weng J. Berberine improves glucose metabolism in diabetic rats by inhibition of hepatic gluconeogenesis. PLoS One. 2011;6:e16556. [RCA] [PubMed] [DOI] [Full Text] [Full Text (PDF)] [Cited by in Crossref: 208] [Cited by in RCA: 202] [Article Influence: 14.4] [Reference Citation Analysis (0)] |
| 11. | Li JB, Xu LJ, Dong H, Huang ZY, Zhao Y, Chen G, Lu FE. Effects of Chinese Fructus Mume formula and its separated prescription extract on insulin resistance in type 2 diabetic rats. J Huazhong Univ Sci Technolog Med Sci. 2013;33:877-885. [RCA] [PubMed] [DOI] [Full Text] [Cited by in Crossref: 7] [Cited by in RCA: 7] [Article Influence: 0.6] [Reference Citation Analysis (0)] |
| 12. | Liu X, Li G, Zhu H, Huang L, Liu Y, Ma C, Qin C. Beneficial effect of berberine on hepatic insulin resistance in diabetic hamsters possibly involves in SREBPs, LXRα and PPARα transcriptional programs. Endocr J. 2010;57:881-893. [PubMed] |
| 13. | Kong WJ, Zhang H, Song DQ, Xue R, Zhao W, Wei J, Wang YM, Shan N, Zhou ZX, Yang P. Berberine reduces insulin resistance through protein kinase C-dependent up-regulation of insulin receptor expression. Metabolism. 2009;58:109-119. [RCA] [PubMed] [DOI] [Full Text] [Cited by in Crossref: 177] [Cited by in RCA: 176] [Article Influence: 11.0] [Reference Citation Analysis (0)] |
| 14. | Zhou L, Yang Y, Wang X, Liu S, Shang W, Yuan G, Li F, Tang J, Chen M, Chen J. Berberine stimulates glucose transport through a mechanism distinct from insulin. Metabolism. 2007;56:405-412. [RCA] [PubMed] [DOI] [Full Text] [Cited by in Crossref: 128] [Cited by in RCA: 134] [Article Influence: 7.4] [Reference Citation Analysis (0)] |
| 15. | Dentin R, Liu Y, Koo SH, Hedrick S, Vargas T, Heredia J, Yates J, Montminy M. Insulin modulates gluconeogenesis by inhibition of the coactivator TORC2. Nature. 2007;449:366-369. [RCA] [PubMed] [DOI] [Full Text] [Cited by in Crossref: 306] [Cited by in RCA: 324] [Article Influence: 18.0] [Reference Citation Analysis (0)] |
| 16. | Puigserver P, Rhee J, Donovan J, Walkey CJ, Yoon JC, Oriente F, Kitamura Y, Altomonte J, Dong H, Accili D. Insulin-regulated hepatic gluconeogenesis through FOXO1-PGC-1alpha interaction. Nature. 2003;423:550-555. [RCA] [PubMed] [DOI] [Full Text] [Cited by in Crossref: 1116] [Cited by in RCA: 1167] [Article Influence: 53.0] [Reference Citation Analysis (0)] |
| 17. | Keshavarz P, Inoue H, Nakamura N, Yoshikawa T, Tanahashi T, Itakura M. Single nucleotide polymorphisms in genes encoding LKB1 (STK11), TORC2 (CRTC2) and AMPK alpha2-subunit (PRKAA2) and risk of type 2 diabetes. Mol Genet Metab. 2008;93:200-209. [RCA] [PubMed] [DOI] [Full Text] [Cited by in Crossref: 33] [Cited by in RCA: 31] [Article Influence: 1.8] [Reference Citation Analysis (0)] |
| 18. | Cao S, Zhou Y, Xu P, Wang Y, Yan J, Bin W, Qiu F, Kang N. Berberine metabolites exhibit triglyceride-lowering effects via activation of AMP-activated protein kinase in Hep G2 cells. J Ethnopharmacol. 2013;149:576-582. [RCA] [PubMed] [DOI] [Full Text] [Cited by in Crossref: 39] [Cited by in RCA: 54] [Article Influence: 4.5] [Reference Citation Analysis (0)] |
| 19. | Ge Y, Zhang Y, Li R, Chen W, Li Y, Chen G. Berberine regulated Gck, G6pc, Pck1 and Srebp-1c expression and activated AMP-activated protein kinase in primary rat hepatocytes. Int J Biol Sci. 2011;7:673-684. [PubMed] |
| 20. | Screaton RA, Conkright MD, Katoh Y, Best JL, Canettieri G, Jeffries S, Guzman E, Niessen S, Yates JR, Takemori H. The CREB coactivator TORC2 functions as a calcium- and cAMP-sensitive coincidence detector. Cell. 2004;119:61-74. [RCA] [PubMed] [DOI] [Full Text] [Cited by in Crossref: 491] [Cited by in RCA: 532] [Article Influence: 25.3] [Reference Citation Analysis (0)] |
| 21. | Aatsinki SM, Buler M, Salomäki H, Koulu M, Pavek P, Hakkola J. Metformin induces PGC-1α expression and selectively affects hepatic PGC-1α functions. Br J Pharmacol. 2014;171:2351-2363. [RCA] [PubMed] [DOI] [Full Text] [Cited by in Crossref: 52] [Cited by in RCA: 63] [Article Influence: 5.7] [Reference Citation Analysis (0)] |
| 22. | He L, Sabet A, Djedjos S, Miller R, Sun X, Hussain MA, Radovick S, Wondisford FE. Metformin and insulin suppress hepatic gluconeogenesis through phosphorylation of CREB binding protein. Cell. 2009;137:635-646. [RCA] [PubMed] [DOI] [Full Text] [Full Text (PDF)] [Cited by in Crossref: 404] [Cited by in RCA: 392] [Article Influence: 24.5] [Reference Citation Analysis (0)] |
| 23. | Shirai T, Inoue E, Ishimi Y, Yamauchi J. AICAR response element binding protein (AREBP), a key modulator of hepatic glucose production regulated by AMPK in vivo. Biochem Biophys Res Commun. 2011;414:287-291. [RCA] [PubMed] [DOI] [Full Text] [Cited by in Crossref: 11] [Cited by in RCA: 12] [Article Influence: 0.9] [Reference Citation Analysis (0)] |


