Copyright
©The Author(s) 2015.
World J Gastroenterol. Jul 7, 2015; 21(25): 7777-7785
Published online Jul 7, 2015. doi: 10.3748/wjg.v21.i25.7777
Published online Jul 7, 2015. doi: 10.3748/wjg.v21.i25.7777
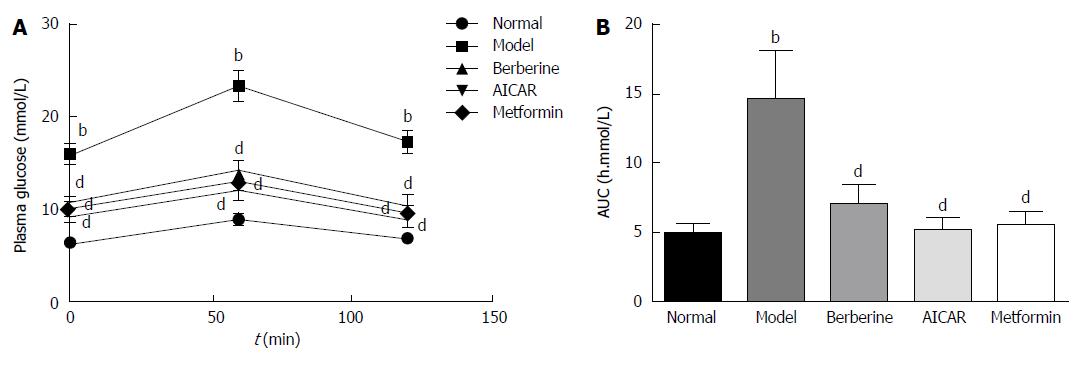
Figure 1 Effects of berberine on plasma glucose levels in the oral glucose tolerance test and the areas under the curves for plasma glucose.
bP < 0.01 vs the normal control group at the corresponding time point; dP < 0.01 vs the model group at the corresponding time point (by ANOVA). AUC: Areas under the curve.
-
Citation: Jiang SJ, Dong H, Li JB, Xu LJ, Zou X, Wang KF, Lu FE, Yi P. Berberine inhibits hepatic gluconeogenesis
via the LKB1-AMPK-TORC2 signaling pathway in streptozotocin-induced diabetic rats. World J Gastroenterol 2015; 21(25): 7777-7785 - URL: https://www.wjgnet.com/1007-9327/full/v21/i25/7777.htm
- DOI: https://dx.doi.org/10.3748/wjg.v21.i25.7777


