Copyright
©The Author(s) 2015.
World J Gastroenterol. Jul 7, 2015; 21(25): 7777-7785
Published online Jul 7, 2015. doi: 10.3748/wjg.v21.i25.7777
Published online Jul 7, 2015. doi: 10.3748/wjg.v21.i25.7777
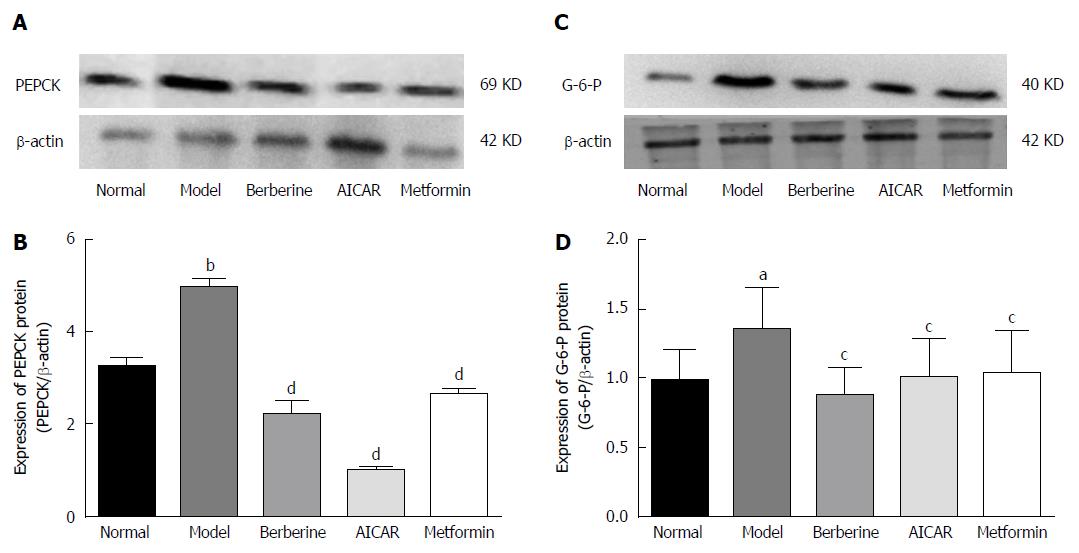
Figure 7 Berberine inhibited expression of key gluconeogenic enzyme proteins.
Western blot analyses of PEPCK and G-6-P proteins in liver tissues of normal rats, model rats and diabetic rats treated with berberine, AICAR or metformin. A: PEPCK blots for each group are shown; C: G-6-P blots for each group are shown; B: Each bar is expressed as the total PEPCK/β-actin and represents the mean ± SD (n = 8); D: Each bar is expressed as the total G-6-P/β-actin and represents the mean ± SD (n = 8). bP < 0.01 vs normal control group; dP < 0.01 vs model group; aP < 0.05 vs normal control group; cP < 0.05 vs model group (by ANOVA).
-
Citation: Jiang SJ, Dong H, Li JB, Xu LJ, Zou X, Wang KF, Lu FE, Yi P. Berberine inhibits hepatic gluconeogenesis
via the LKB1-AMPK-TORC2 signaling pathway in streptozotocin-induced diabetic rats. World J Gastroenterol 2015; 21(25): 7777-7785 - URL: https://www.wjgnet.com/1007-9327/full/v21/i25/7777.htm
- DOI: https://dx.doi.org/10.3748/wjg.v21.i25.7777


