Copyright
©The Author(s) 2015.
World J Gastroenterol. Jul 7, 2015; 21(25): 7777-7785
Published online Jul 7, 2015. doi: 10.3748/wjg.v21.i25.7777
Published online Jul 7, 2015. doi: 10.3748/wjg.v21.i25.7777
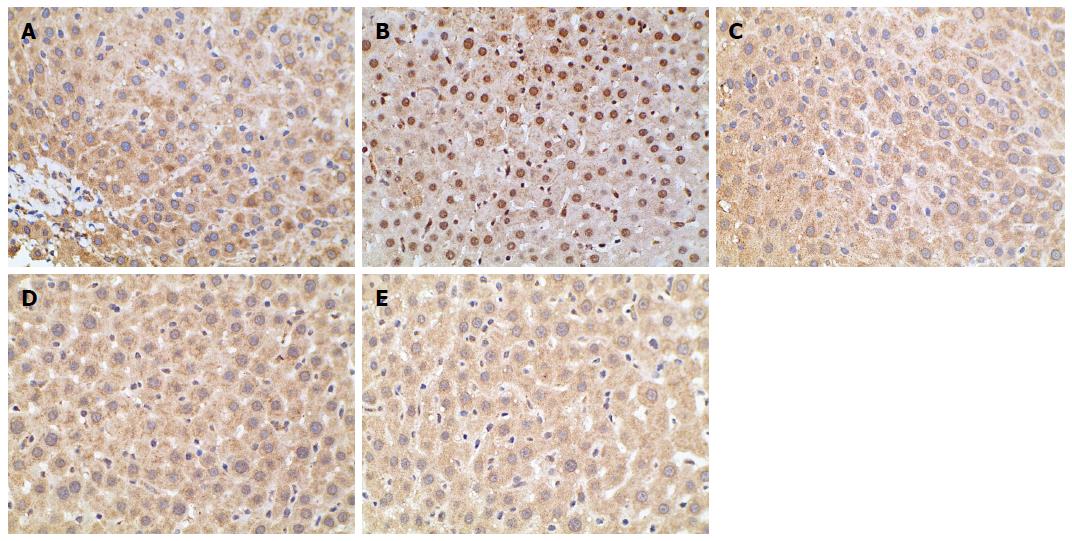
Figure 6 Immunohistochemical staining for TORC2 in the liver tissues.
Optical microscopy image of TORC2 is shown in brown. The normal group (A) exhibited little TORC2 in the nuclei. However, more TORC2 was present in the nuclei of the model group (B). The groups treated with Berberine (C), AICAR (D) and Metformin (E) exhibited lower levels of TORC2 compared to the model group (magnification × 400).
-
Citation: Jiang SJ, Dong H, Li JB, Xu LJ, Zou X, Wang KF, Lu FE, Yi P. Berberine inhibits hepatic gluconeogenesis
via the LKB1-AMPK-TORC2 signaling pathway in streptozotocin-induced diabetic rats. World J Gastroenterol 2015; 21(25): 7777-7785 - URL: https://www.wjgnet.com/1007-9327/full/v21/i25/7777.htm
- DOI: https://dx.doi.org/10.3748/wjg.v21.i25.7777


