
















Copyright: ©Author(s) 2027.
World J Gastroenterol. Jan 7, 2027; 33(1): 123490
Published online Jan 7, 2027. doi: 10.3748/wjg.123490
Published online Jan 7, 2027. doi: 10.3748/wjg.123490
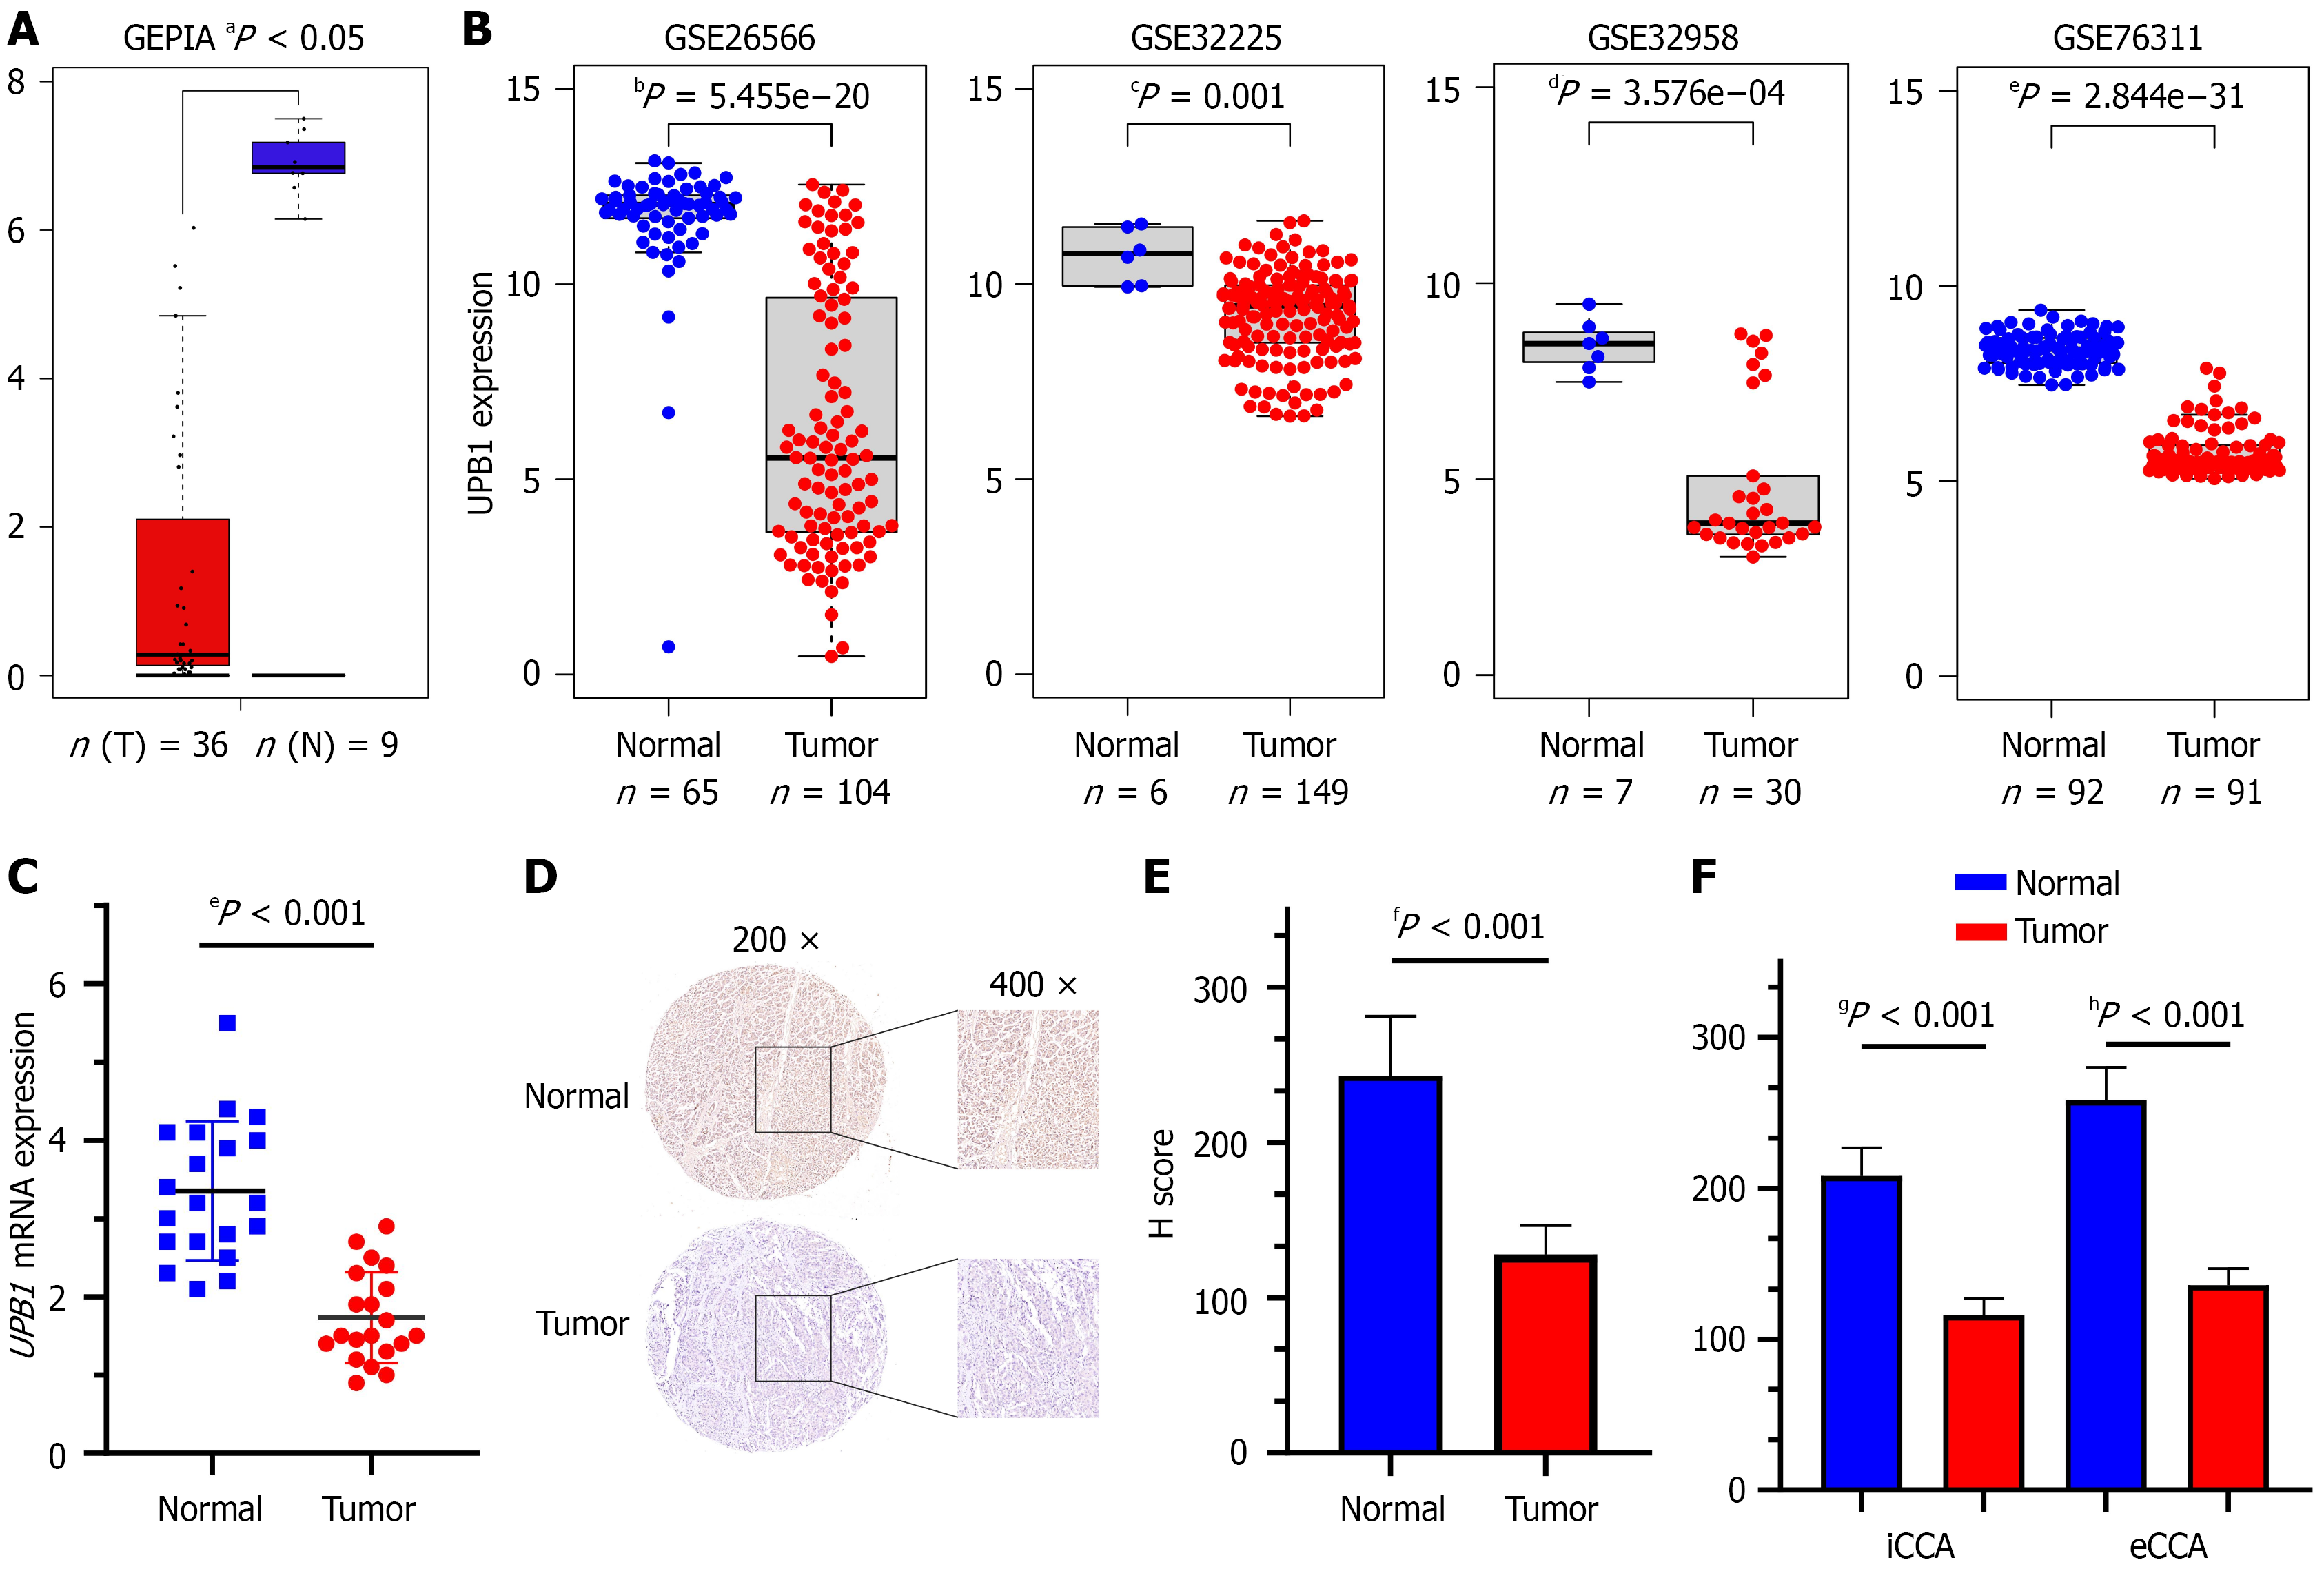
Figure 1 UPB1 is down-regulated in cholangiocarcinoma.
A: Low-expression of UPB1 was identified in cholangiocarcinoma (CCA) in Gene Expression Profiling Interactive Analysis database; B: Down-regulation of UPB1 was identified in CCA in four Gene Expression Omnibus datasets (GSE26566, GSE32225, GSE32958 and GSE76311); C: The messenger RNA expression levels of UPB1 were evaluated in 20 pairs of CCA and normal bile duct tissue samples; D: Representative images of UPB1 staining in CCA specimens and normal bile duct tissues; E and F: H scores of immunohistochemistry showed protein levels of UPB1 were down-regulated in both intrahepatic CCA and extrahepatic CCA tissues. T: Tumor; N: Normal; GEPIA: Gene Expression Profiling Interactive Analysis; mRNA: Messenger RNA; iCCA: Intrahepatic cholangiocarcinoma; eCCA: Extrahepatic cholangiocarcinoma.
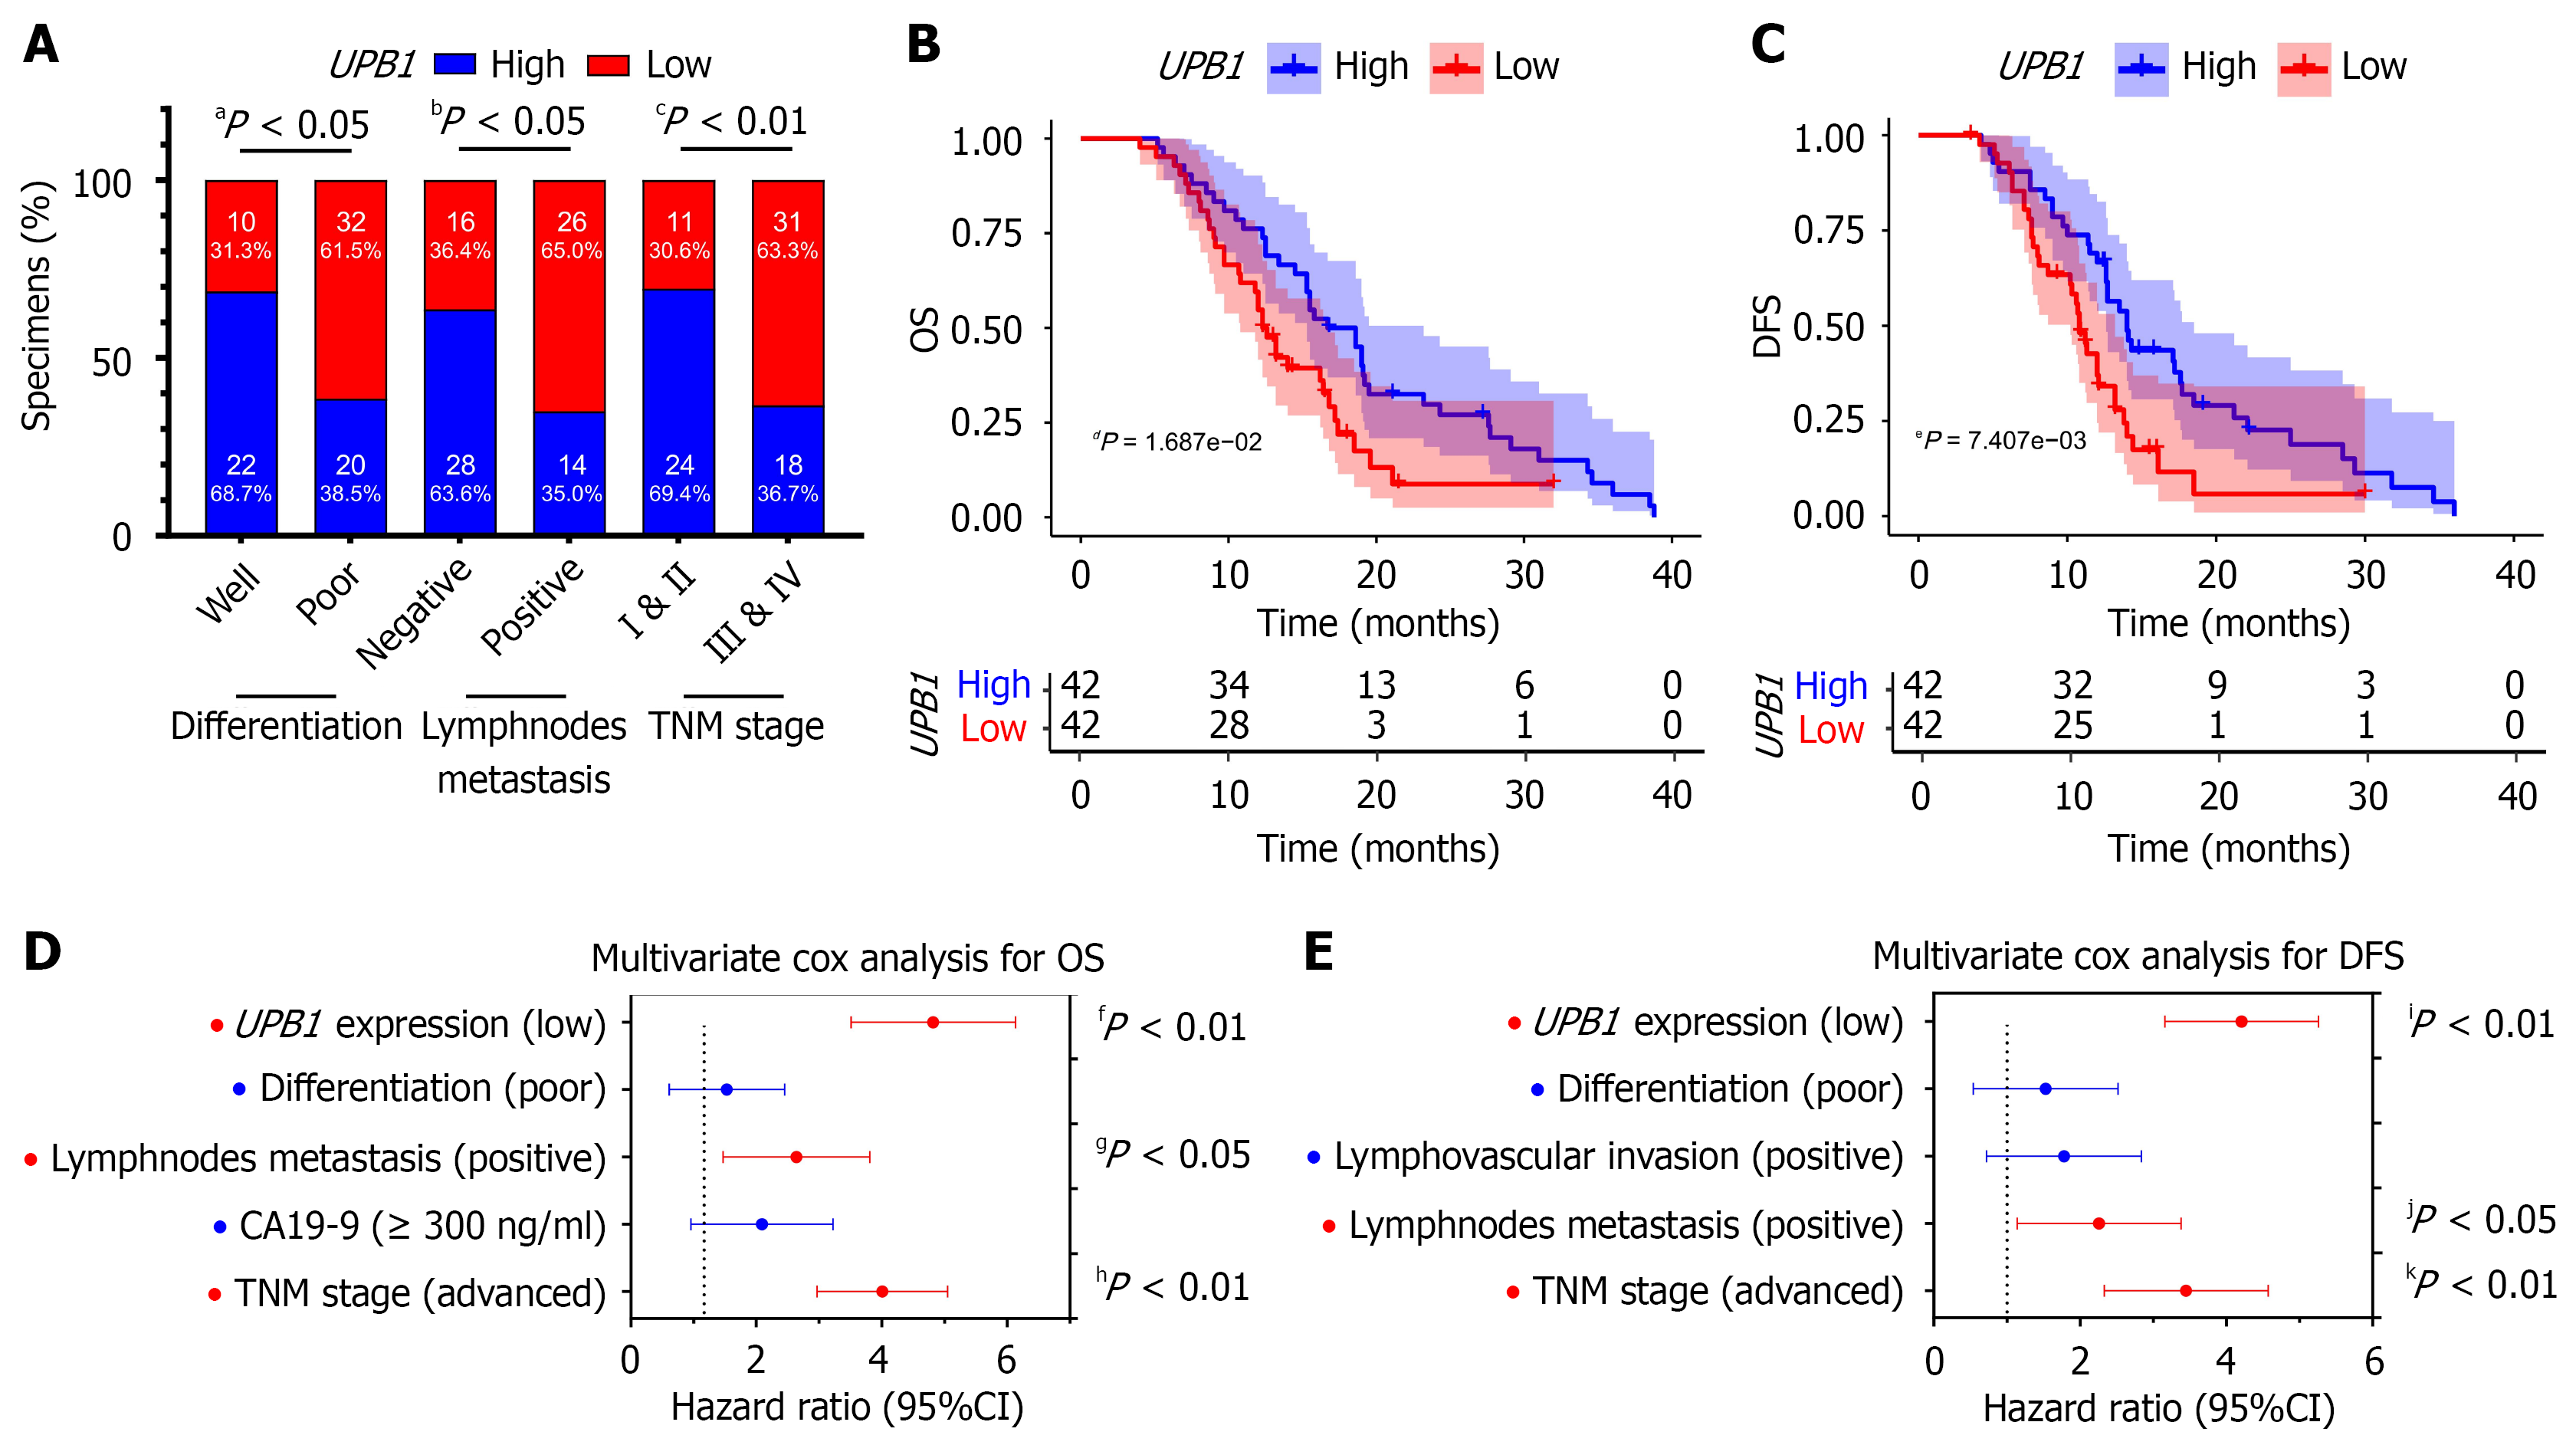
Figure 2 The down-regulation of UPB1 is associated with unfavorable clinical characteristics and outcomes in cholangiocarcinoma.
A: UPB1 expression was significantly correlated with tumor differentiation, lymphnodes metastasis and tumor node metastasis stage of cholangiocarcinoma (CCA); B and C: Kaplan-Meier analyses showed CCA patients with low expression of UPB1 had inferior overall survival (OS) (B) and disease-free survival (DFS) (C) than those with high expression; D and E: Multivariate Cox regression analyses showed low expression of UPB1 was independent risk factor for OS (D) and DFS (E) of CCA patients. TNM: Tumor node metastasis; OS: Overall survival; DFS: Disease-free survival; CA19-9: Carbohydrate antigen 19-9; CI: Confidence interval.
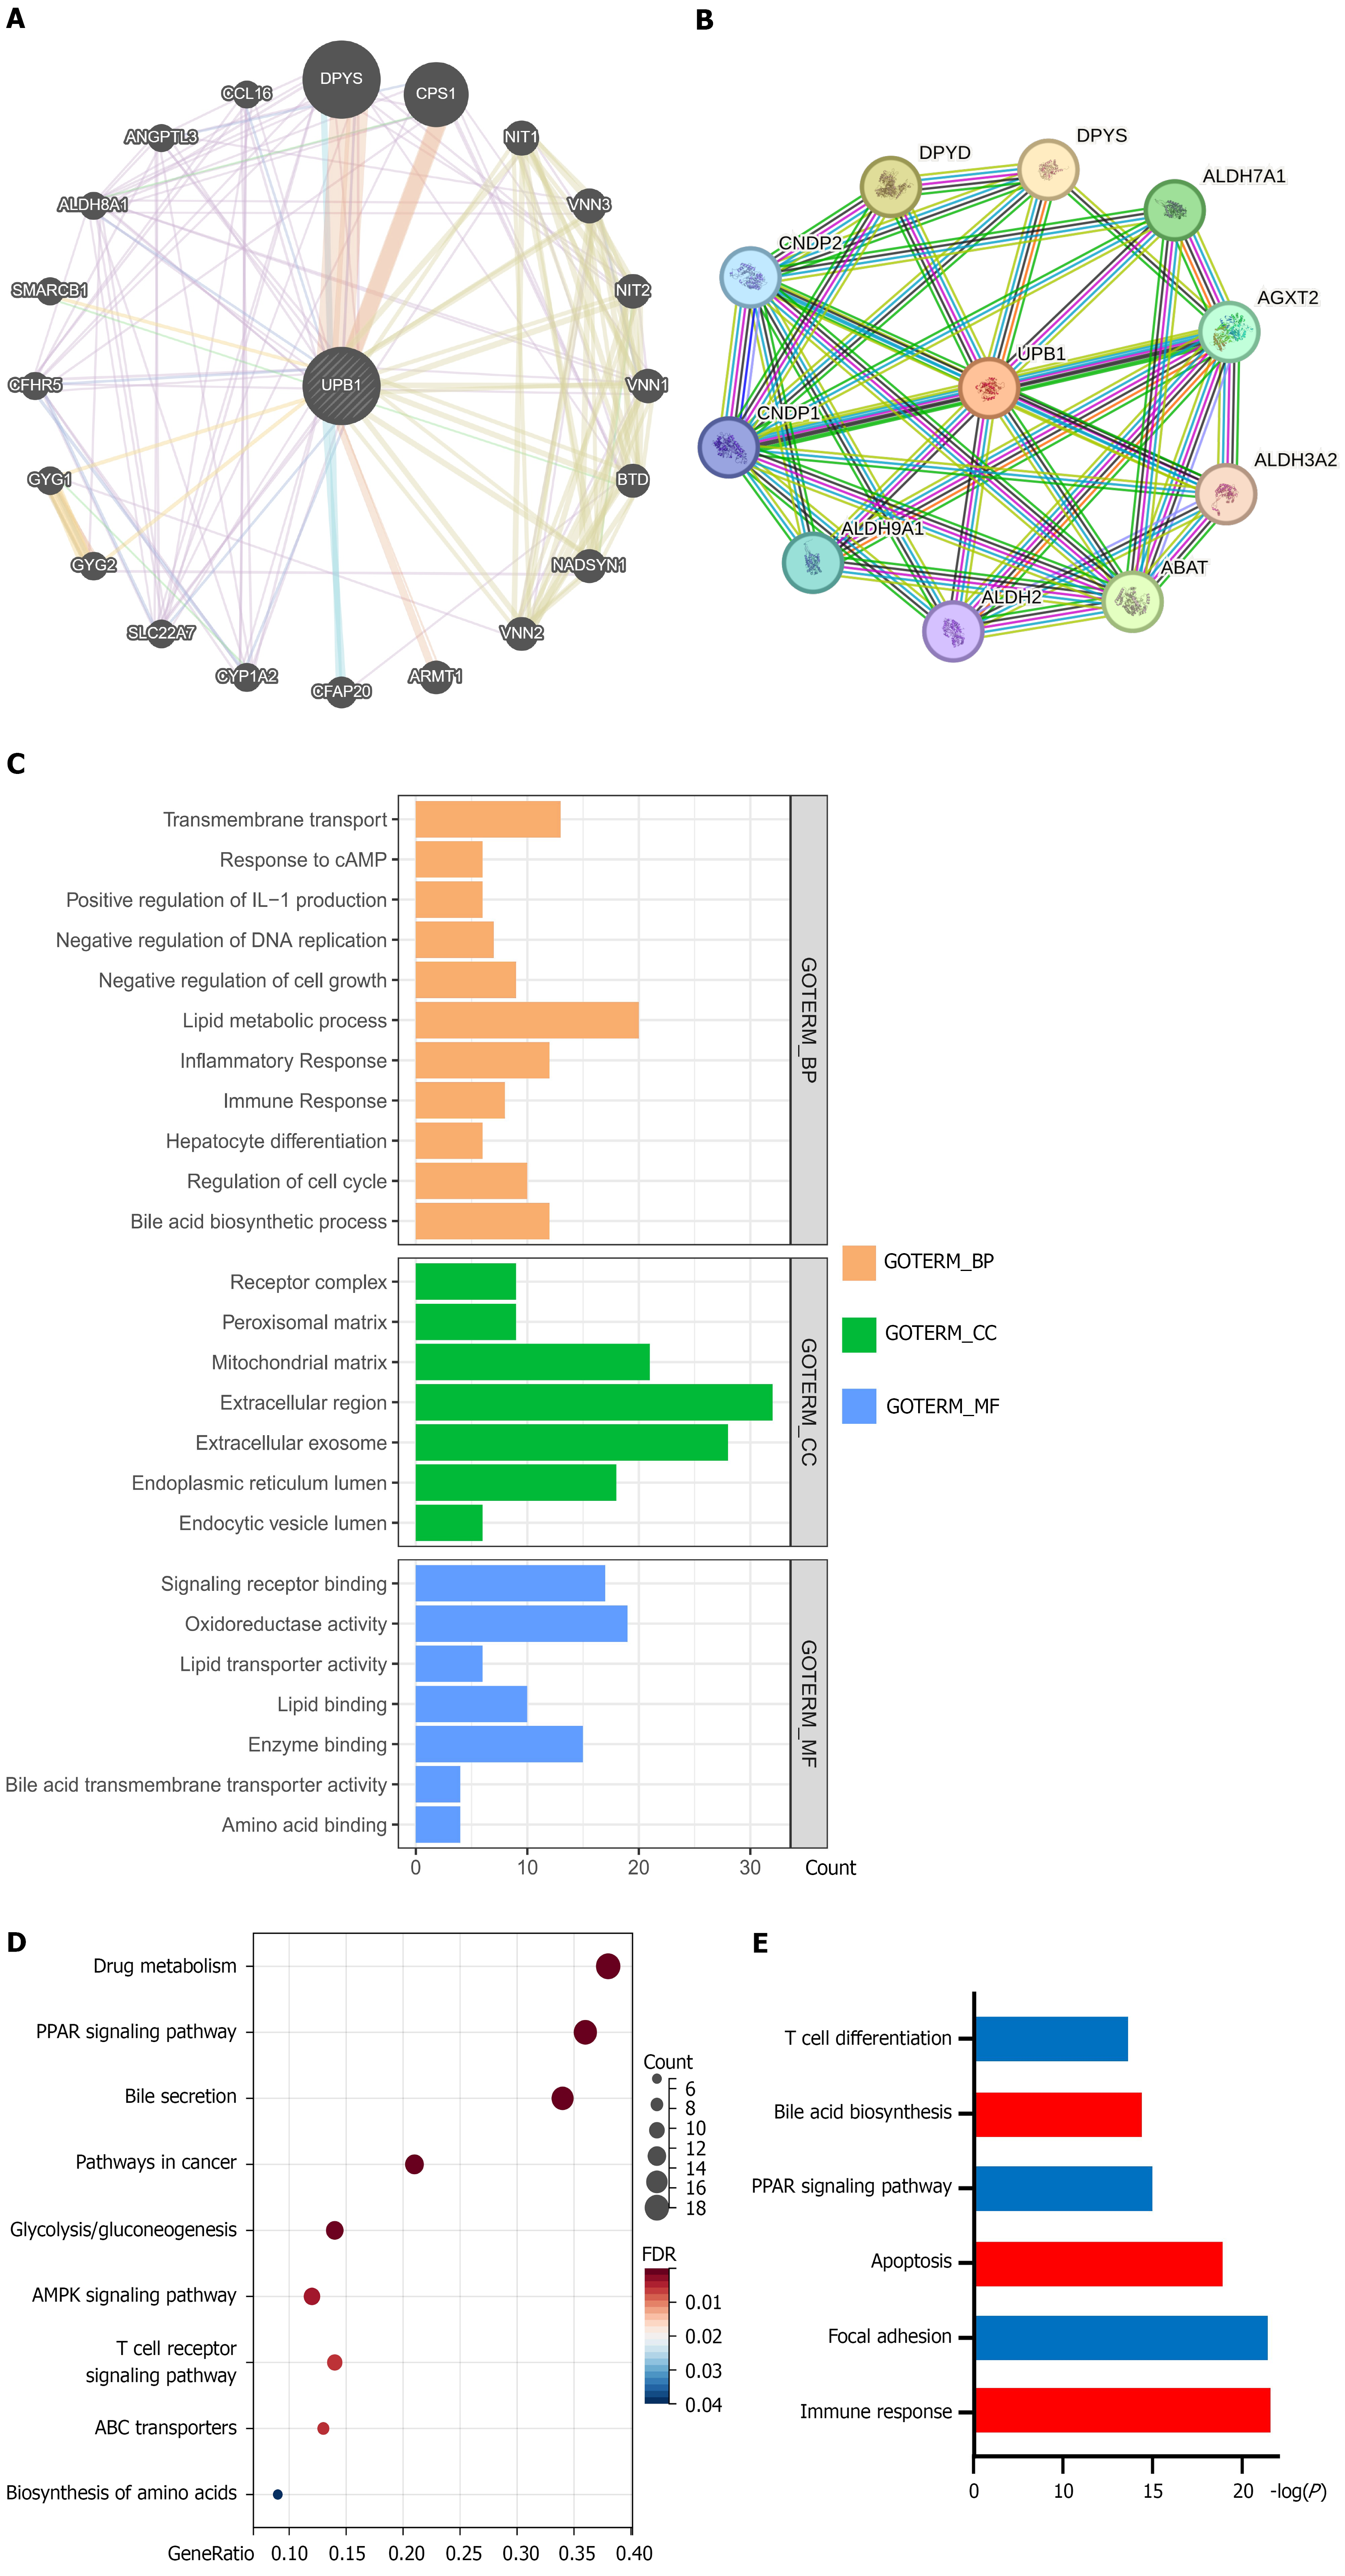
Figure 3 Functional enrichment analyses and neighbor gene network of UPB1 in cholangiocarcinoma.
A: GeneMANIA tool was used to show the relationships of neighbor genes of UPB1 and construct a network map; B: STRING tool was used to construct a protein-protein interaction network of UPB1; C: Gene Ontology enrichment analysis of UPB1; D: Kyoto Encyclopedia of Genes and Genomes pathway analysis of UPB1; E: Gene Set Enrichment Analysis of UPB1. BP: Biological process; CC: Cellular component; MF: Molecular function; cAMP: Cyclic adenosine monophosphate; IL: Interleukin; PPAR: Peroxisome proliferators-activated receptor; ABC: Adenosine triphosphate-binding cassette; AMPK: Adenosine 5’-monophosphate-activated protein kinase.
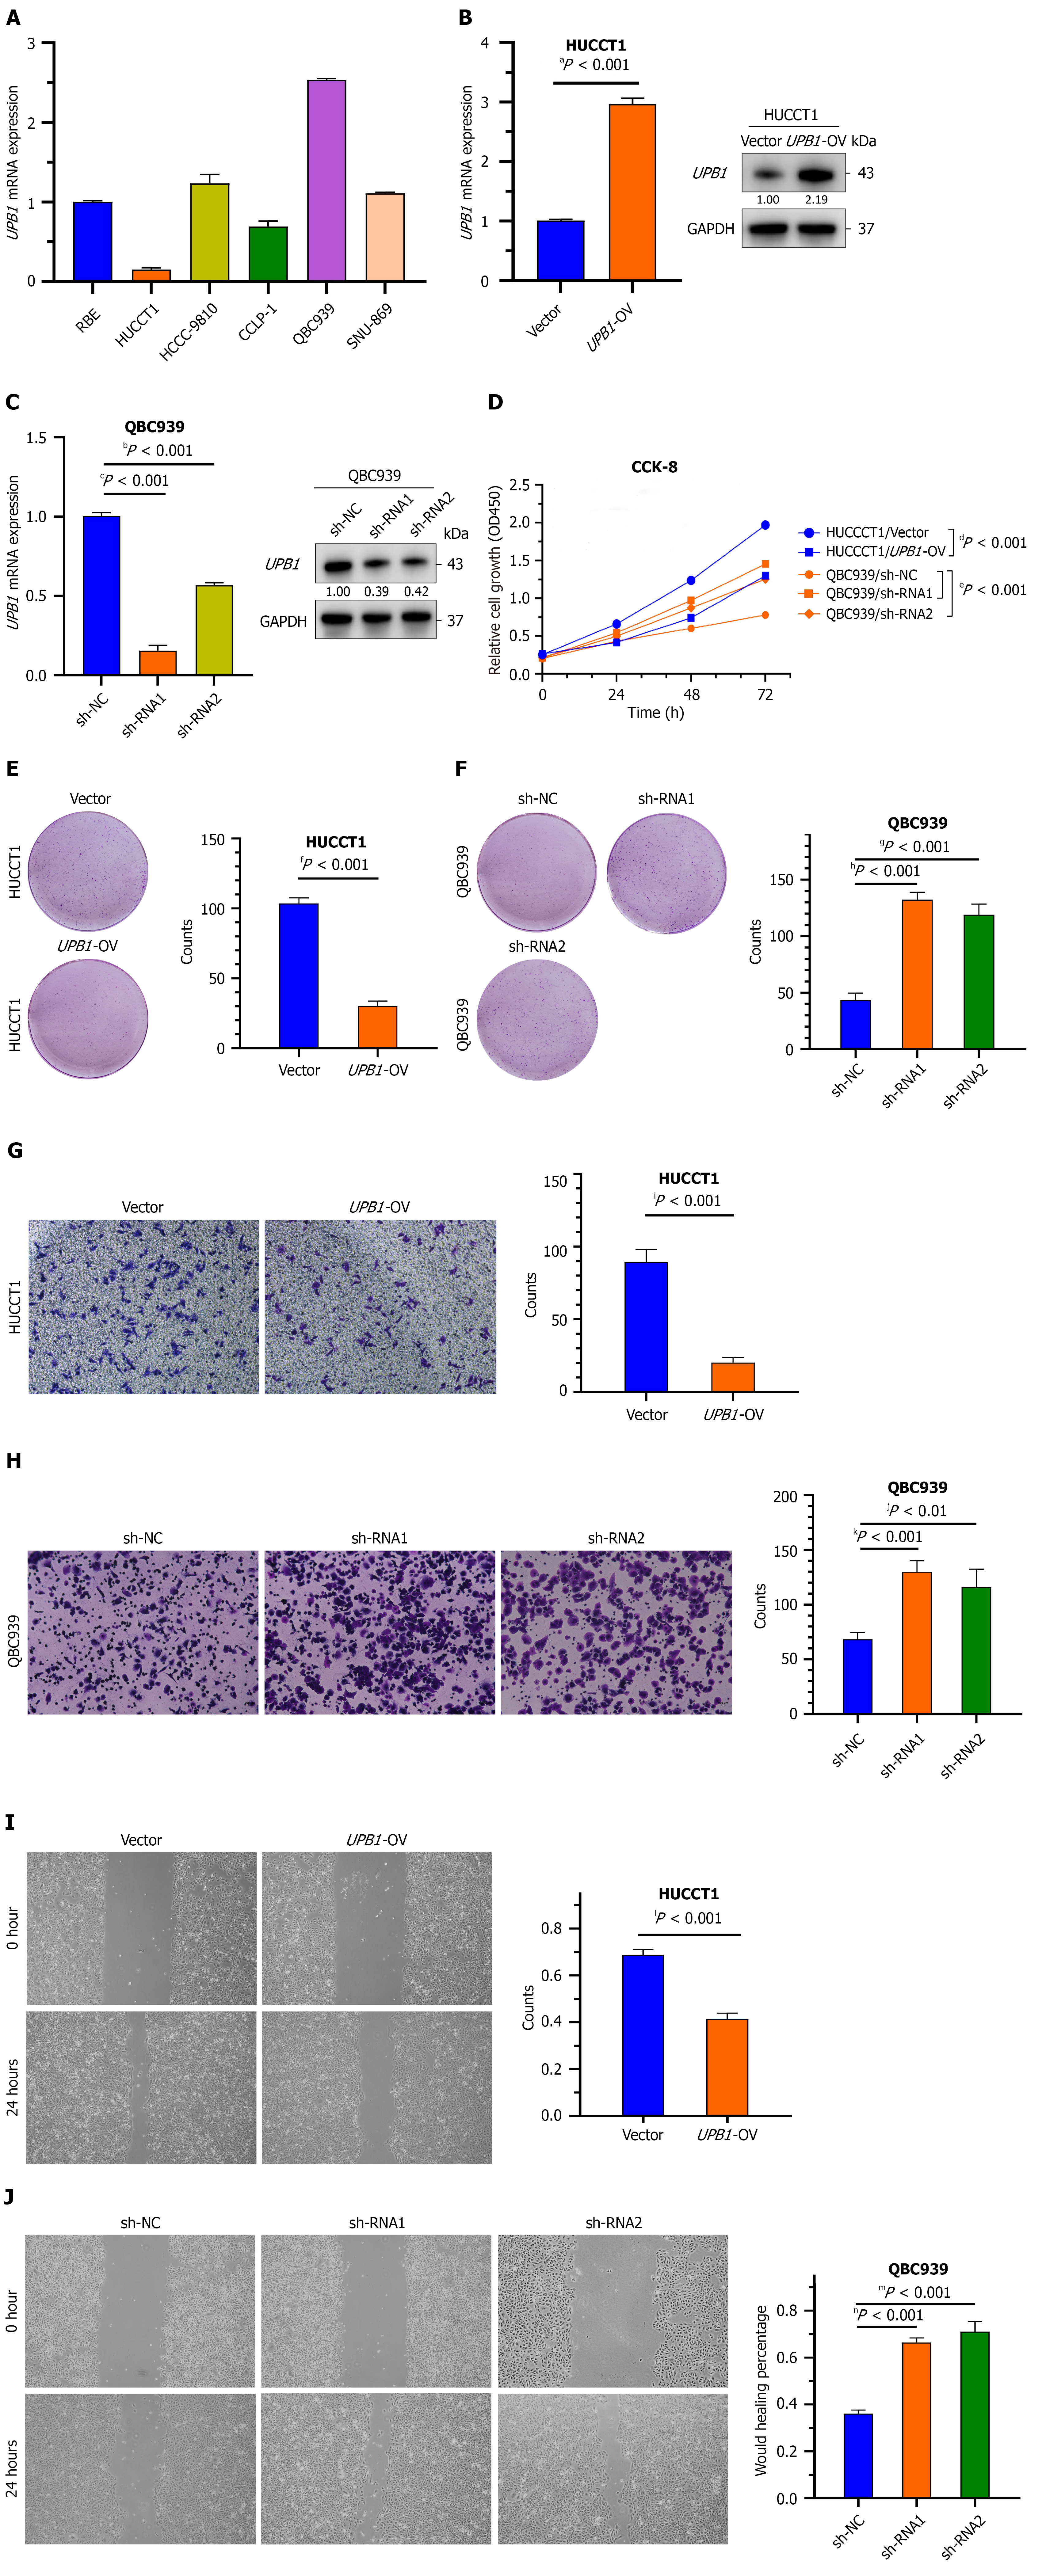
Figure 4 The overexpression of UPB1 inhibits the proliferation and migration of cholangiocarcinoma cells.
A: Real-time quantitative polymerase chain reaction (RT-qPCR) assays showed UPB1 was highly expressed in QBC939 cells, while relatively low-expressed in HUCCT1 cells among cholangiocarcinoma cell lines; B and C: RT-qPCR and western blot assays were used to assess the over-expression of UPB1 in HUCCT1 cells (B) and the silence of UPB1 in QBC939 cells (C); D-F: Cell counting kit-8 (D) and colony formation assays (E and F) showed that UPB1 over-expression reduced the proliferation of HUCCT1 cells, while UPB1 deletion promoted the proliferation of QBC939 cells; G-J: Transwell assays (G and H) and would healing assays (I and J) showed that UPB1 over-expression reduced the migration of HUCCT1 cells, while UPB1 deletion promoted the migration of QBC939 cells. Scale bars: 150 μm. mRNA: Messenger RNA; OV: Over-expression; GAPDH: Glyceraldehyde-3-phosphate dehydrogenase; sh-NC: Short hairpin RNA negative control; shRNA: Short hairpin RNA; CCK-8: Cell counting kit-8.
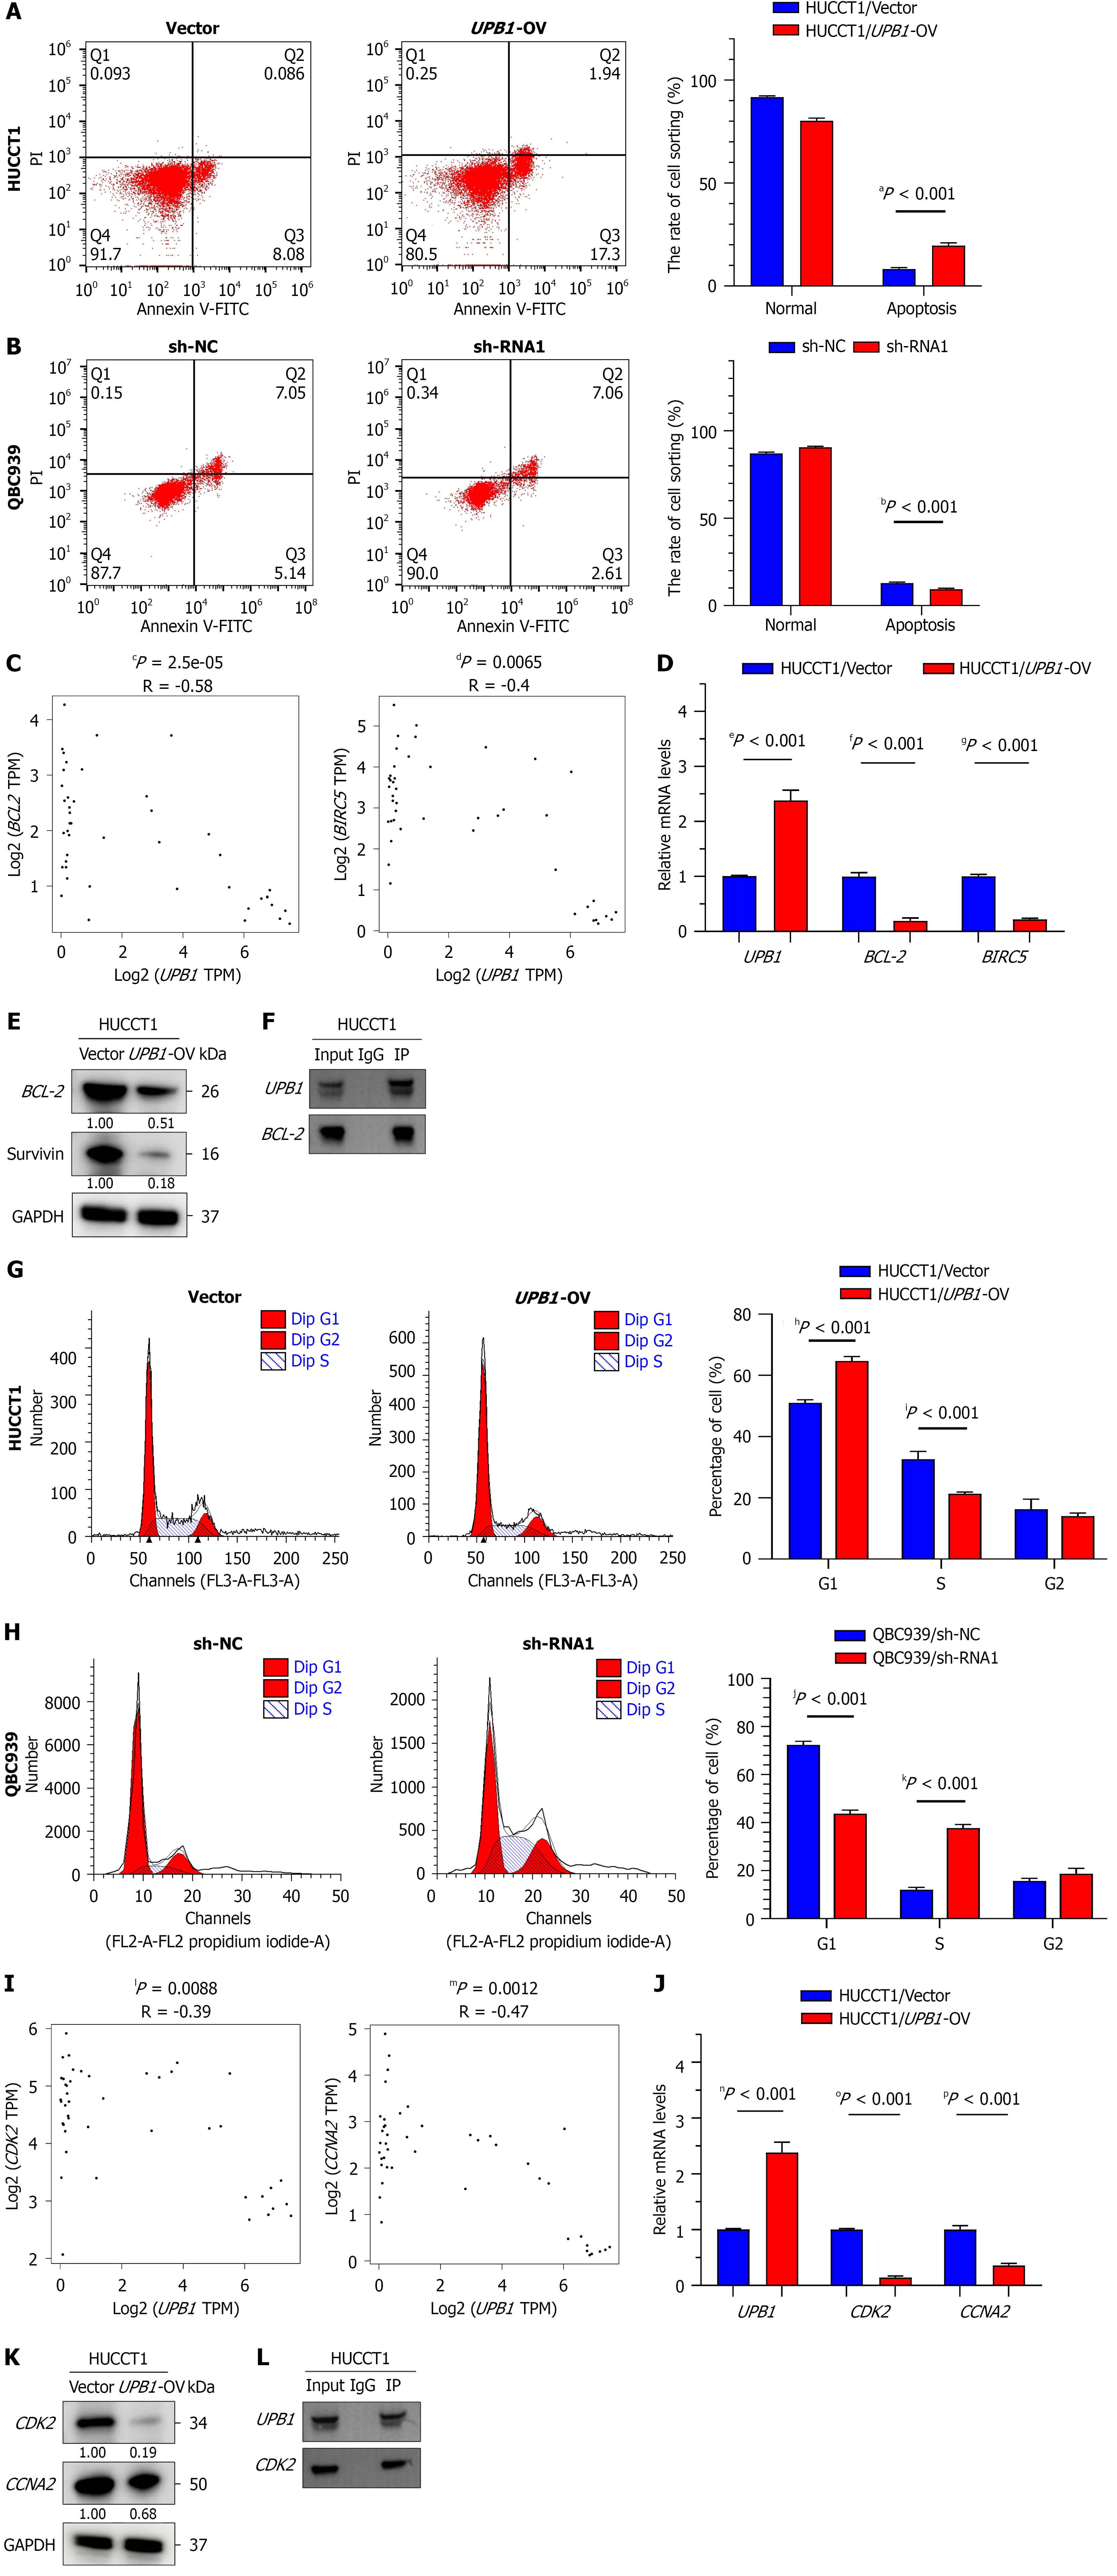
Figure 5 The overexpression of UPB1 arrests cell cycle and promotes apoptosis of cholangiocarcinoma cells.
A and B: Flow cytometry showed that UPB1 over-expression increased the percentage of apoptotic HUCCT1 cells (A), while UPB1 knockdown reduced the percentage of apoptotic QBC939 cells (B); C: Correlations of UPB1 expression with BCL-2 and BIRC5 in Gene Expression Profiling Interactive Analysis web server; D and E: Real-time quantitative polymerase chain reaction (RT-qPCR) (D) and western blot (E) validated the expression of BCL-2 and BIRC5 was down-regulated in HUCCT1/UPB1-over-expression cells; F: Co-immunoprecipitation (Co-IP) experiment confirmed the interaction of UPB1 with BCL-2 in HUCCT1 cells; G and H: Flow cytometry showed over-expression of UPB1 triggered G1/S blockade in HUCCT1 cells, while knockdown of UPB1 increased the percentage of S phase in QBC939 cells; I: Correlations of UPB1 expression with CDK2 and CCNA2 in Gene Expression Profiling Interactive Analysis web server; J and K: RT-qPCR (J) and western blot (K) validated UPB1 over-expression reduced the expression of CDK2 and CCNA2 in HUCCT1 cells; L: CO-IP experiment confirmed the interaction of UPB1 with CDK2 in HUCCT1 cells. OV: Over-expression; sh-NC: Short hairpin RNA negative control; shRNA: Short hairpin RNA; FITC: Fluorescein isothiocyanate; mRNA: Messenger RNA; TPM: Transcripts per million; GAPDH: Glyceraldehyde-3-phosphate dehydrogenase; IP: Immunoprecipitation; IgG: Immunoglobulin G.
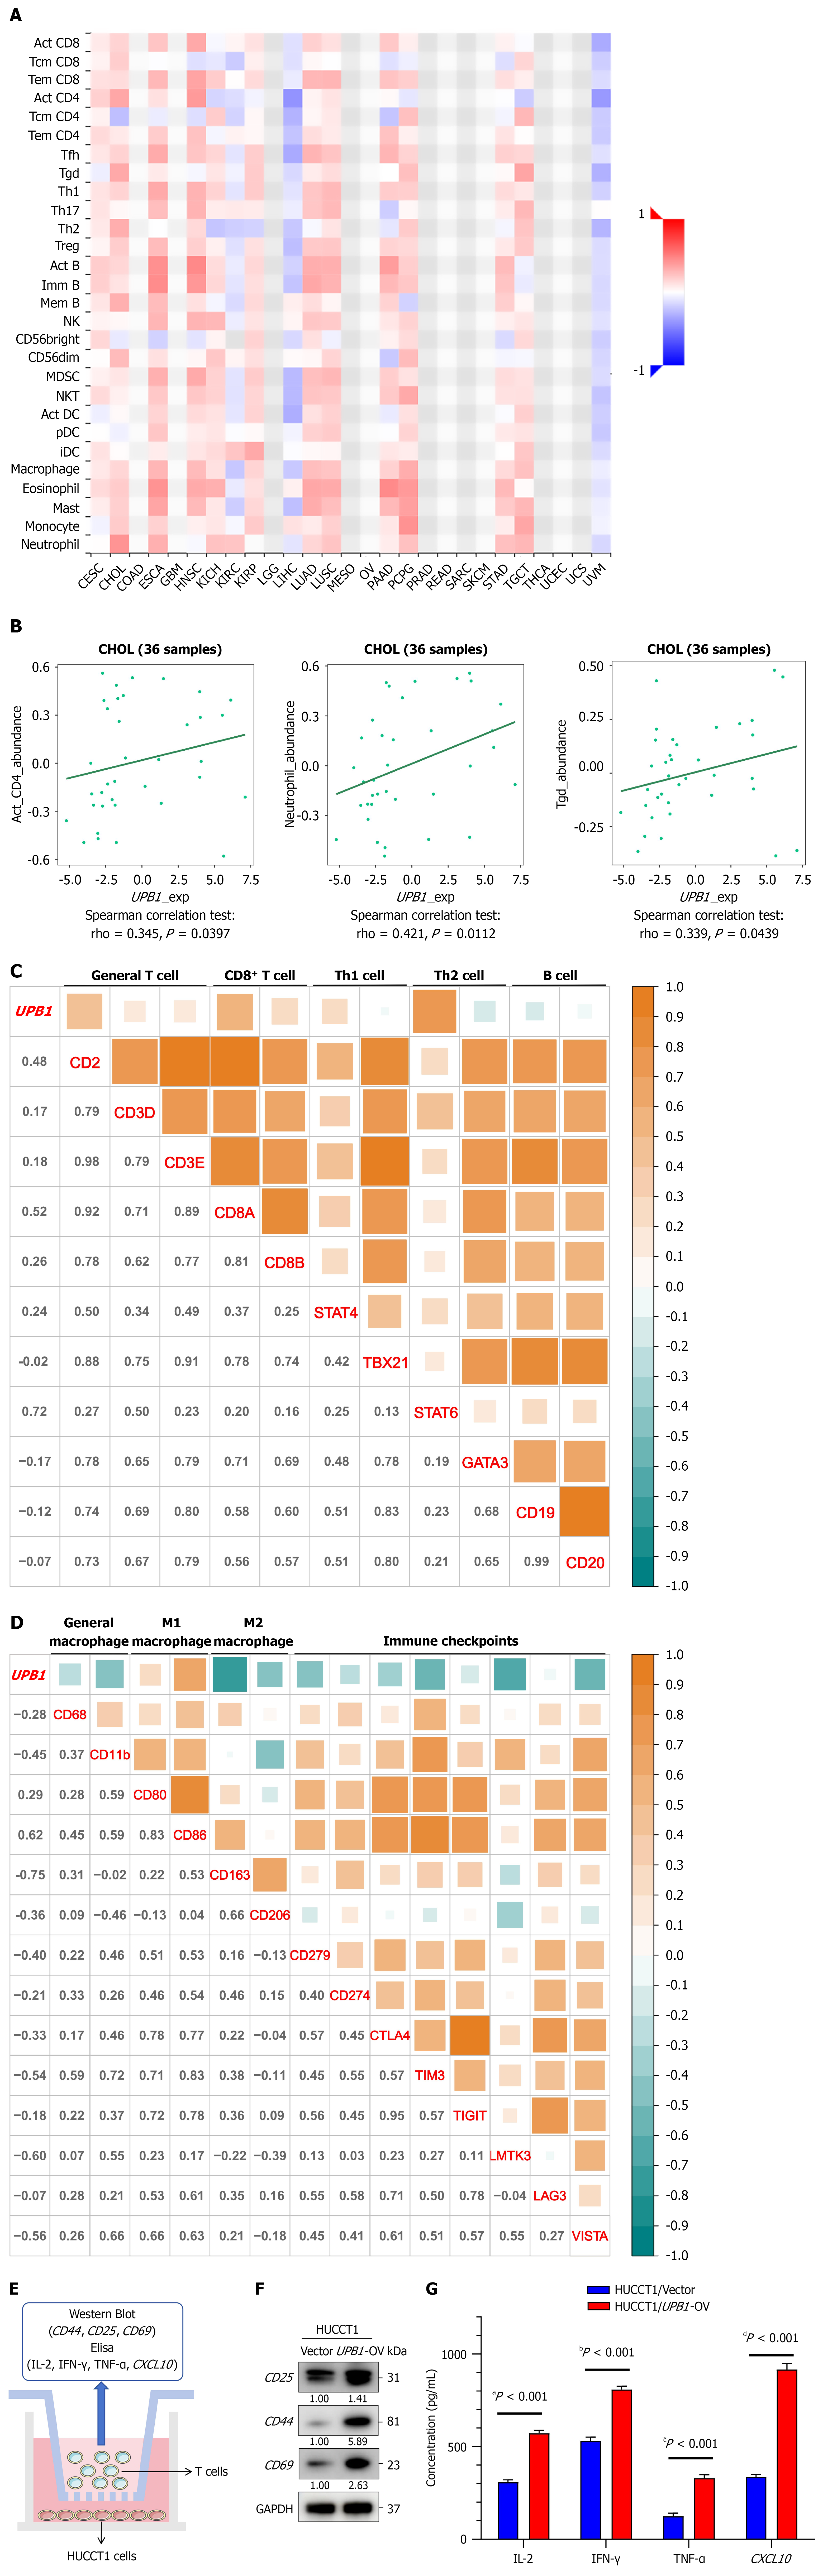
Figure 6 UPB1 participates in tumor immune infiltration of cholangiocarcinoma.
A: Correlations between UPB1 expression and tumor-infiltrating lymphocytes (TILs) in TISIDB web server; B: Top 3 TILs with greatest positive Spearman’s correlation with UPB1; C and D: Correlations between UPB1 expression and gene markers of TILs and other immune checkpoints; E: Example diagram for co-culture of HUCCT cells and T cells; F: Western blot analysis on the expressions of T cell activation markers, CD25, CD44 and CD69; G: Elisa assay on the levels of interleukin-2, interferon-γ, tumor necrosis factor-α and CXCL10. CD: Cluster of differentiation; Th: T helper; Treg: Regulatory T cells; NK: Natural killer; MDSC: Myeloid-derived suppressor cells; NKT: Natural killer T cells; DC: Dendritic cells; pDC: Plasmacytoid dendritic cells; iDC: Immature dendritic cells; CECS: Conventional endometrial carcinosarcoma; CHOL: Cholangiocarcinoma; COAD: Colon adenocarcinoma; ESCA: Esophageal carcinoma; GBM: Glioblastoma multiforme; HNSC: Head and neck squamous cell carcinoma; KICH: Kidney chromophobe; KIRC: Kidney renal clear cell carcinoma; KIRP: Kidney renal papillary cell carcinoma; LGG: Lower grade glioma; LIHC: Liver hepatocellular carcinoma; LUAD: Lung adenocarcinoma; MESO: Mesothelioma; OV: Ovarian serous cystadenocarcinoma; PAAD: Pancreatic adenocarcinoma; PCPG: Pheochromocytoma and paraganglioma; PRAD: Prostate adenocarcinoma; READ: Rectum adenocarcinoma; SARC: Sarcoma; SKCM: Skin cutaneous melanoma; STAD: Stomach adenocarcinoma; TGCT: Testicular germ cell tumor; THCA: Thyroid papillary carcinoma; UCEC: Uterine corpus endometrial carcinoma; UCS: Uterine carcinosarcoma; UVM: Uveal melanoma; OV: Over-expression; GAPDH: Glyceraldehyde-3-phosphate dehydrogenase; IL: Interleukin; IFN: Interferon; TNF: Tumor necrosis factor.
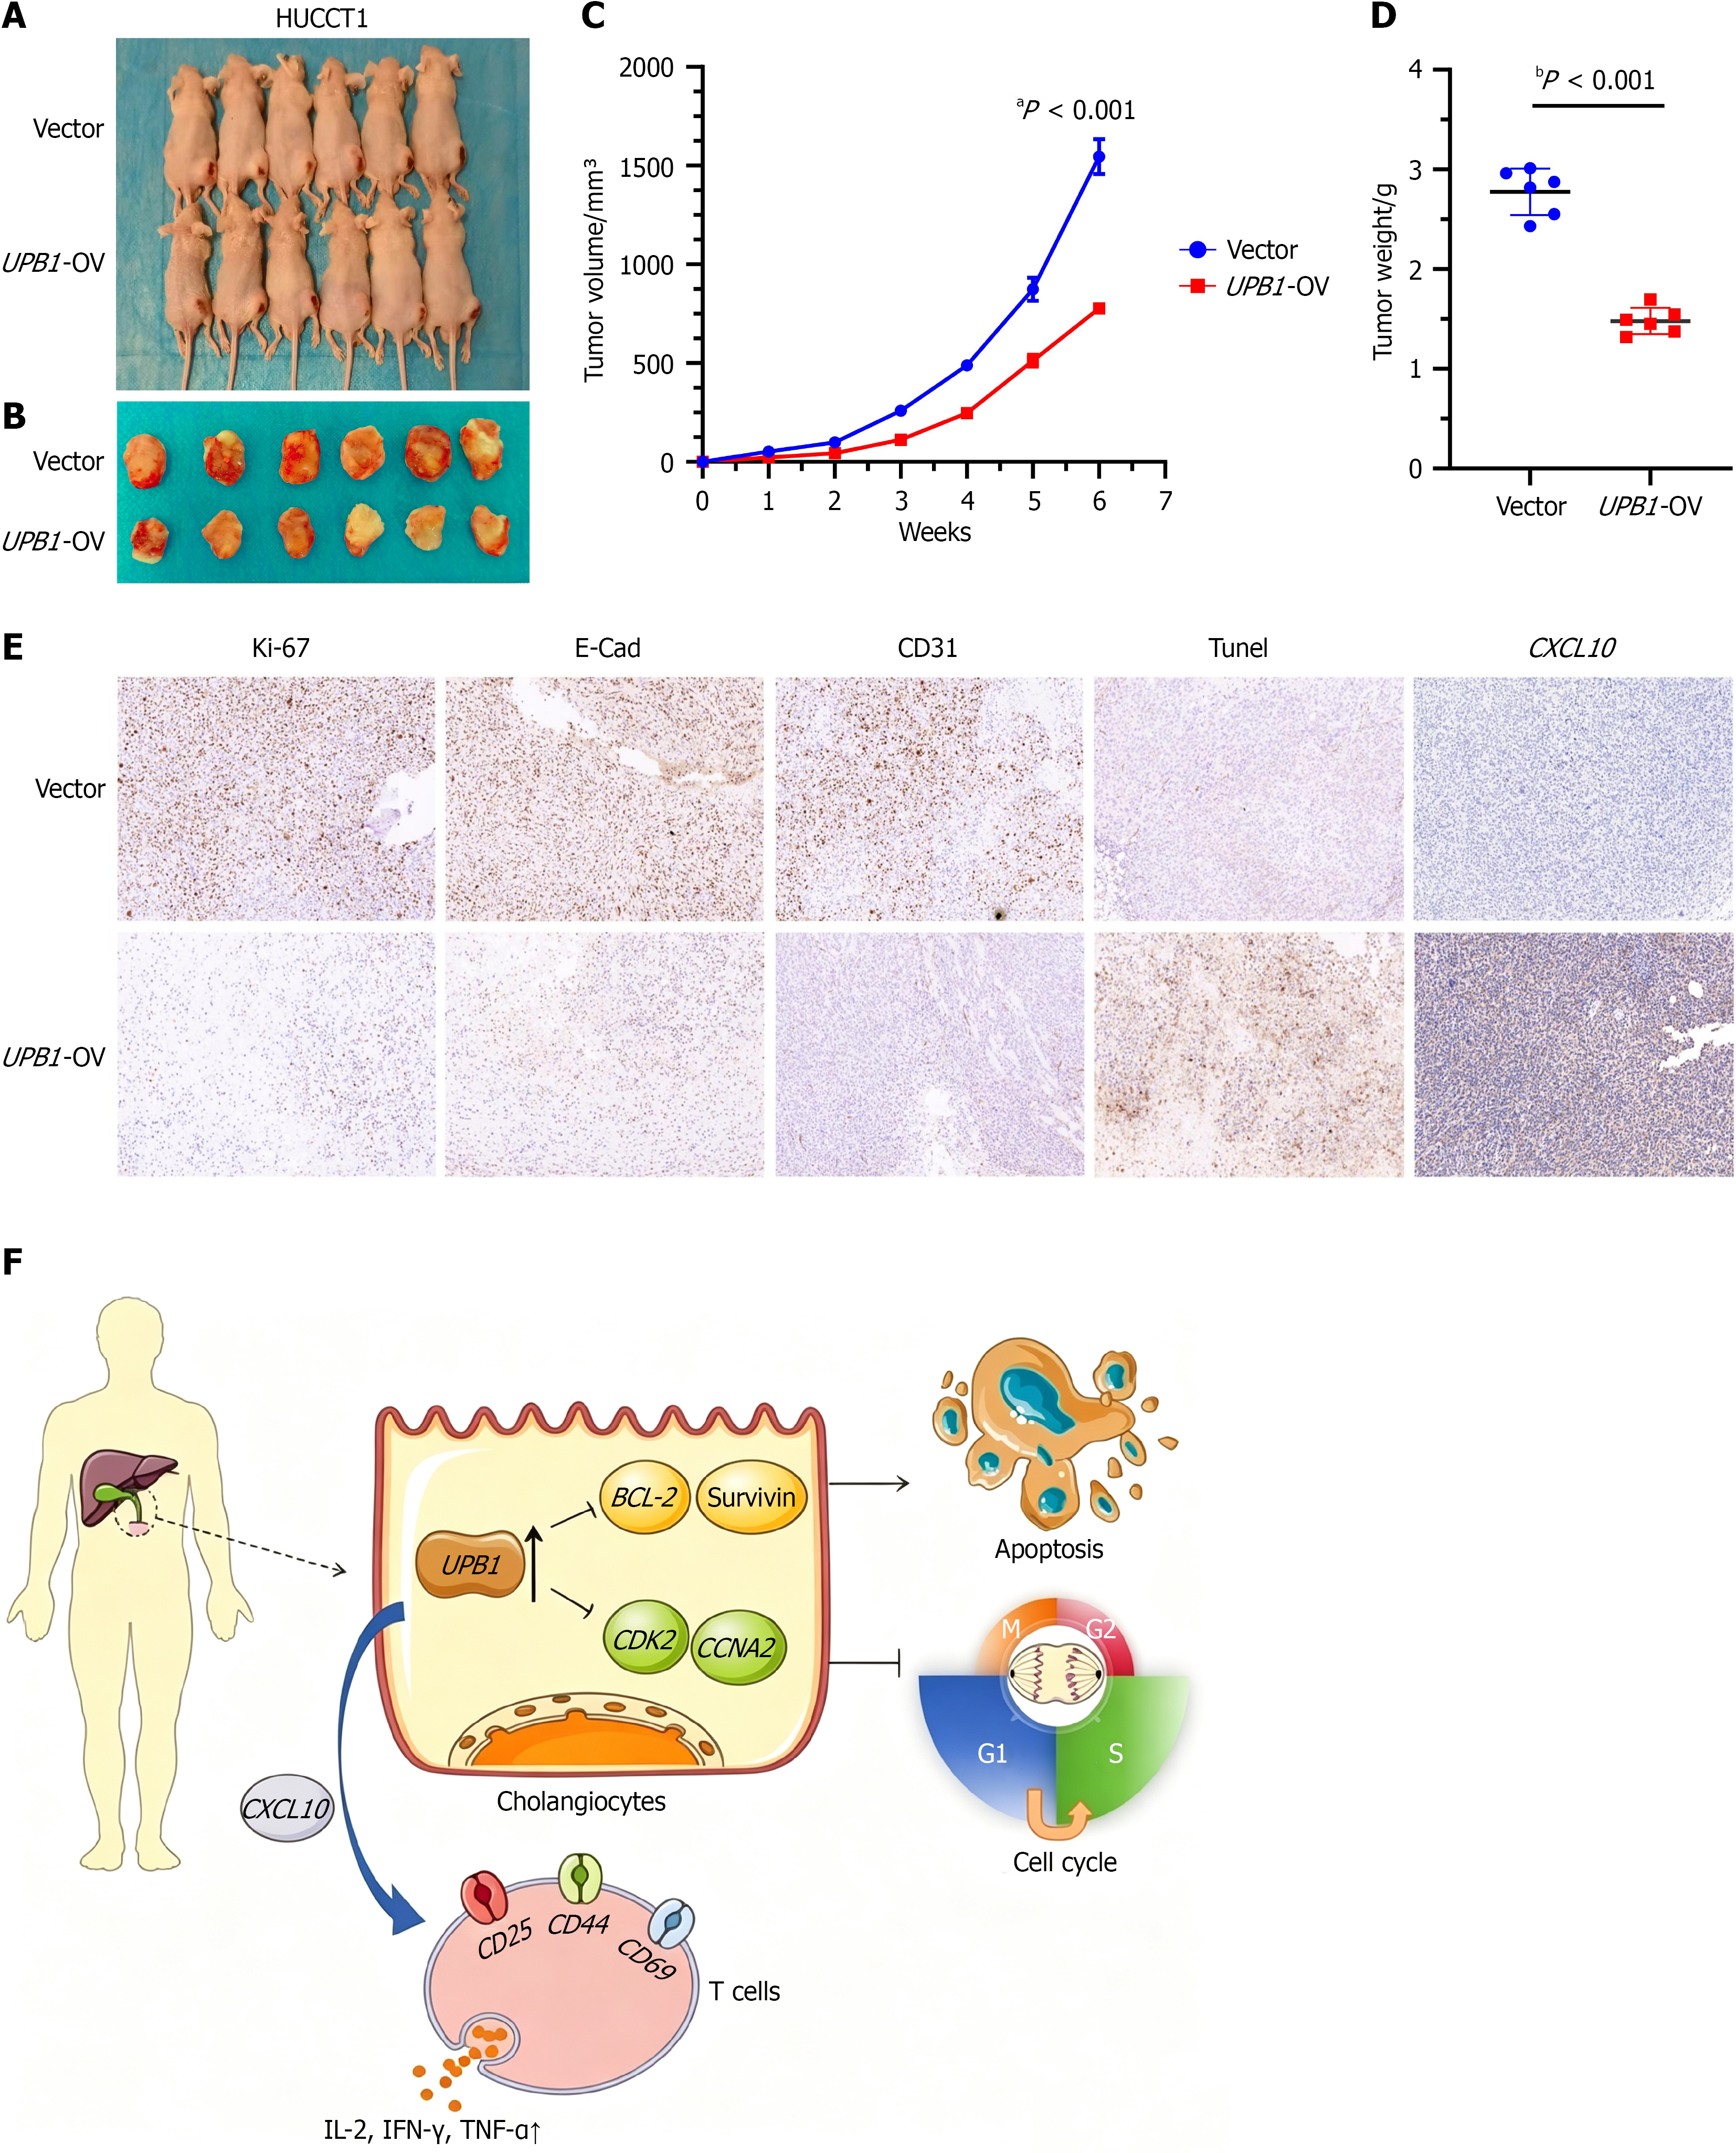
Figure 7 The overexpression of UPB1 moderately inhibits tumor growth in vivo.
A and B: BALB/c-nudes (n = 6 per group) were sacrificed 6 weeks after the injection and tumors dissected from respective groups were shown; C: Tumor growth curves after the injection of HUCCT1/UPB1-over-expression (OV) and control cells. Tumor volume was calculated every week; D: Tumor weight was measured in UPB1-OV and control groups; E: Immunohistochemistry staining of Ki67, E-Cadherin, TUNEL, cluster of differentiation 34, and CXCL10 in tumors from UPB1-OV and control groups; F: A schematic diagram integrated findings from in vitro and in vivo experiments, for a novel regulatory mechanism that UPB1 induced apoptosis by BCL-2/BIRC5 axis, caused G1/S phase arrest through CDK2/CCNA2 pathway and also contributed to tumor immune infiltration by enhancing T-cell activation and promoting the release of immune factors in cholangiocarcinoma. Scale bars: 200 μm. OV: Over-expression; CD: Cluster of differentiation; E-Cad: E-Cadherin; IL: Interleukin; IFN: Interferon; TNF: Tumor necrosis factor.
- Citation: Sun ZH, Zeng BC, Sun J, Li BL, Ma ZY. Identification of UPB1 as a tumor suppressor associated with immune infiltration in cholangiocarcinoma. World J Gastroenterol 2027; 33(1): 123490
- URL: https://www.wjgnet.com/1007-9327/full/v33/i1/123490.htm
- DOI: https://dx.doi.org/10.3748/wjg.123490