
















Copyright: ©Author(s) 2026.
World J Gastroenterol. Sep 28, 2026; 32(36): 121753
Published online Sep 28, 2026. doi: 10.3748/wjg.121753
Published online Sep 28, 2026. doi: 10.3748/wjg.121753
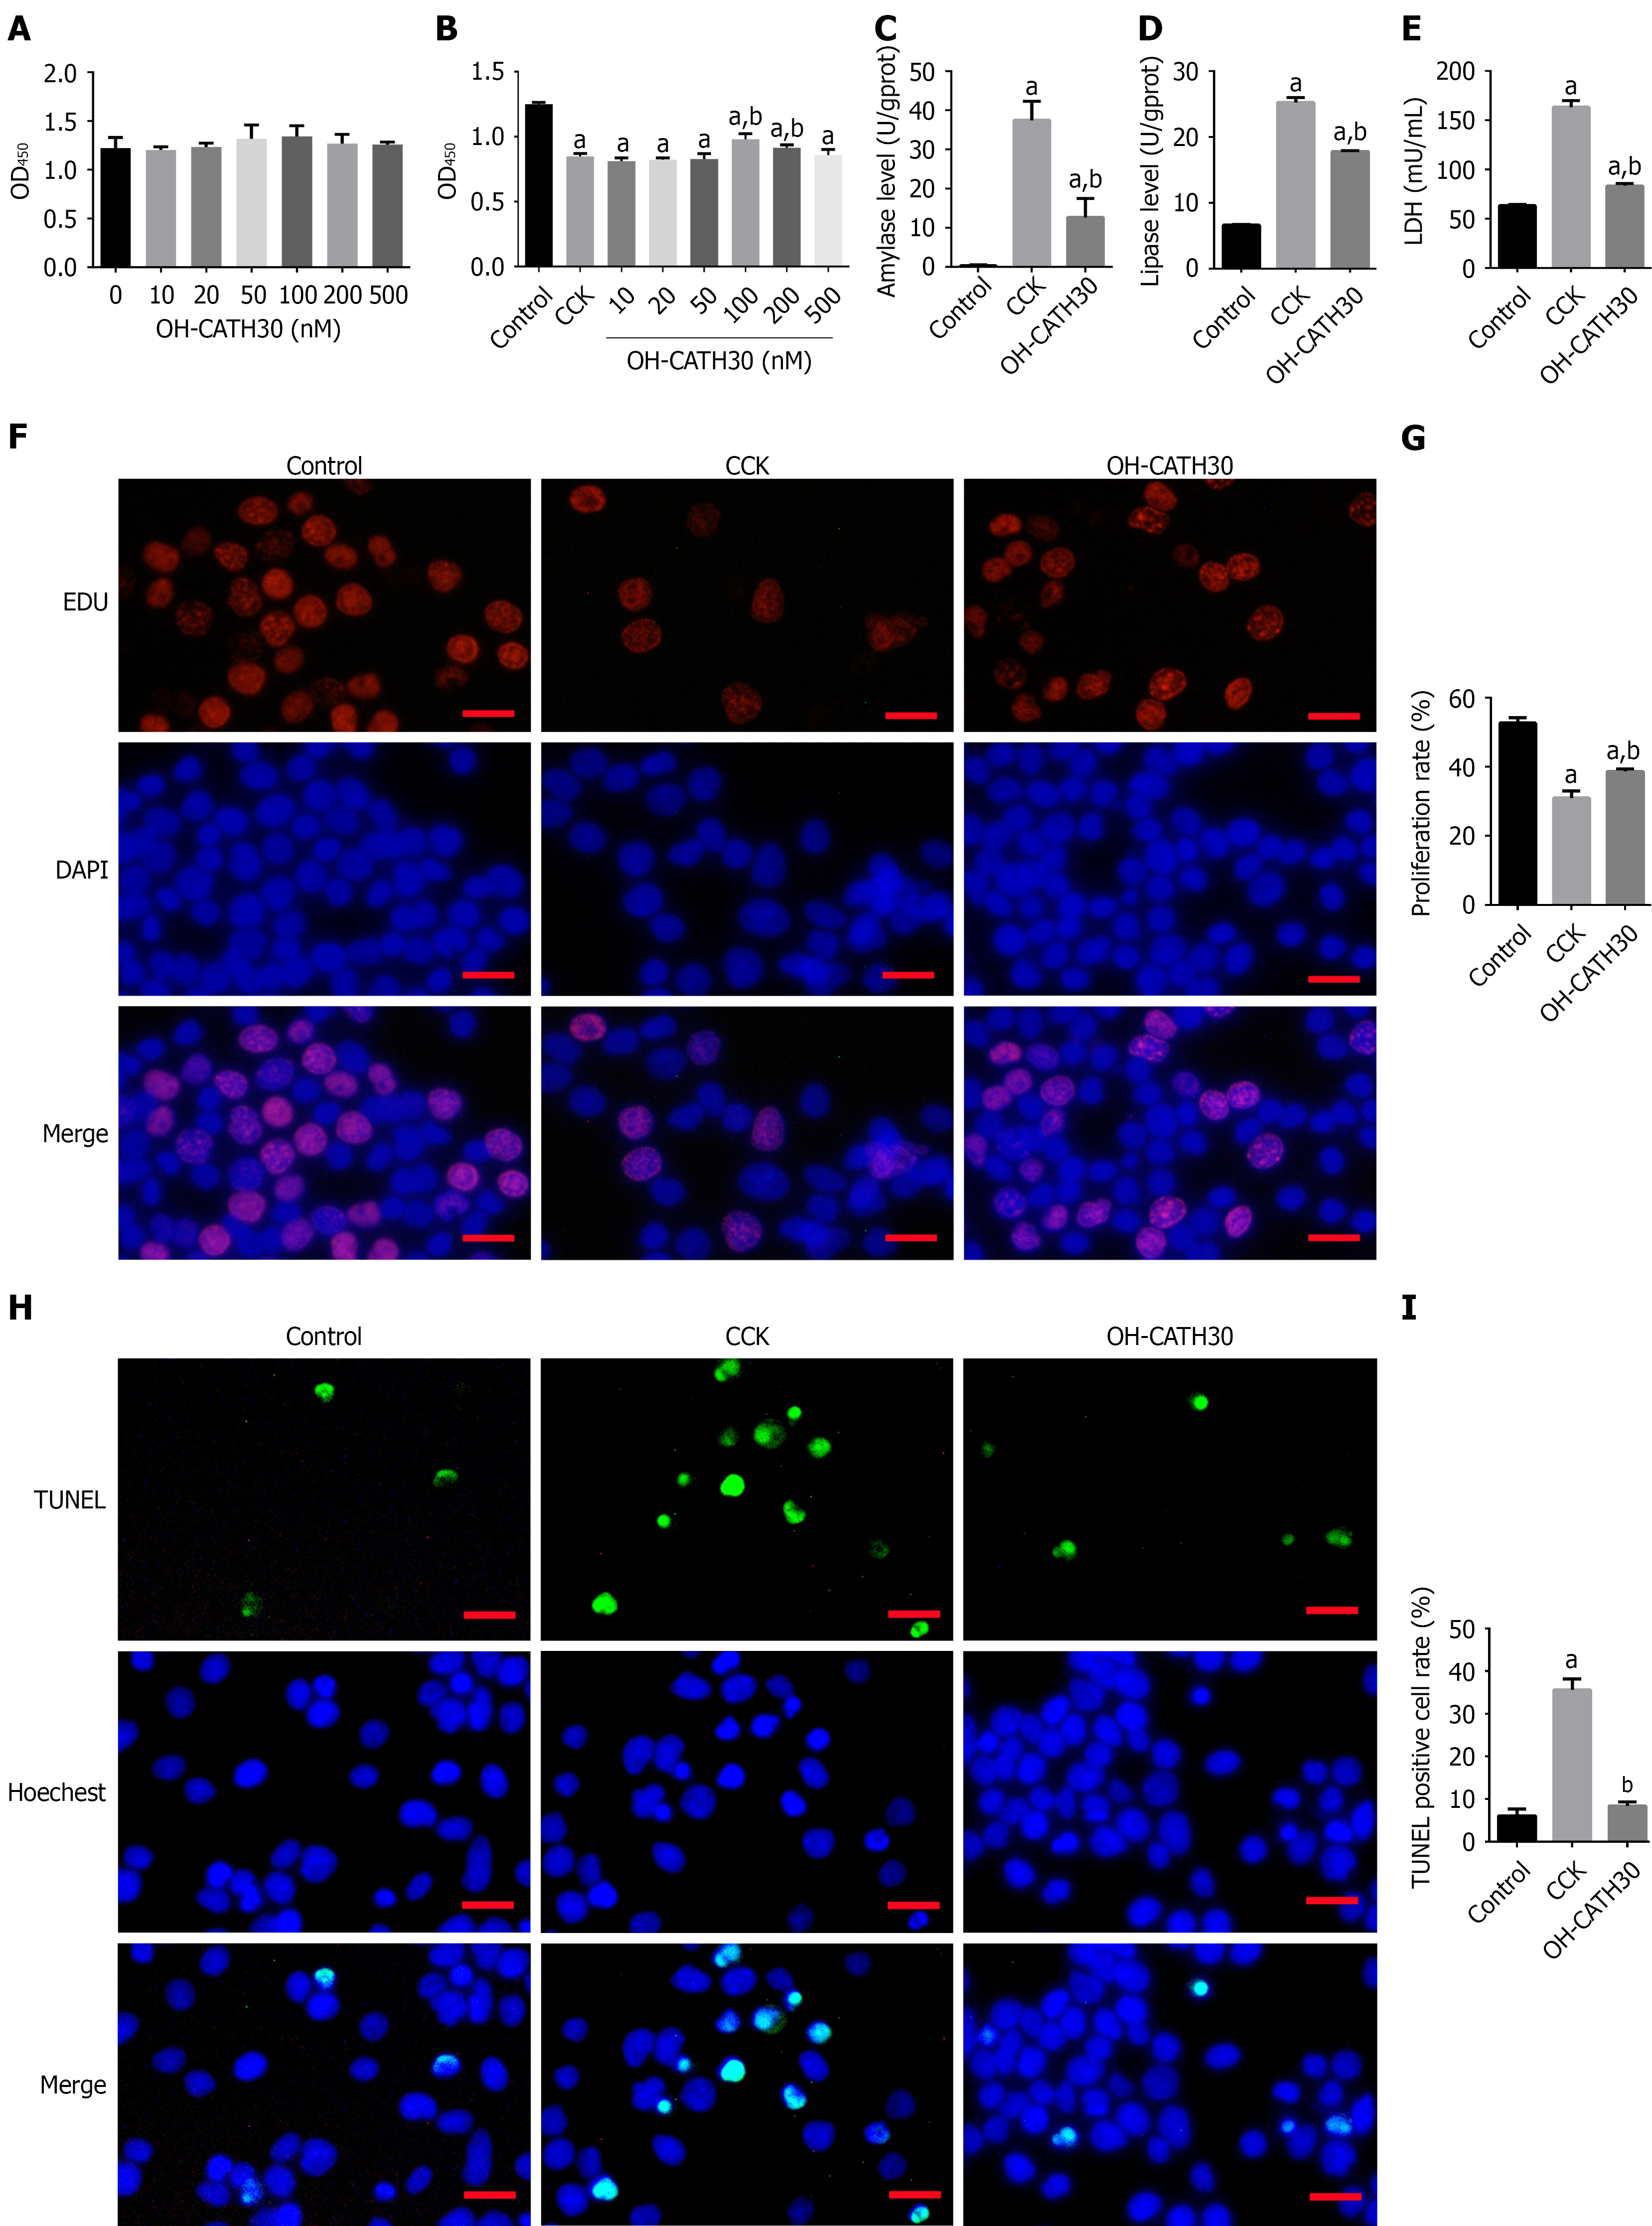
Figure 1 OH-CATH30 attenuates cholecystokinin-induced injury in pancreatic acinar cells (266-6).
A: Cell viability of 266-6 cells treated with increasing concentrations of OH-CATH30 (0-500 nM) for 24 hours, assessed using cell counting kit-8 assay; B: Cells were pretreated with 100 nM cholecystokinin (CCK) for 24 hours to induce injury, followed by treatment with OH-CATH30 at indicated concentrations. Cell viability was measured using cell counting kit-8 assay; C-E: Effects of 100 nM OH-CATH30 on cholecystokinin -injured 266-6 cells: (C) Amylase1 and (D) lipase levels in culture supernatants; (E) lactate dehydrogenase activity; F and G: Cell proliferation detected using EdU incorporation assay. Representative images (F) and quantification (G) show increased proliferation after OH-CATH30 treatment. Scale bar = 50 μm; H and I: Apoptosis detected using TUNEL staining. Representative images (H) and quantification (I) show reduced apoptosis following OH-CATH30 treatment. Scale bar = 50 μm. All data are presented as mean ± SD (n = 3 independent experiments). Statistical analysis was performed using one-way ANOVA followed by Tukey’s HSD post hoc test. aP < 0.05 vs control, bP < 0.05 vs cholecystokinin alone (0 nM OH-CATH30). CCK: Cholecystokinin; LDH: Lactate dehydrogenase.
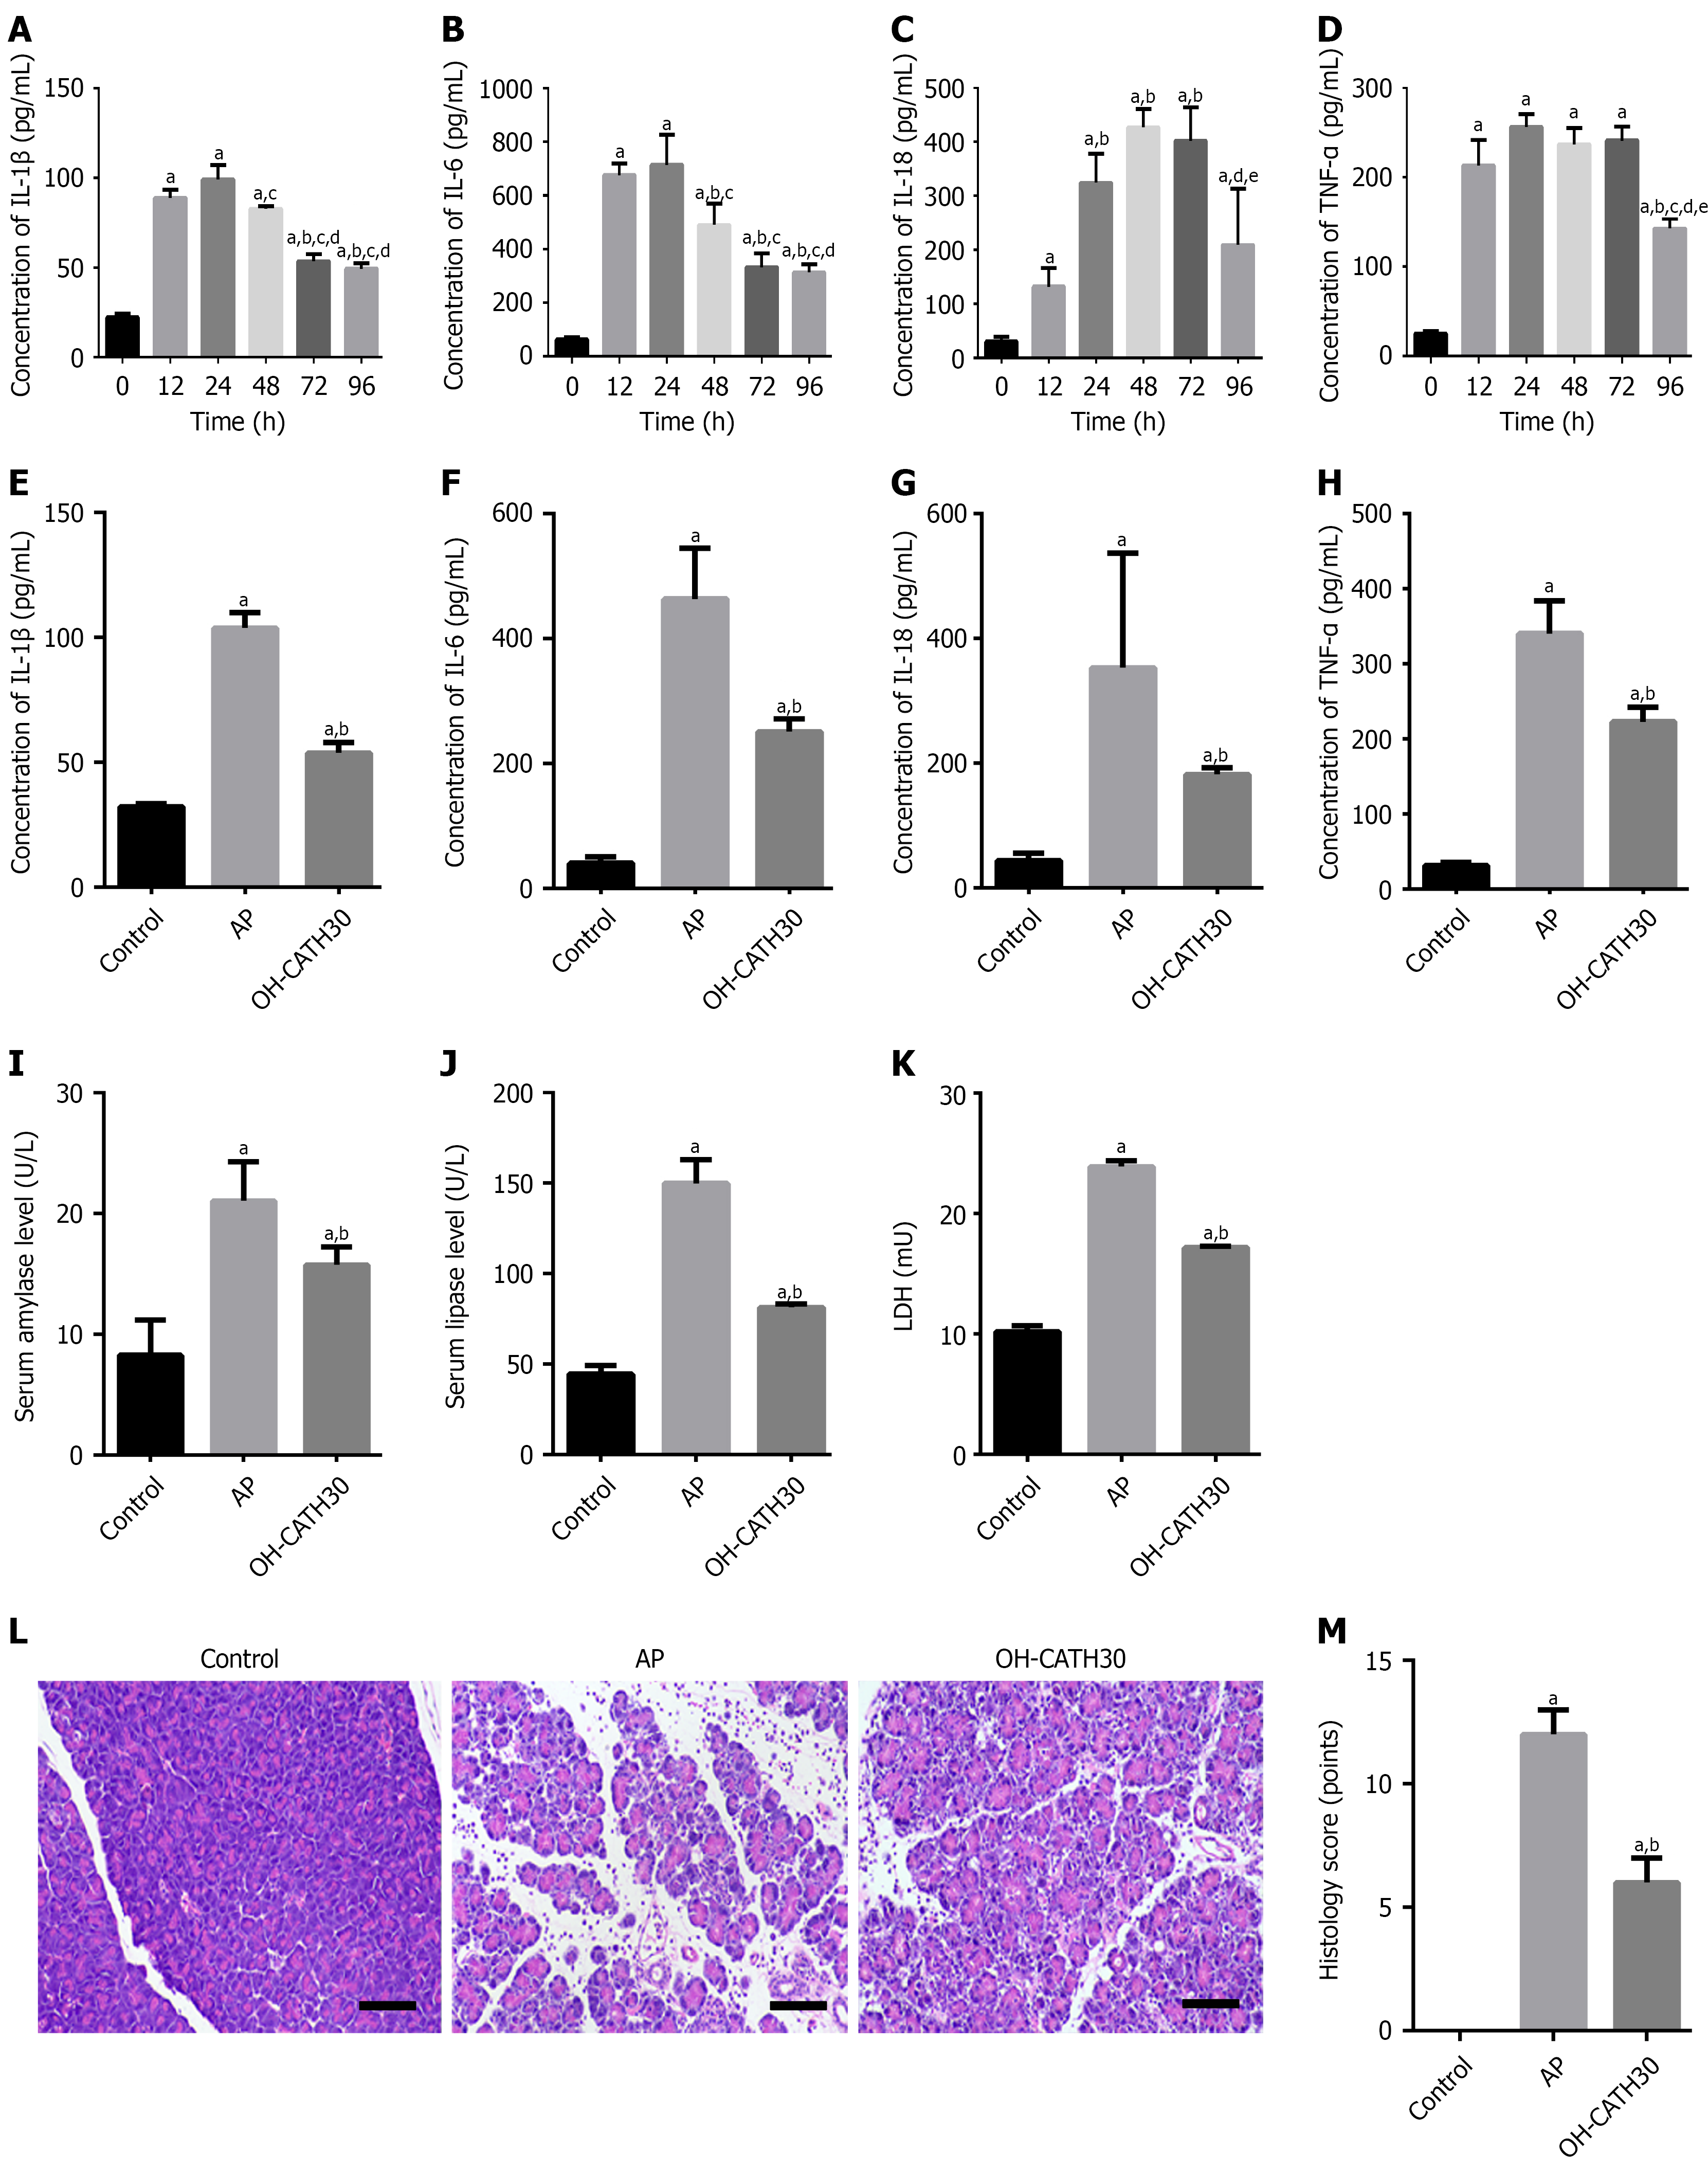
Figure 2 OH-CATH30 attenuates cerulein-induced acute pancreatitis in mice.
A-D: Time-course analysis of serum pro-inflammatory cytokines in cerulein-induced acute pancreatitis (AP) mice. Mice were euthanized at 0, 12, 24, 48, 72, and 96 hours after the last cerulein injection (n = 3 per time point). Serum levels of interleukin (IL)-1β (A), IL-6 (B), IL-18 (C), and tumor necrosis factor-α (D) were measured using ELISA. aP < 0.05 vs 0 hour, bP < 0.05 vs 12 hours, cP < 0.05 vs 24 hours, dP < 0.05 vs 48 hours, and eP < 0.05 vs 72 hours; E-M: Therapeutic effects of OH-CATH30 on AP mice. Mice were randomly assigned to three groups: Control (phosphate-buffered saline only), AP (10 hourly cerulein injections), and AP + OH-CATH30 (30 μg/kg i.p. every 12 hours for 3 days, starting immediately after sixth cerulein injection). Pancreatic tissues and serum were collected 24 hours after final cerulein injection. aP < 0.05 vs control, bP < 0.05 vs acute pancreatitis group. Serum levels of IL-1β, IL-6, IL-18, and tumor necrosis factor-α measured using ELISA (E-H); serum amylase and lipase activities (I and J); lactate dehydrogenase activity in pancreatic tissue homogenates (K); representative hematoxylin and eosin-stained pancreatic sections (L) and corresponding histological scores (M). Scale bar = 100 μm. All data are presented as mean ± SD (n = 6 mice/group). Statistical analysis was performed using one-way ANOVA followed by Tukey’s HSD post hoc test. IL: Interleukin; TNF-α: Tumor necrosis factor-α; AP: Acute pancreatitis; LDH: Lactate dehydrogenase.
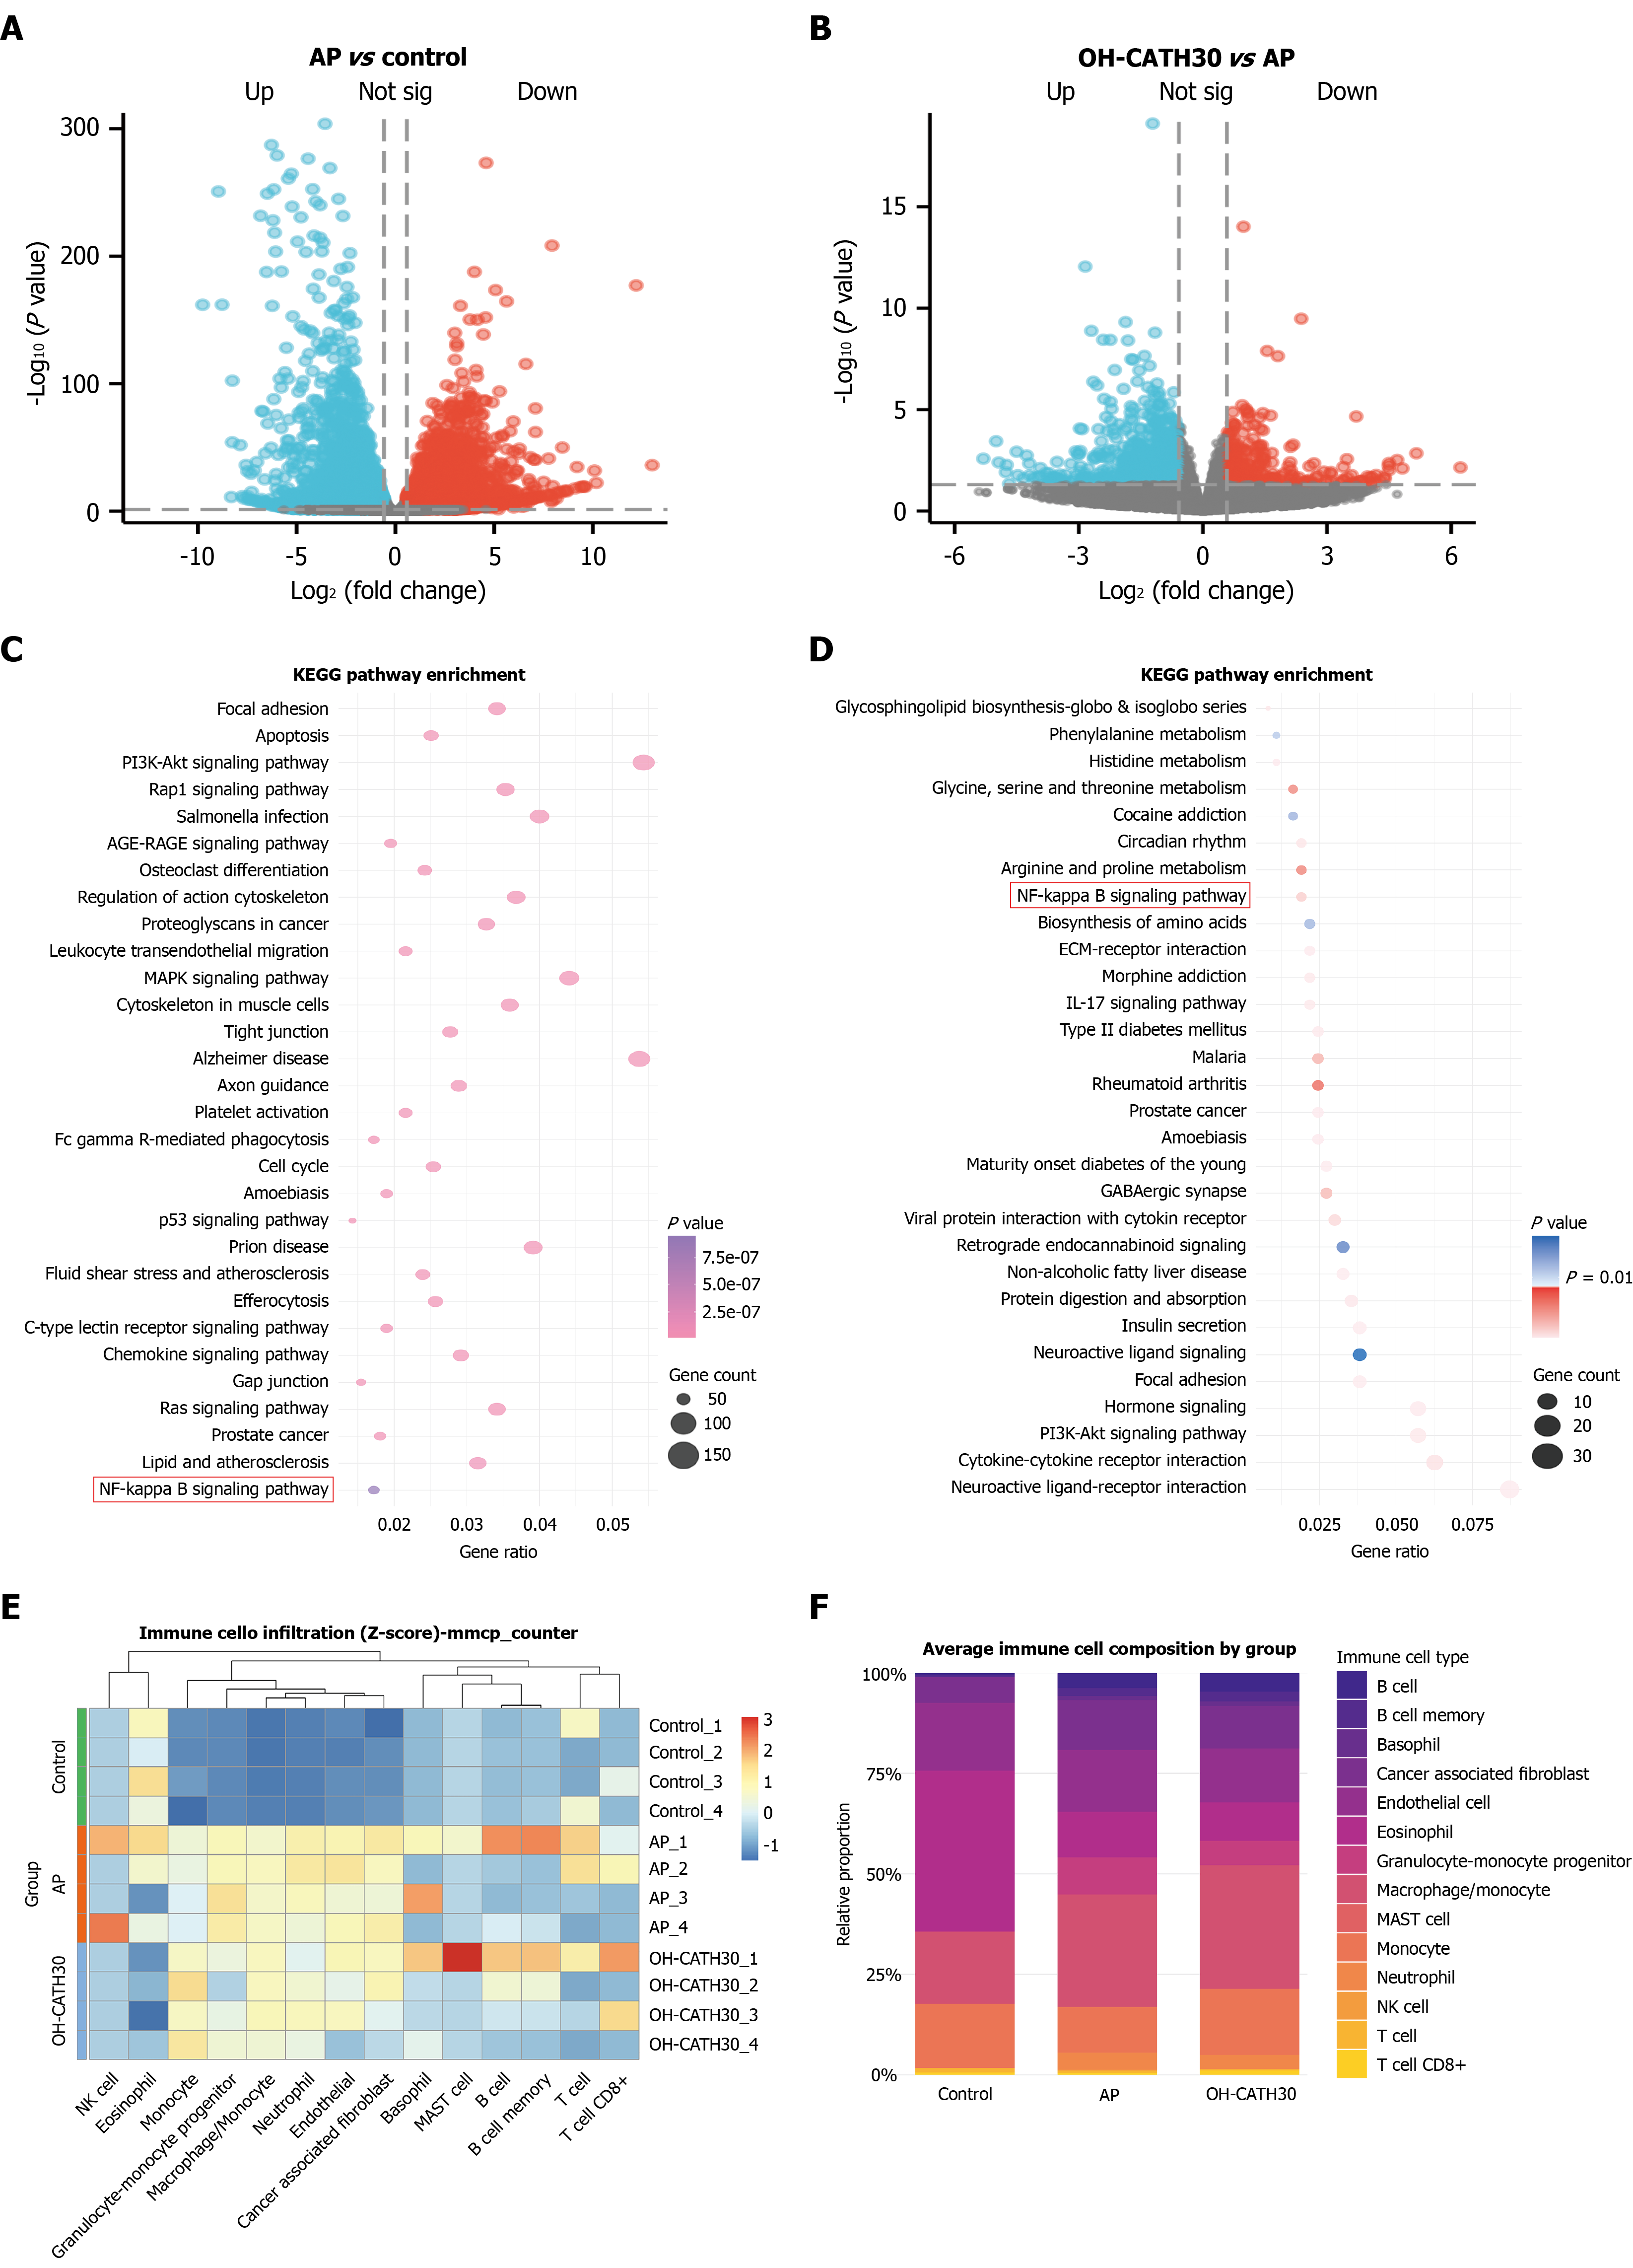
Figure 3 Transcriptomic profiling shows that OH-CATH30 modulates inflammatory signaling pathways in acute pancreatitis.
A and B: Volcano plots depicting differentially expressed genes in pancreatic tissues from (A) acute pancreatitis (AP) vs control and (B) OH-CATH30 vs AP comparisons. Red and blue dots represent significantly upregulated and downregulated genes, respectively (adjusted P ≤ 0.05, |log2(fold change)| ≥ 1). Gray dots indicate non-significant changes; C and D: Kyoto Encyclopedia of Genes and Genomes pathway enrichment analysis of differentially expressed genes; C: Top enriched pathways in AP vs control; D: Pathways significantly modulated by OH-CATH30 treatment; E: Heatmap showing relative abundance of infiltrating immune cell types in each sample, estimated using CIBERSORT algorithm; F: Bar plot depicting average immune cell composition in control, AP, and OH-CATH30-treated groups. All data are derived from transcriptomic sequencing of pancreatic tissues (n = 4 biological replicates per group). AP: Acute pancreatitis; KEGG: Kyoto Encyclopedia of Genes and Genomes.
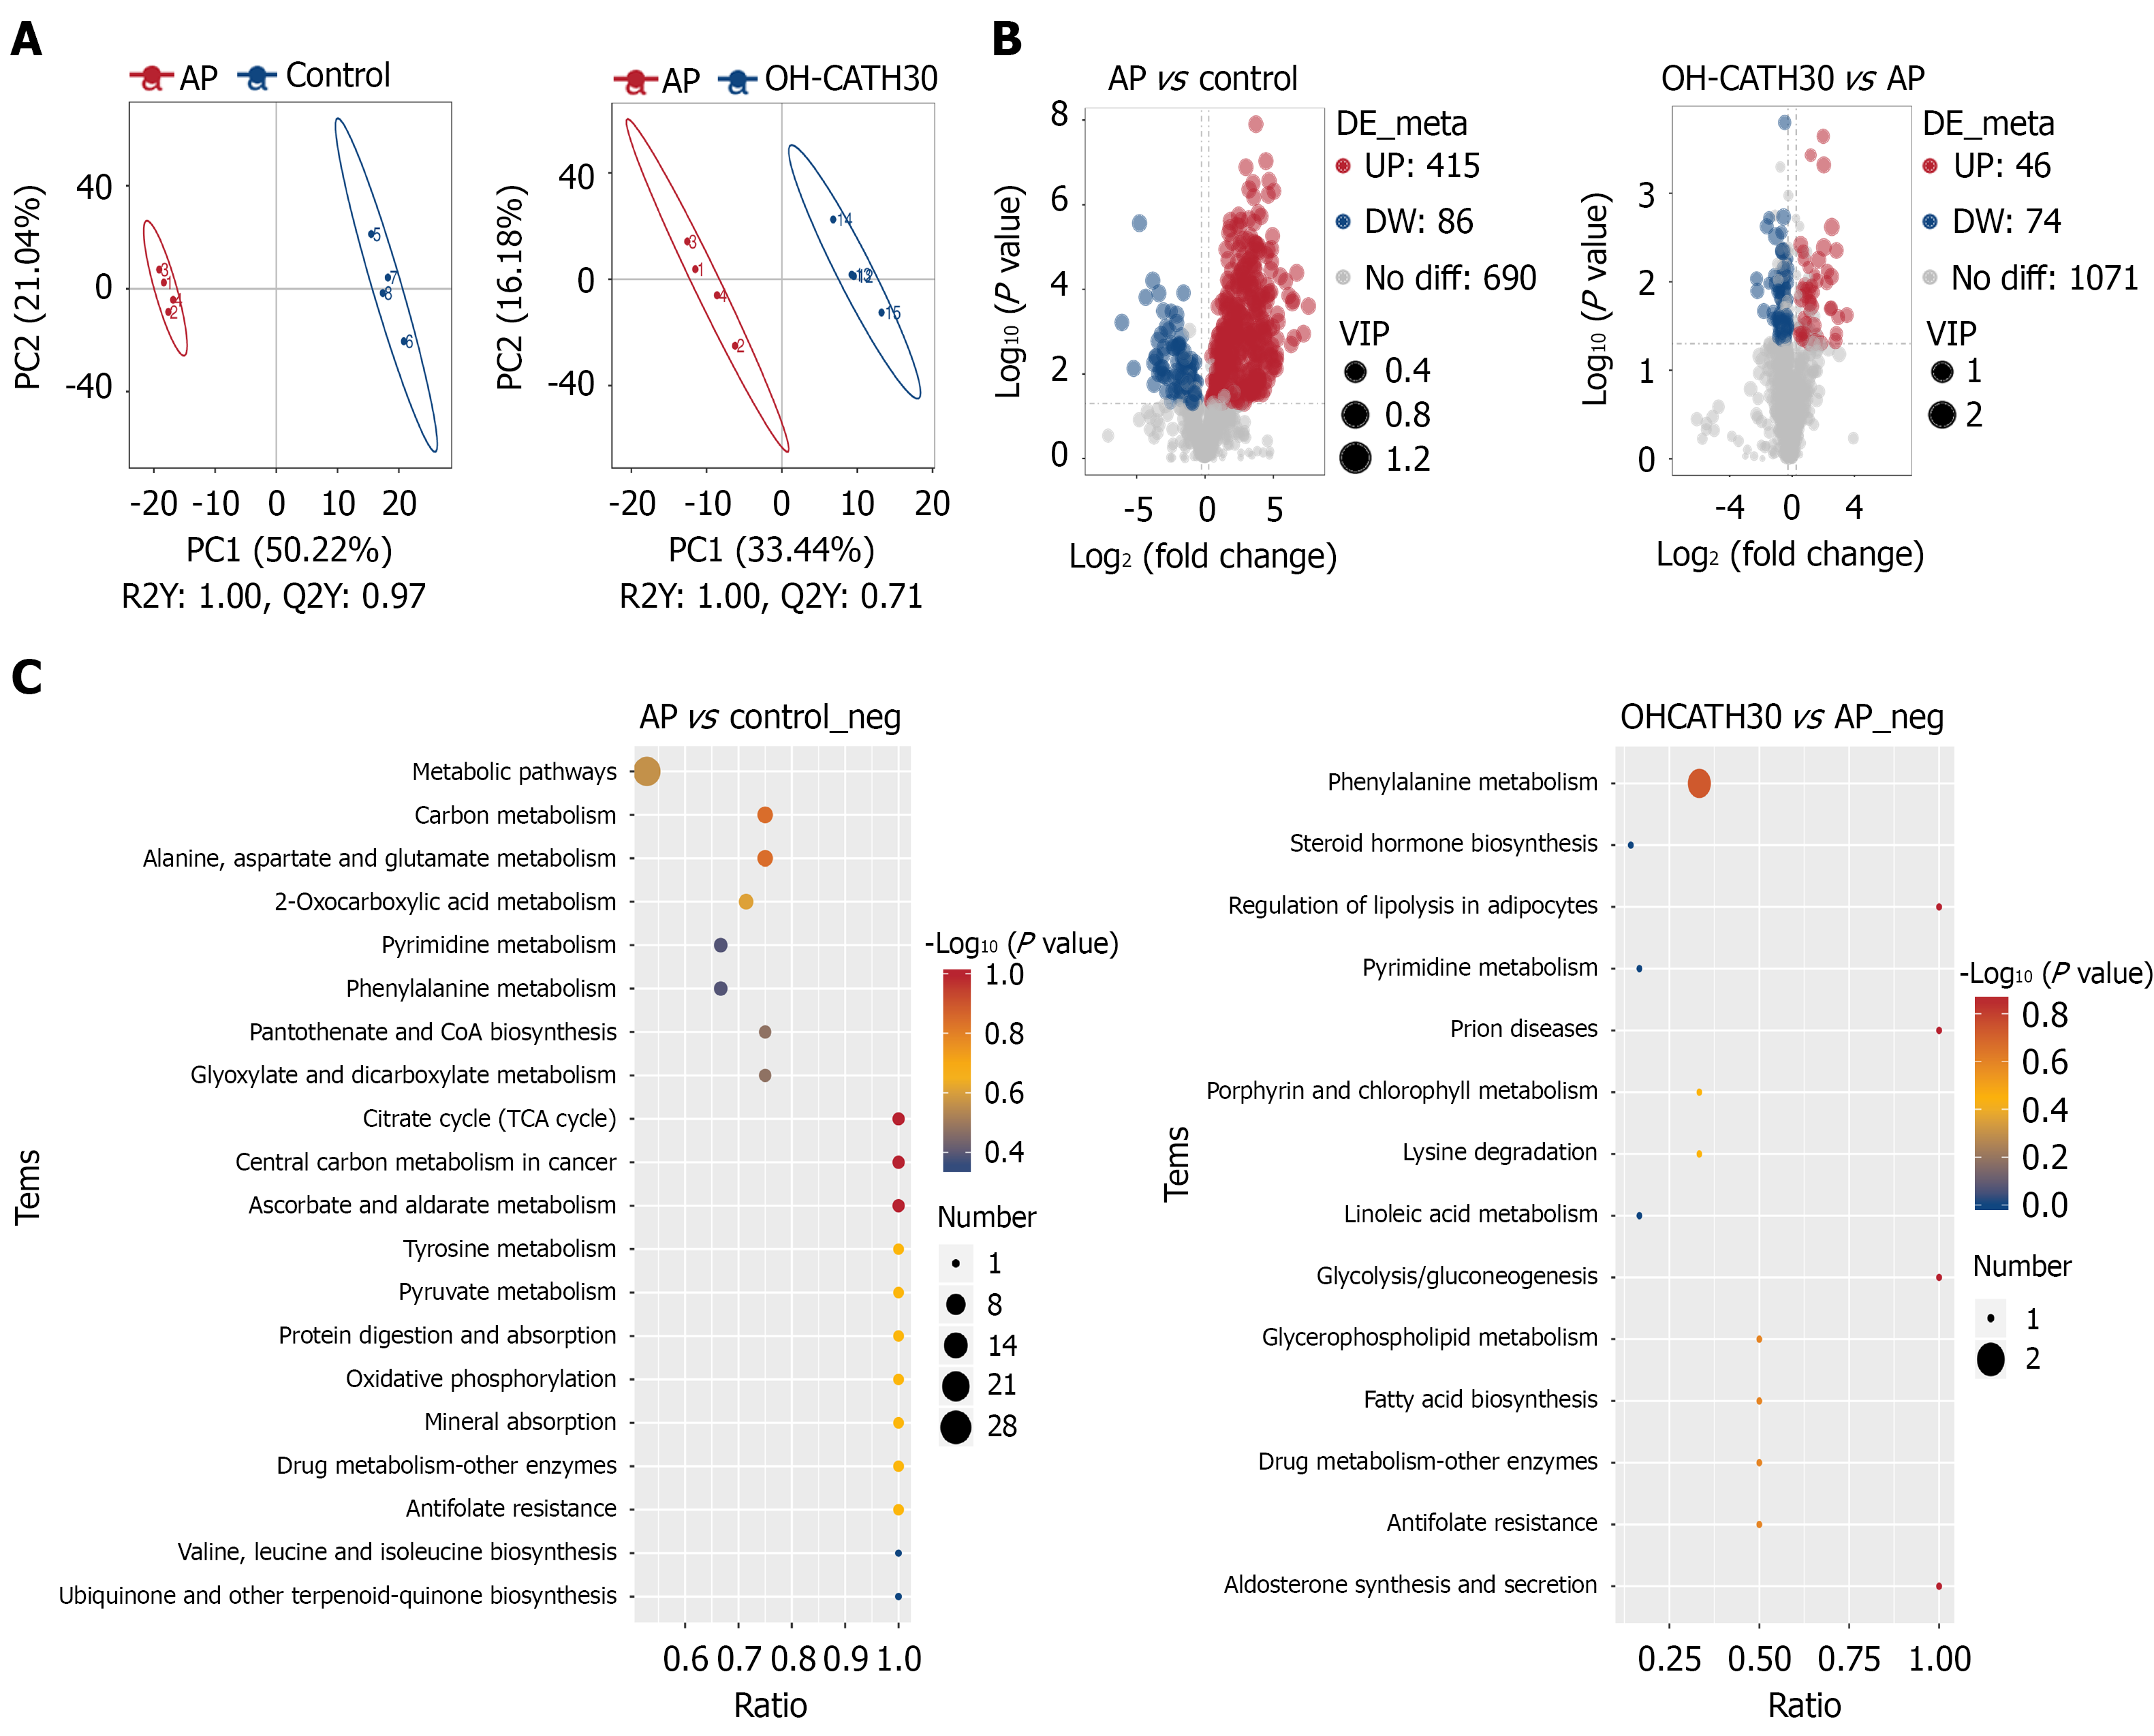
Figure 4 Metabolomic profiling identifies arachidonic acid metabolism as a key pathway modulated by OH-CATH30 in acute pancreatitis.
A: Principal component analysis score plot of pancreatic tissue metabolomes from control, acute pancreatitis (AP), and OH-CATH30-treated groups. Clear separation among groups indicates significant metabolic alterations induced by AP and partial restoration by OH-CATH30; B: Volcano plot displaying differentially abundant metabolites in AP vs control comparison. Each point represents a metabolite; red and blue dots indicate significantly upregulated and downregulated metabolites, respectively (variable importance in projection > 1, |log2(fold change)| ≥ 1, P < 0.05). Gray dots represent metabolites with no significant change; C: Kyoto Encyclopedia of Genes and Genomes pathway enrichment analysis of metabolites showed significant reversal after OH-CATH30 treatment. Bubble size represents the number of metabolites enriched in each pathway, and color indicates the significance level (P value). Arachidonic acid metabolism was identified as the most significantly modulated pathway. All data are derived from untargeted metabolomic analysis of pancreatic tissues (n = 4 biological replicates per group). AP: Acute pancreatitis; VIP: Variable importance in projection.
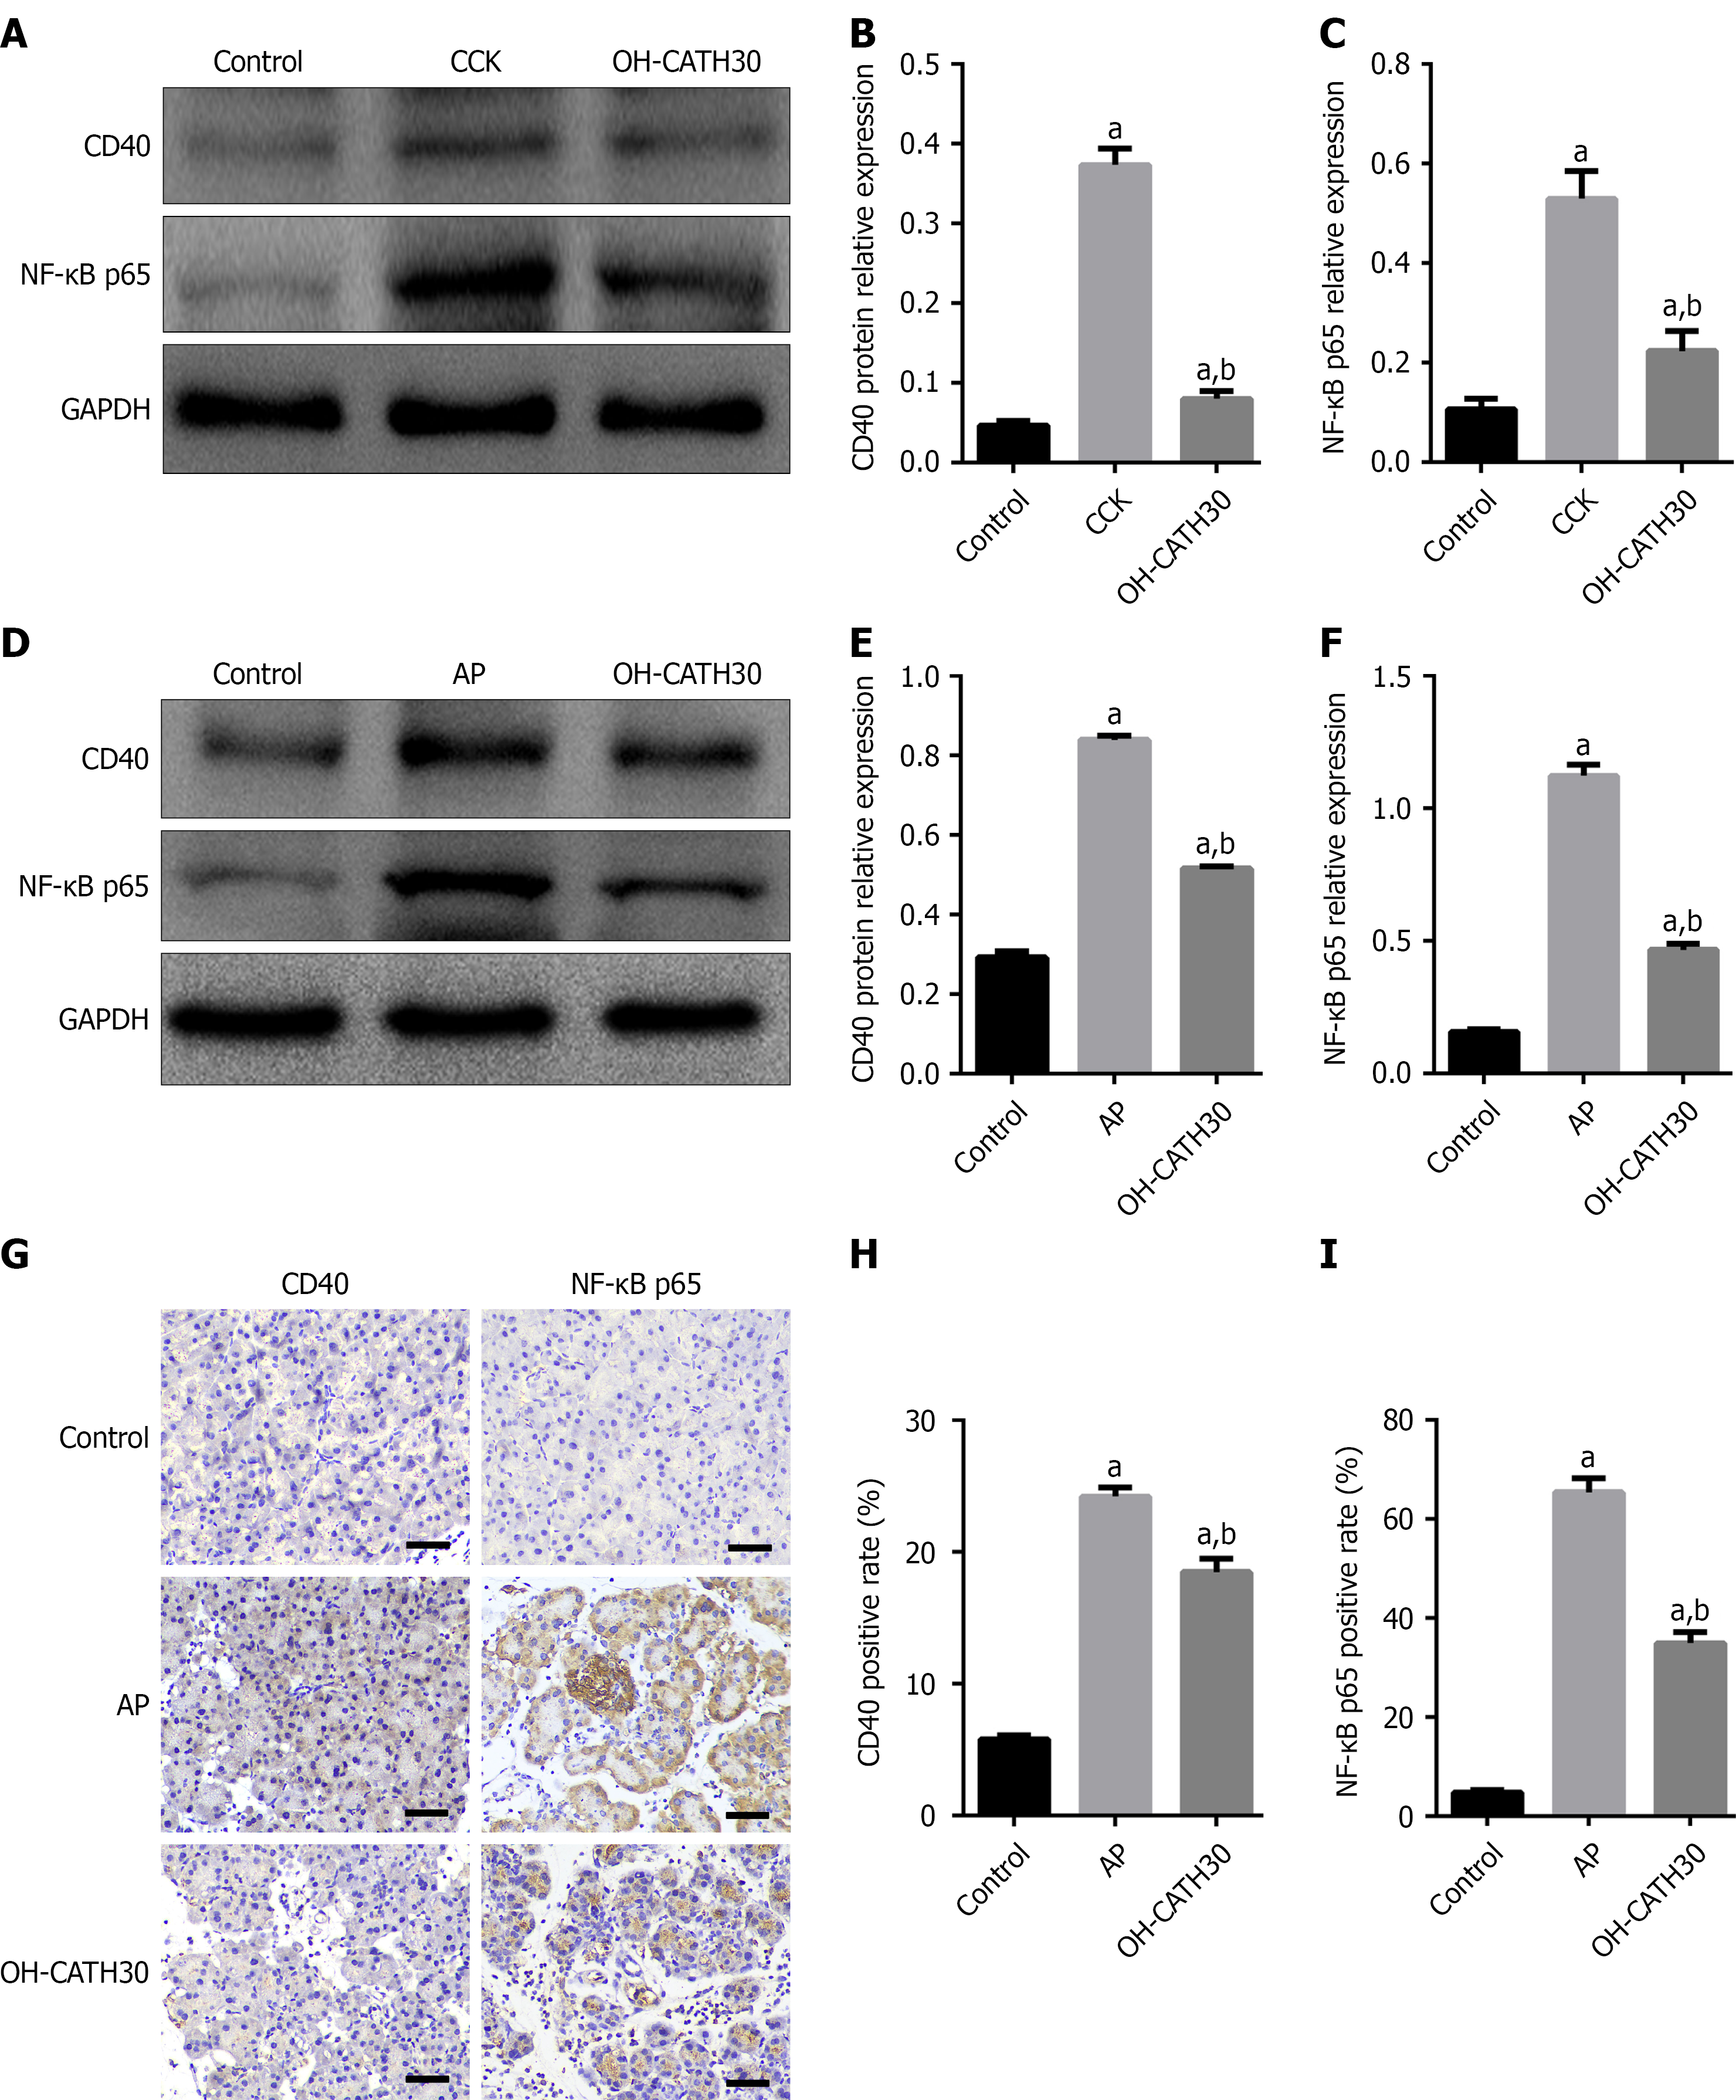
Figure 5 OH-CATH30 inhibits CD40 expression and nuclear factor-kappa B activation in pancreatic acinar cells and acute pancreatitis mice.
A-C: Western blotting analysis of CD40 and nuclear factor-kappa B (NF-κB) p65 protein expression in 266-6 cells. Representative immunoblots(A); densitometric quantification of CD40 (B) and NF-κB p65 (C) normalized to that of glyceraldehyde-3-phosphate dehydrogenase. Cells were treated with control, cholecystokinin (100 nM), or cholecystokinin + OH-CATH30 (100 nM); D-F: Western blotting analysis of CD40 and NF-κB p65 protein expression in mouse pancreatic tissues. Representative immunoblots(D); quantitative analysis of CD40 (E) and NF-κB p65 (F) protein levels normalized to that of glyceraldehyde-3-phosphate dehydrogenase. Mice were assigned to control, acute pancreatitis, or acute pancreatitis + OH-CATH30 (30 μg/kg) groups; G-I: Immunohistochemical staining of CD40 and NF-κB p65 in pancreatic tissue sections. Representative images showing CD40 and NF-κB p65 expression (brown staining) (G); scale bar = 50 μm. Quantitative analysis of integrated optical density for CD40 (H) and NF-κB p65 (I) staining. All data are presented as mean ± SD [n = 3 independent experiments (A-C) or n = 6 mice per group (D-I)]. Statistical analysis was performed using one-way ANOVA followed by Tukey’s HSD post hoc test. aP < 0.05 vs control, bP < 0.05 vs cholecystokinin or acute pancreatitis group. NF-κB: Nuclear factor-kappa B; AP: Acute pancreatitis; CCK: Cholecystokinin; GAPDH: Glyceraldehyde-3-phosphate dehydrogenase.
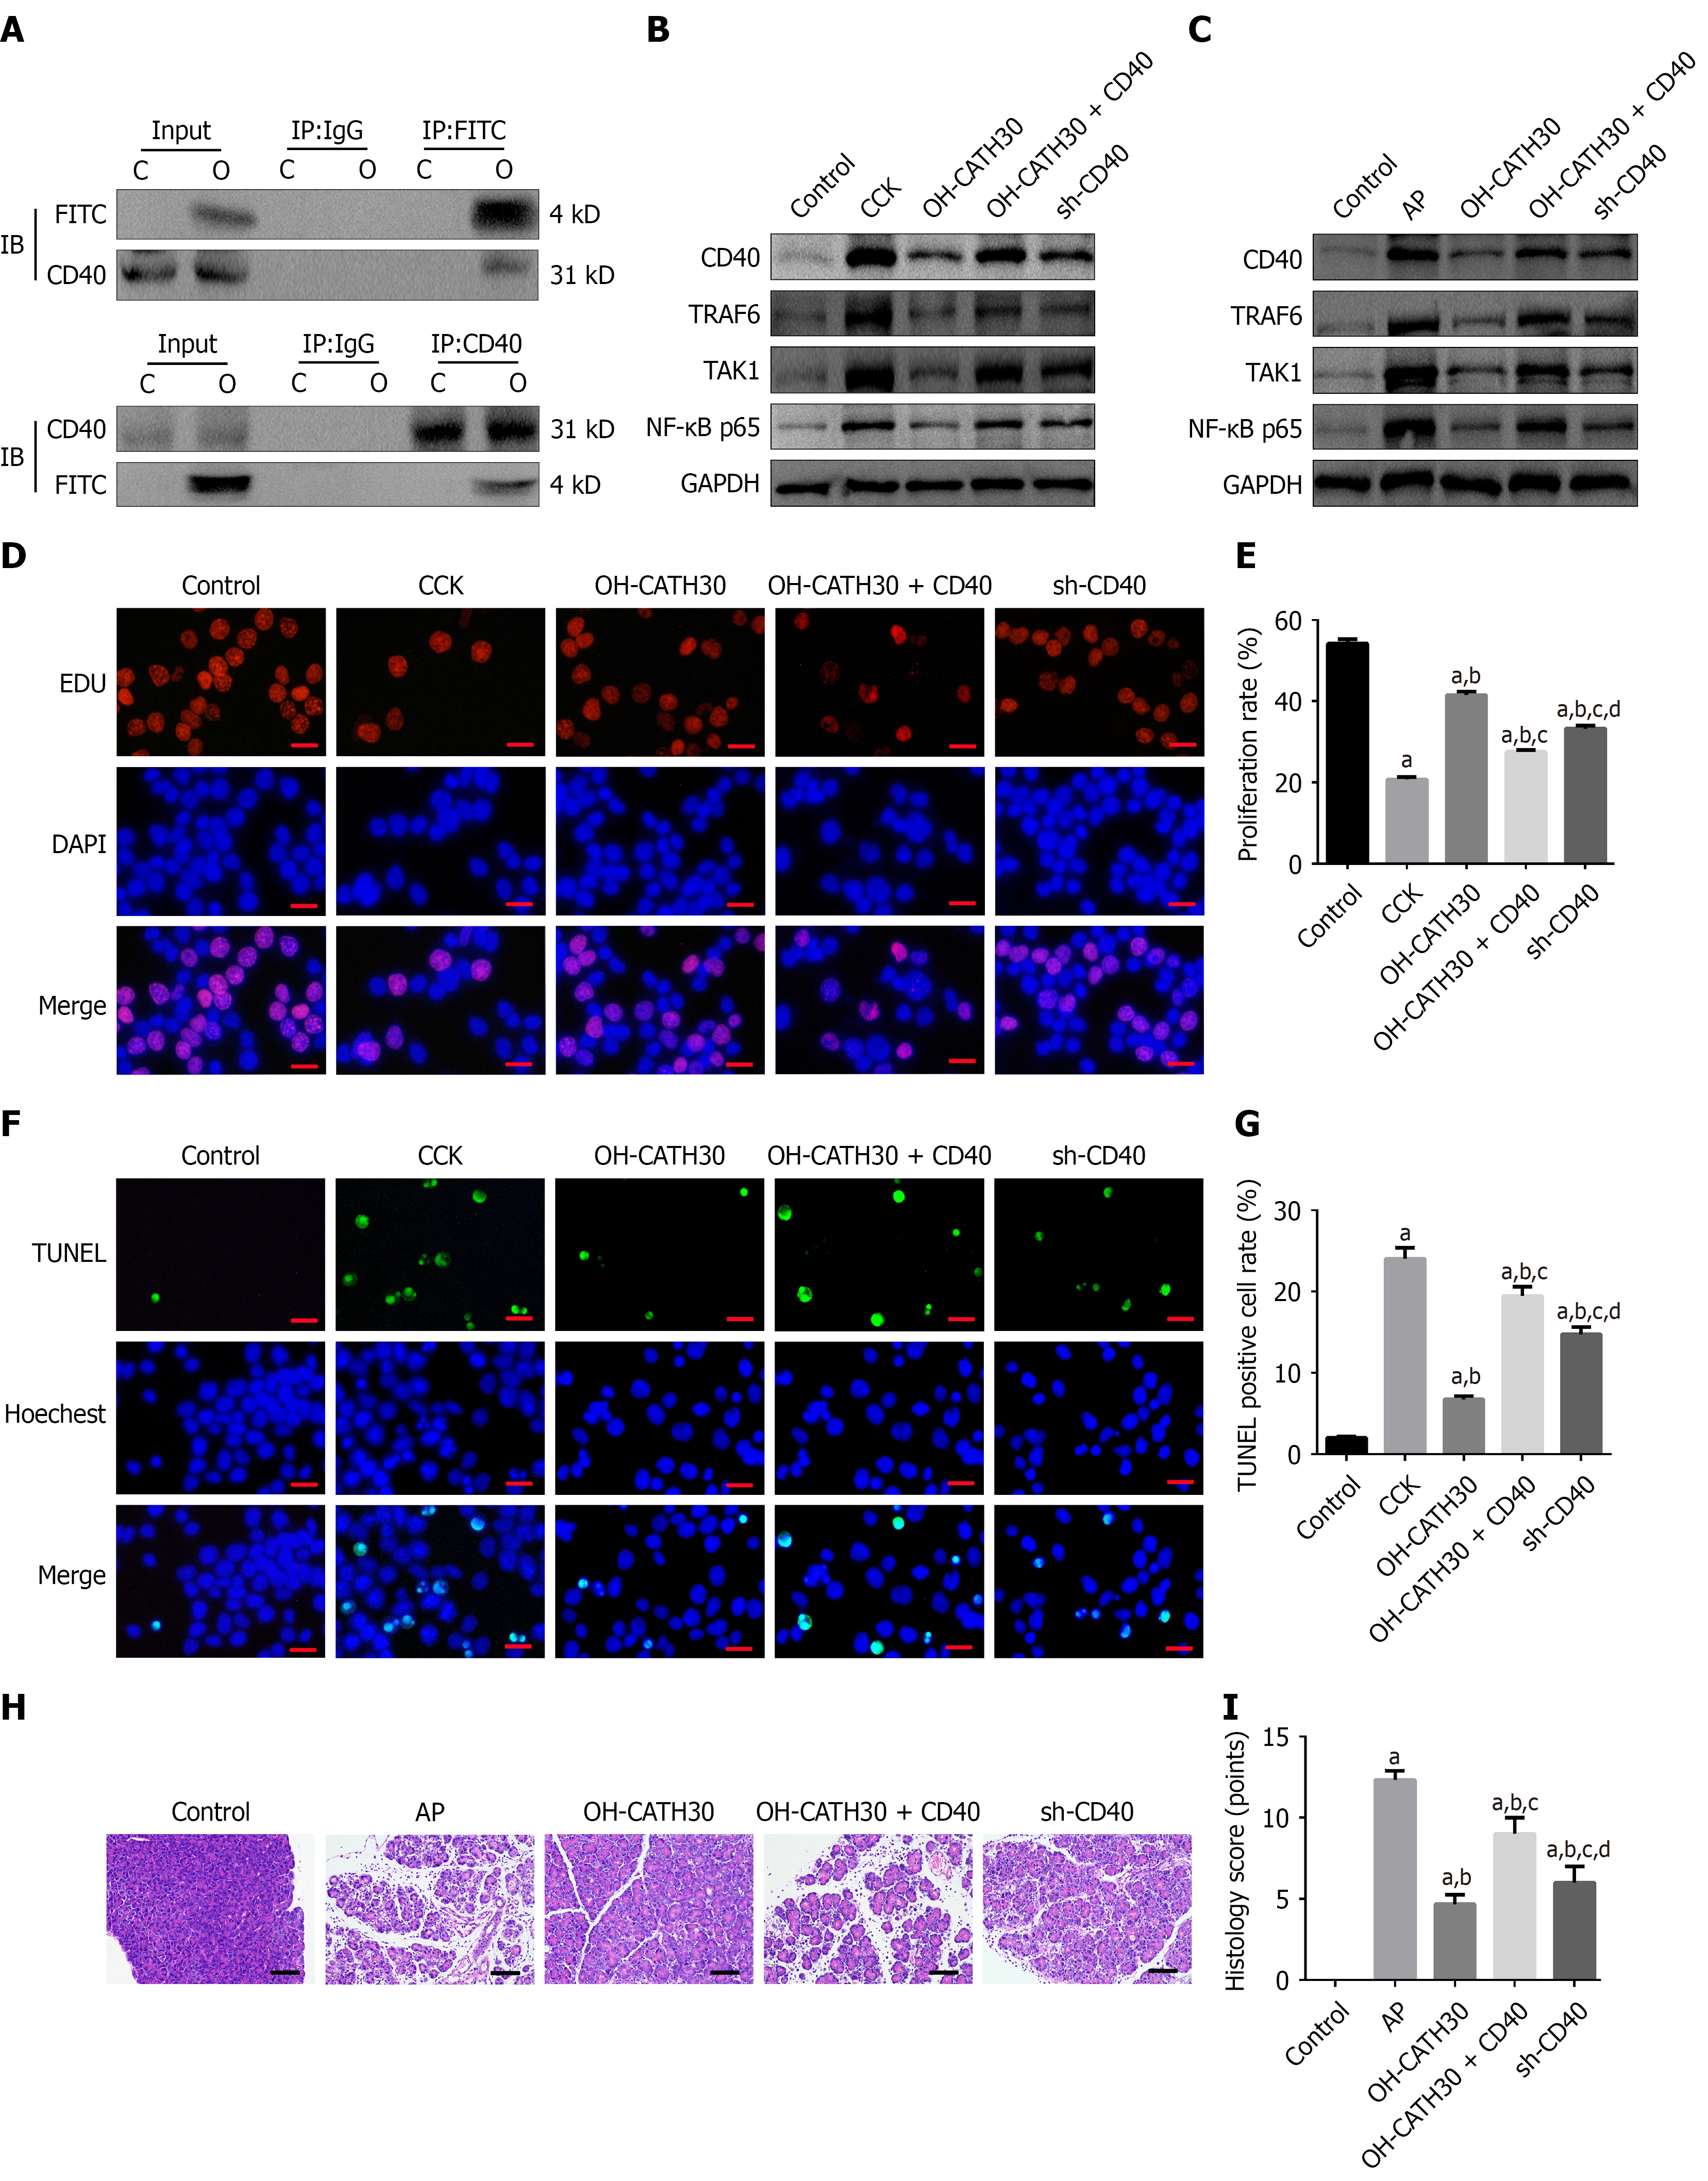
Figure 6 CD40 is a functional target of OH-CATH30: Validation of CD40-tumor necrosis factor receptor-associated factor 6-transforming growth factor beta-activated kinase 1-nuclear factor-kappa B axis.
A: Co-immunoprecipitation assay confirming binding between FITC-labeled OH-CATH30 and CD40 protein. Cell lysates were immunoprecipitated with anti-FITC antibody or control IgG, followed by immunoblotting with anti-CD40 antibody; B: Western blotting analysis of CD40 pathway proteins (CD40, tumor necrosis factor receptor-associated factor 6, transforming growth factor beta-activated kinase 1, nuclear factor-kappa B p65) in 266-6 cells under indicated conditions: Control (untreated); cholecystokinin (CCK) (100 nM CCK for 24 hours); OH-CATH30 (100 nM OH-CATH30 after CCK injury); OH-CATH30 + CD40 (LV-CD40 transfection prior to CCK injury and OH-CATH30 treatment); sh-CD40 (LV-sh-CD40 knockdown prior to CCK injury). Glyceraldehyde-3-phosphate dehydrogenase functioned as loading control; C: Western blotting analysis of CD40 pathway proteins in mouse pancreatic tissues from indicated groups: Control (phosphate-buffered saline only); acute pancreatitis (AP) (cerulein-induced); OH-CATH30 (30 μg/kg after AP induction); OH-CATH30 + CD40 (AAV-CD40 tail vein injection prior to AP induction and OH-CATH30 treatment); sh-CD40 (AAV-sh-CD40 injection prior to AP induction without OH-CATH30 treatment); D and E: Representative images (D) and quantification (E) of EdU incorporation assay to assess cell proliferation in 266-6 cells. Scale bar = 50 μm; F and G: Representative images (F) and quantification (G) of TUNEL staining to detect apoptosis in 266-6 cells. Scale bar = 50 μm; H and I: Representative hematoxylin and eosin-stained pancreatic sections (H) and corresponding histological scores (I) from mice. Scale bar = 100 μm. All data are presented as mean ± SD [n = 3 independent experiments (A-G) or n = 6 mice per group (H and I)]. Statistical analysis was performed using one-way ANOVA followed by Tukey’s HSD post hoc test. aP < 0.05 vs control, bP < 0.05 vs cholecystokinin or acute pancreatitis group, cP < 0.05 vs OH-CATH30 group, dP < 0.05 vs OH-CATH30 + CD40 group. TRAF6: Tumor necrosis factor receptor-associated factor 6; TAK1: Transforming growth factor beta-activated kinase 1; NF-κB: Nuclear factor-kappa B; CCK: Cholecystokinin; GAPDH: Glyceraldehyde-3-phosphate dehydrogenase; AP: Acute pancreatitis.
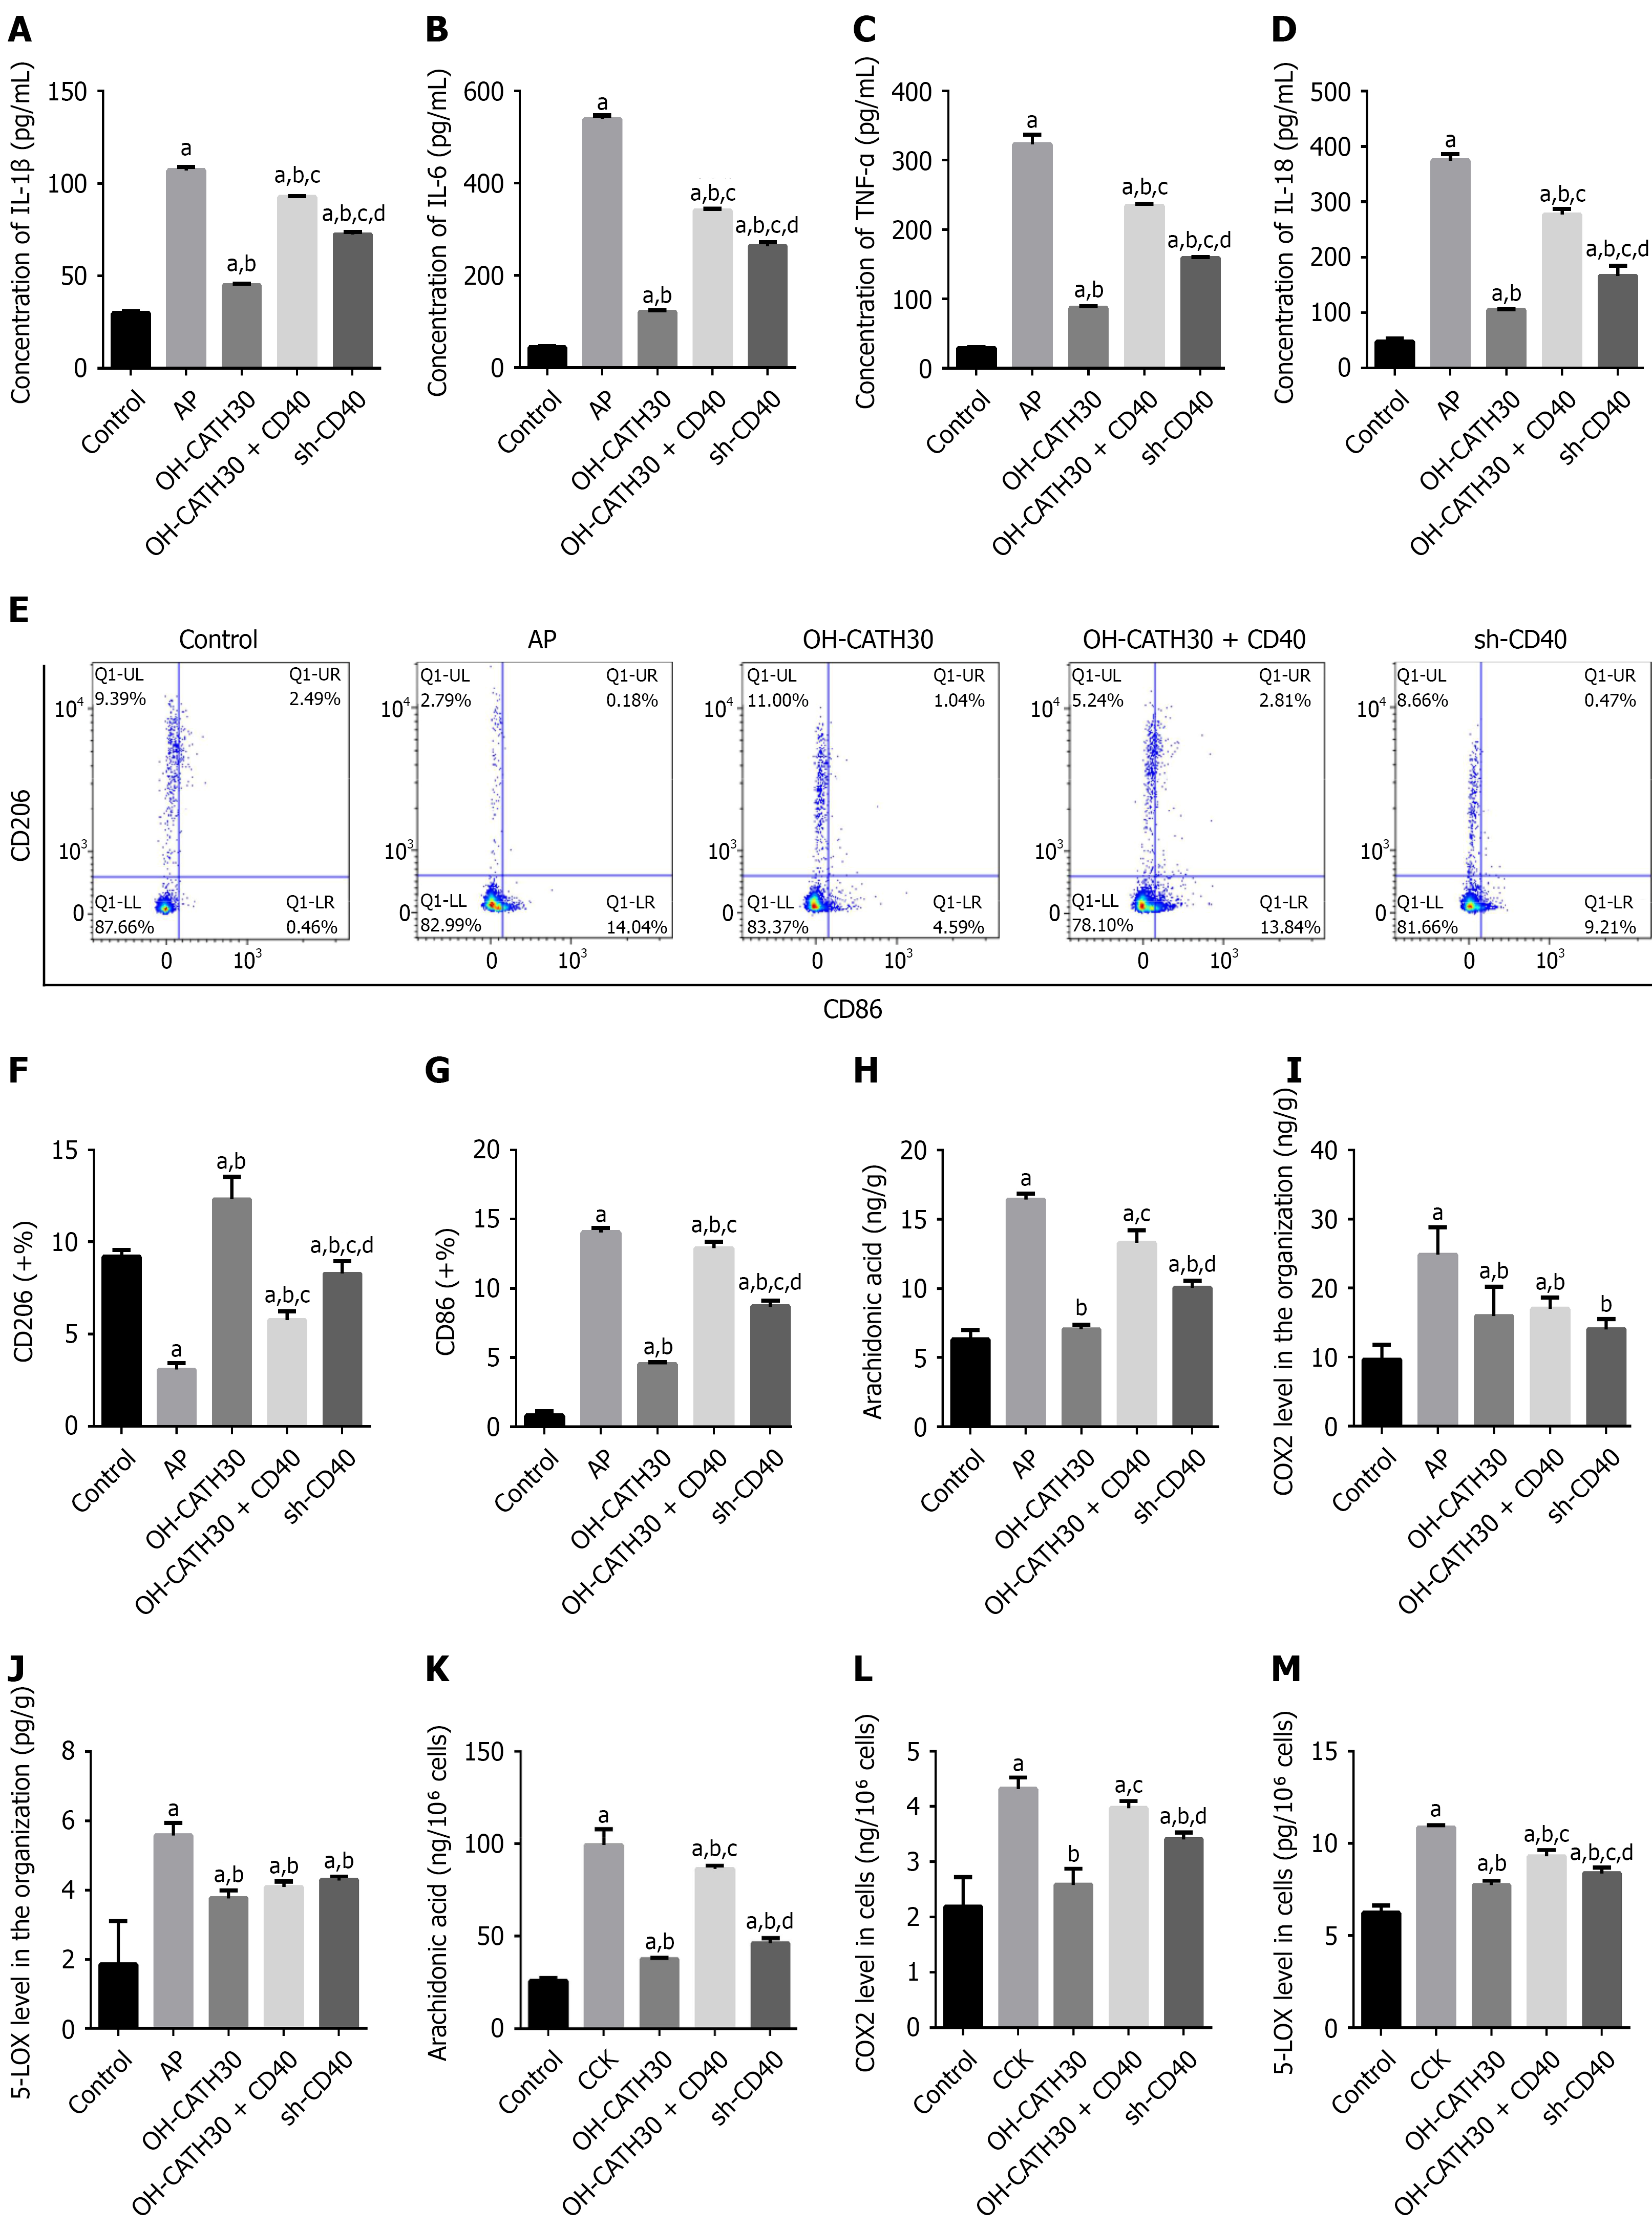
Figure 7 CD40-dependent effects of OH-CATH30 on inflammation, macrophage polarization, and arachidonic acid metabolism.
A-D: Serum levels of pro-inflammatory cytokines interleukin (IL)-1β (A), IL-6 (B), tumor necrosis factor-α (C), and IL-18 (D) measured used ELISA in mice from indicated groups: Control, acute pancreatitis (AP), AP + OH-CATH30, AP + OH-CATH30 + CD40 overexpression (AAV-CD40), and AP + CD40 knockdown (AAV-shCD40); E-G: Flow cytometric analysis of macrophage polarization in pancreatic tissues. Representative dot plots showing CD86+ (M1) and CD206+ (M2) macrophage populations among F4/80+CD11b+ cells (E); quantification of M1 (CD86+) and M2 (CD206+) macrophage percentages (F and G); H-J: Arachidonic acid (AA) metabolism in pancreatic tissues. AA levels measured using ELISA (H); protein expression of cyclooxygenase-2 (I) and 5-lipoxygenase (J) in tissue homogenates; K-M: AA metabolism in 266-6 cells. AA levels measured using ELISA (K); protein expression of cyclooxygenase-2 (L) and 5-lipoxygenase (M) in cell lysates. Cell groups: Control, cholecystokinin (CCK), CCK + OH-CATH30, CCK + OH-CATH30 + CD40 overexpression, and CCK + CD40 knockdown (sh-CD40). All data are presented as mean ± SD [n = 6 mice per group (A-J) or n = 3 independent experiments (K-M)]. Statistical analysis was performed using one-way ANOVA followed by Tukey’s HSD post hoc test. aP < 0.05 vs control, bP < 0.05 vs cholecystokinin or acute pancreatitis group, cP < 0.05 vs OH-CATH30 group, and dP < 0.05 vs OH-CATH30 + CD40 group. IL: Interleukin; TNF-α: Tumor necrosis factor-α; AP: Acute pancreatitis; COX2: Cyclooxygenase-2; 5-LOX: 5-lipoxygenase.
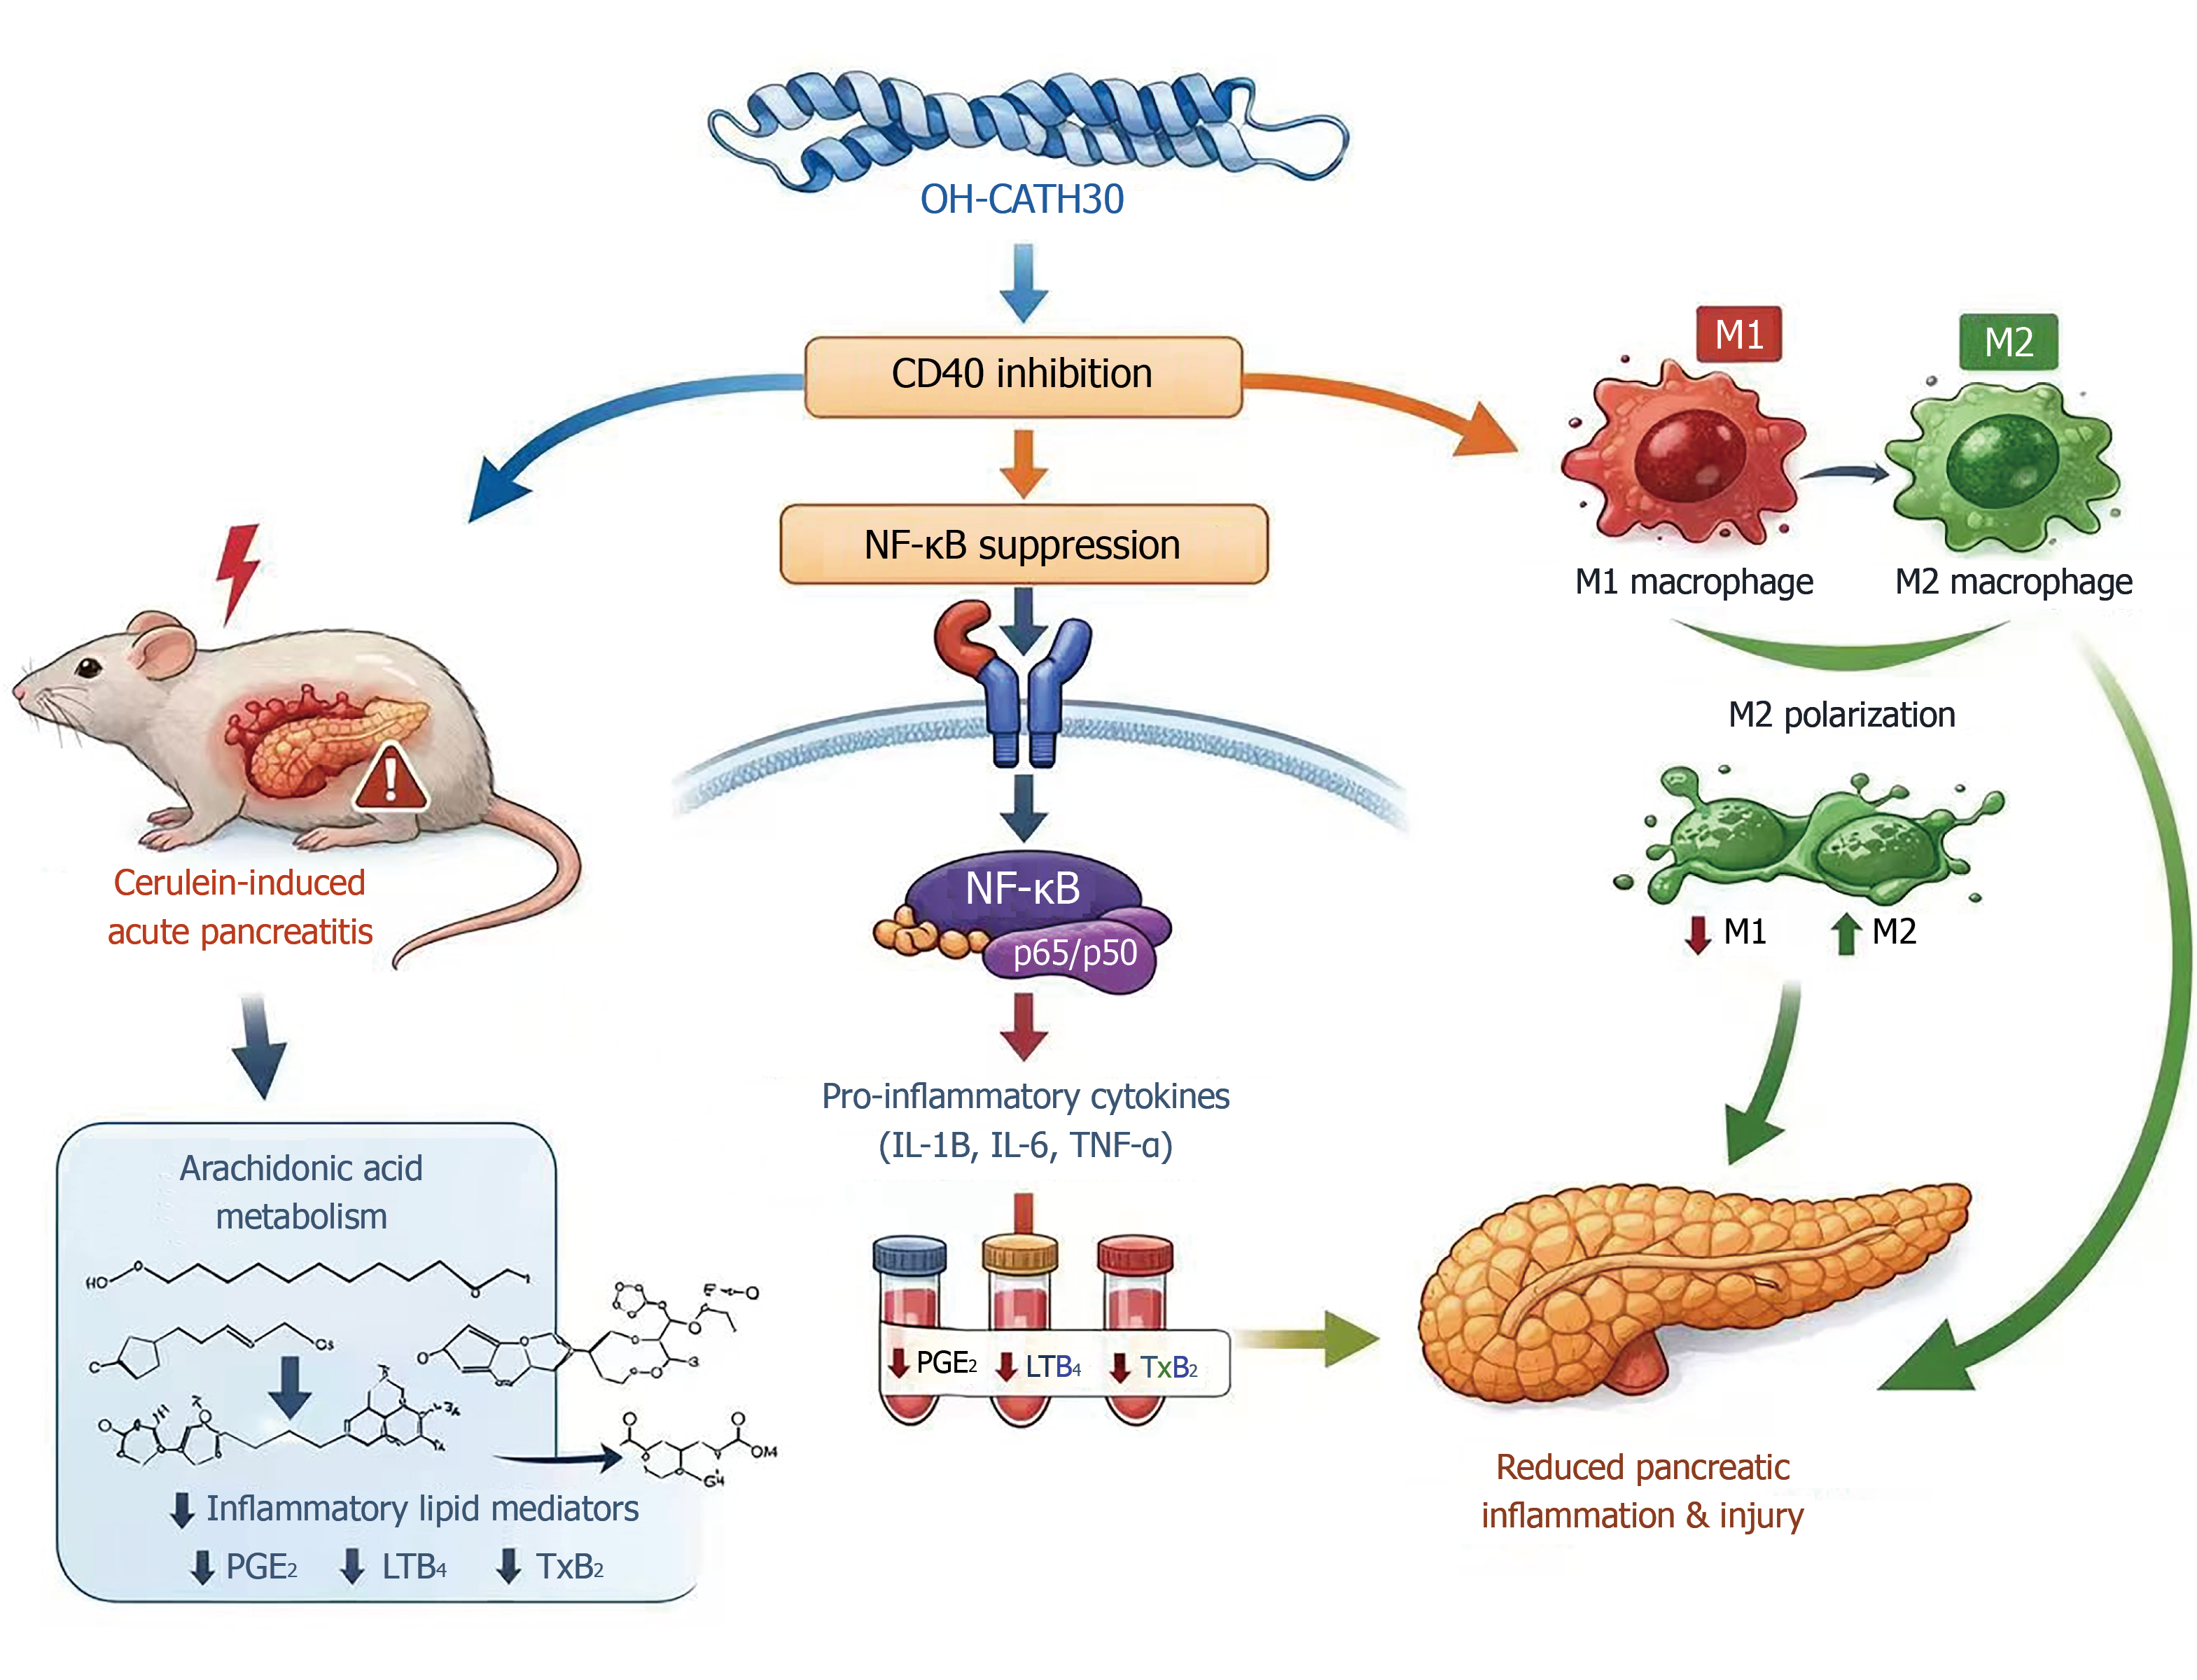
Figure 8 Schematic model of OH-CATH30 ameliorating acute pancreatitis by targeting CD40.
OH-CATH30 binds to CD40, which suppresses the downstream CD40-tumor necrosis factor receptor-associated factor 6-transforming growth factor beta-activated kinase 1-nuclear factor-kappa B signaling cascade in cerulein-induced acute pancreatitis mice model. This inhibition reduces pro-inflammatory cytokine production, drives M1-to-M2 macrophage phenotypic shift, and downregulates cyclooxygenase-2/5-lipoxygenase to inhibit arachidonic acid metabolism and synthesis of pro-inflammatory lipid mediators. These synergistic effects attenuate pancreatic and systemic inflammation, alleviate pancreatic injury, and ameliorate acute pancreatitis pathogenesis. IL: Interleukin; TNF-α: Tumor necrosis factor-α; NF-κB: Nuclear factor-kappa B.
- Citation: Li KL, Zhao Y, Shang WJ, Guo QH, Liu HT, Zhang JY, Jia XL, Liu BR. OH-CATH30 targets CD40 to suppress NF-κB signaling and promote arachidonic acid metabolic reprogramming in acute pancreatitis. World J Gastroenterol 2026; 32(36): 121753
- URL: https://www.wjgnet.com/1007-9327/full/v32/i36/121753.htm
- DOI: https://dx.doi.org/10.3748/wjg.121753