
















Copyright: ©Author(s) 2026.
World J Gastroenterol. Sep 28, 2026; 32(36): 121753
Published online Sep 28, 2026. doi: 10.3748/wjg.121753
Published online Sep 28, 2026. doi: 10.3748/wjg.121753
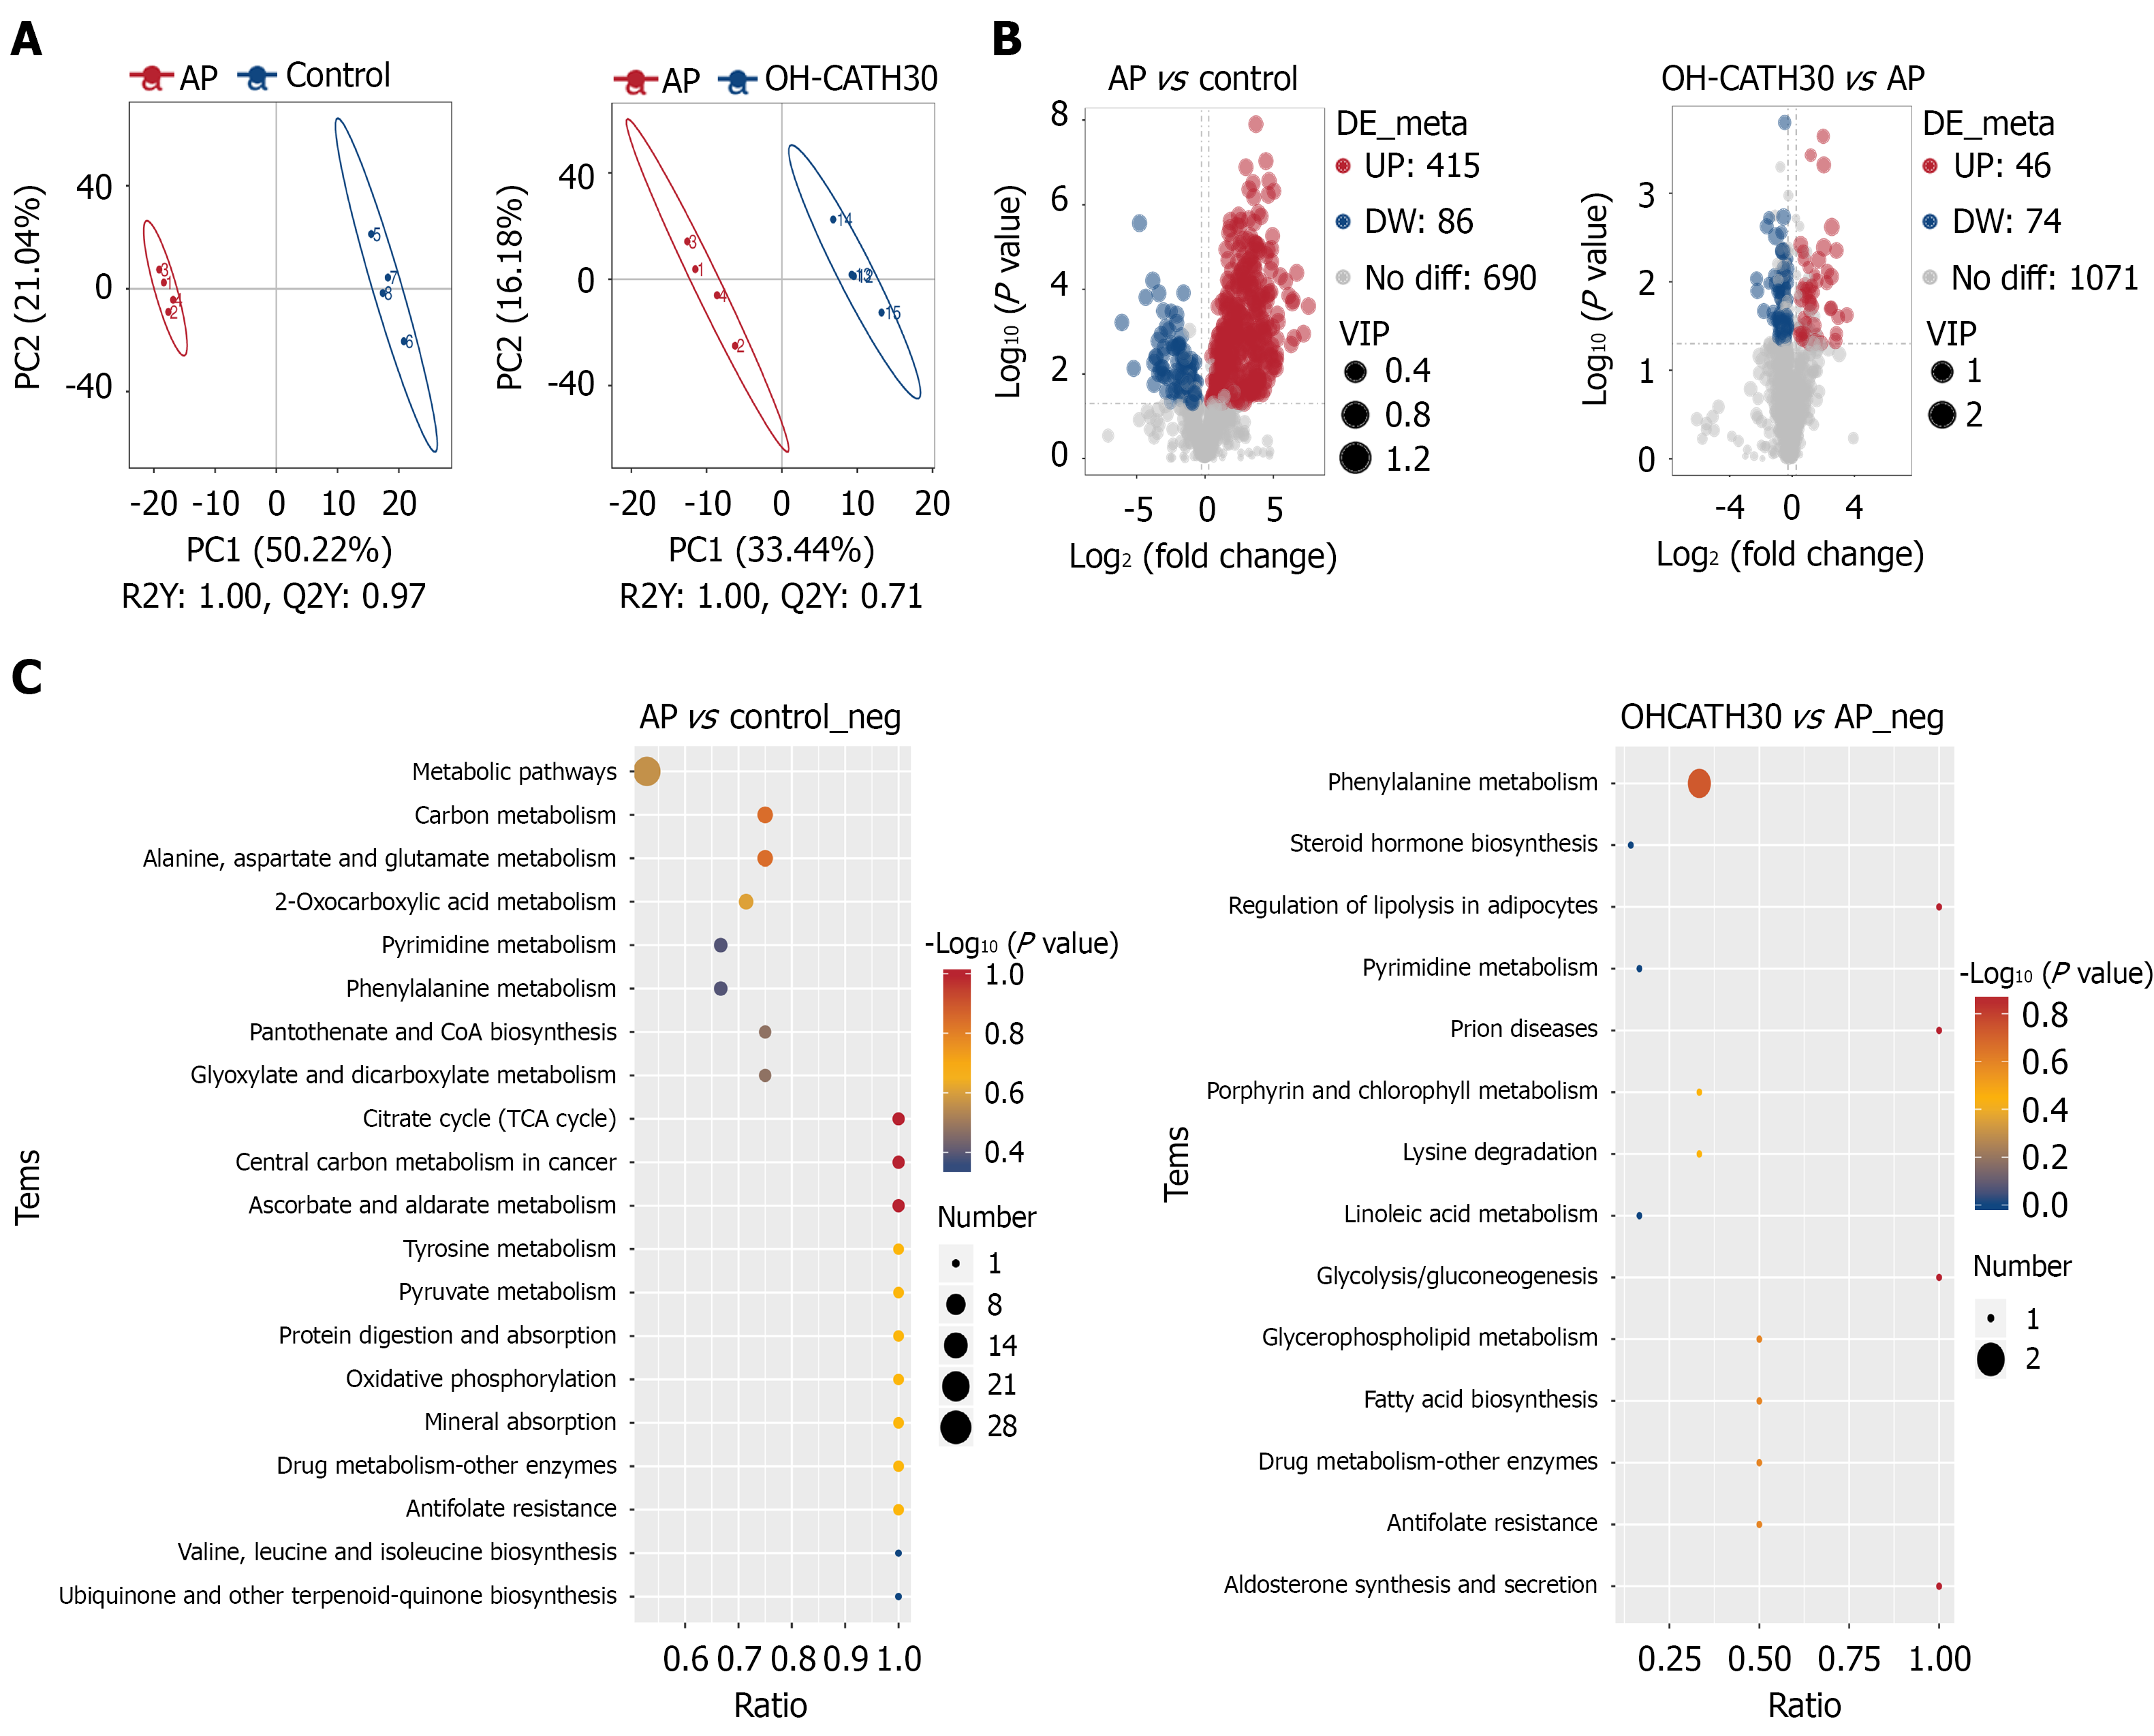
Figure 4 Metabolomic profiling identifies arachidonic acid metabolism as a key pathway modulated by OH-CATH30 in acute pancreatitis.
A: Principal component analysis score plot of pancreatic tissue metabolomes from control, acute pancreatitis (AP), and OH-CATH30-treated groups. Clear separation among groups indicates significant metabolic alterations induced by AP and partial restoration by OH-CATH30; B: Volcano plot displaying differentially abundant metabolites in AP vs control comparison. Each point represents a metabolite; red and blue dots indicate significantly upregulated and downregulated metabolites, respectively (variable importance in projection > 1, |log2(fold change)| ≥ 1, P < 0.05). Gray dots represent metabolites with no significant change; C: Kyoto Encyclopedia of Genes and Genomes pathway enrichment analysis of metabolites showed significant reversal after OH-CATH30 treatment. Bubble size represents the number of metabolites enriched in each pathway, and color indicates the significance level (P value). Arachidonic acid metabolism was identified as the most significantly modulated pathway. All data are derived from untargeted metabolomic analysis of pancreatic tissues (n = 4 biological replicates per group). AP: Acute pancreatitis; VIP: Variable importance in projection.
- Citation: Li KL, Zhao Y, Shang WJ, Guo QH, Liu HT, Zhang JY, Jia XL, Liu BR. OH-CATH30 targets CD40 to suppress NF-κB signaling and promote arachidonic acid metabolic reprogramming in acute pancreatitis. World J Gastroenterol 2026; 32(36): 121753
- URL: https://www.wjgnet.com/1007-9327/full/v32/i36/121753.htm
- DOI: https://dx.doi.org/10.3748/wjg.121753