
















Copyright: ©Author(s) 2026.
World J Gastroenterol. Sep 28, 2026; 32(36): 121753
Published online Sep 28, 2026. doi: 10.3748/wjg.121753
Published online Sep 28, 2026. doi: 10.3748/wjg.121753
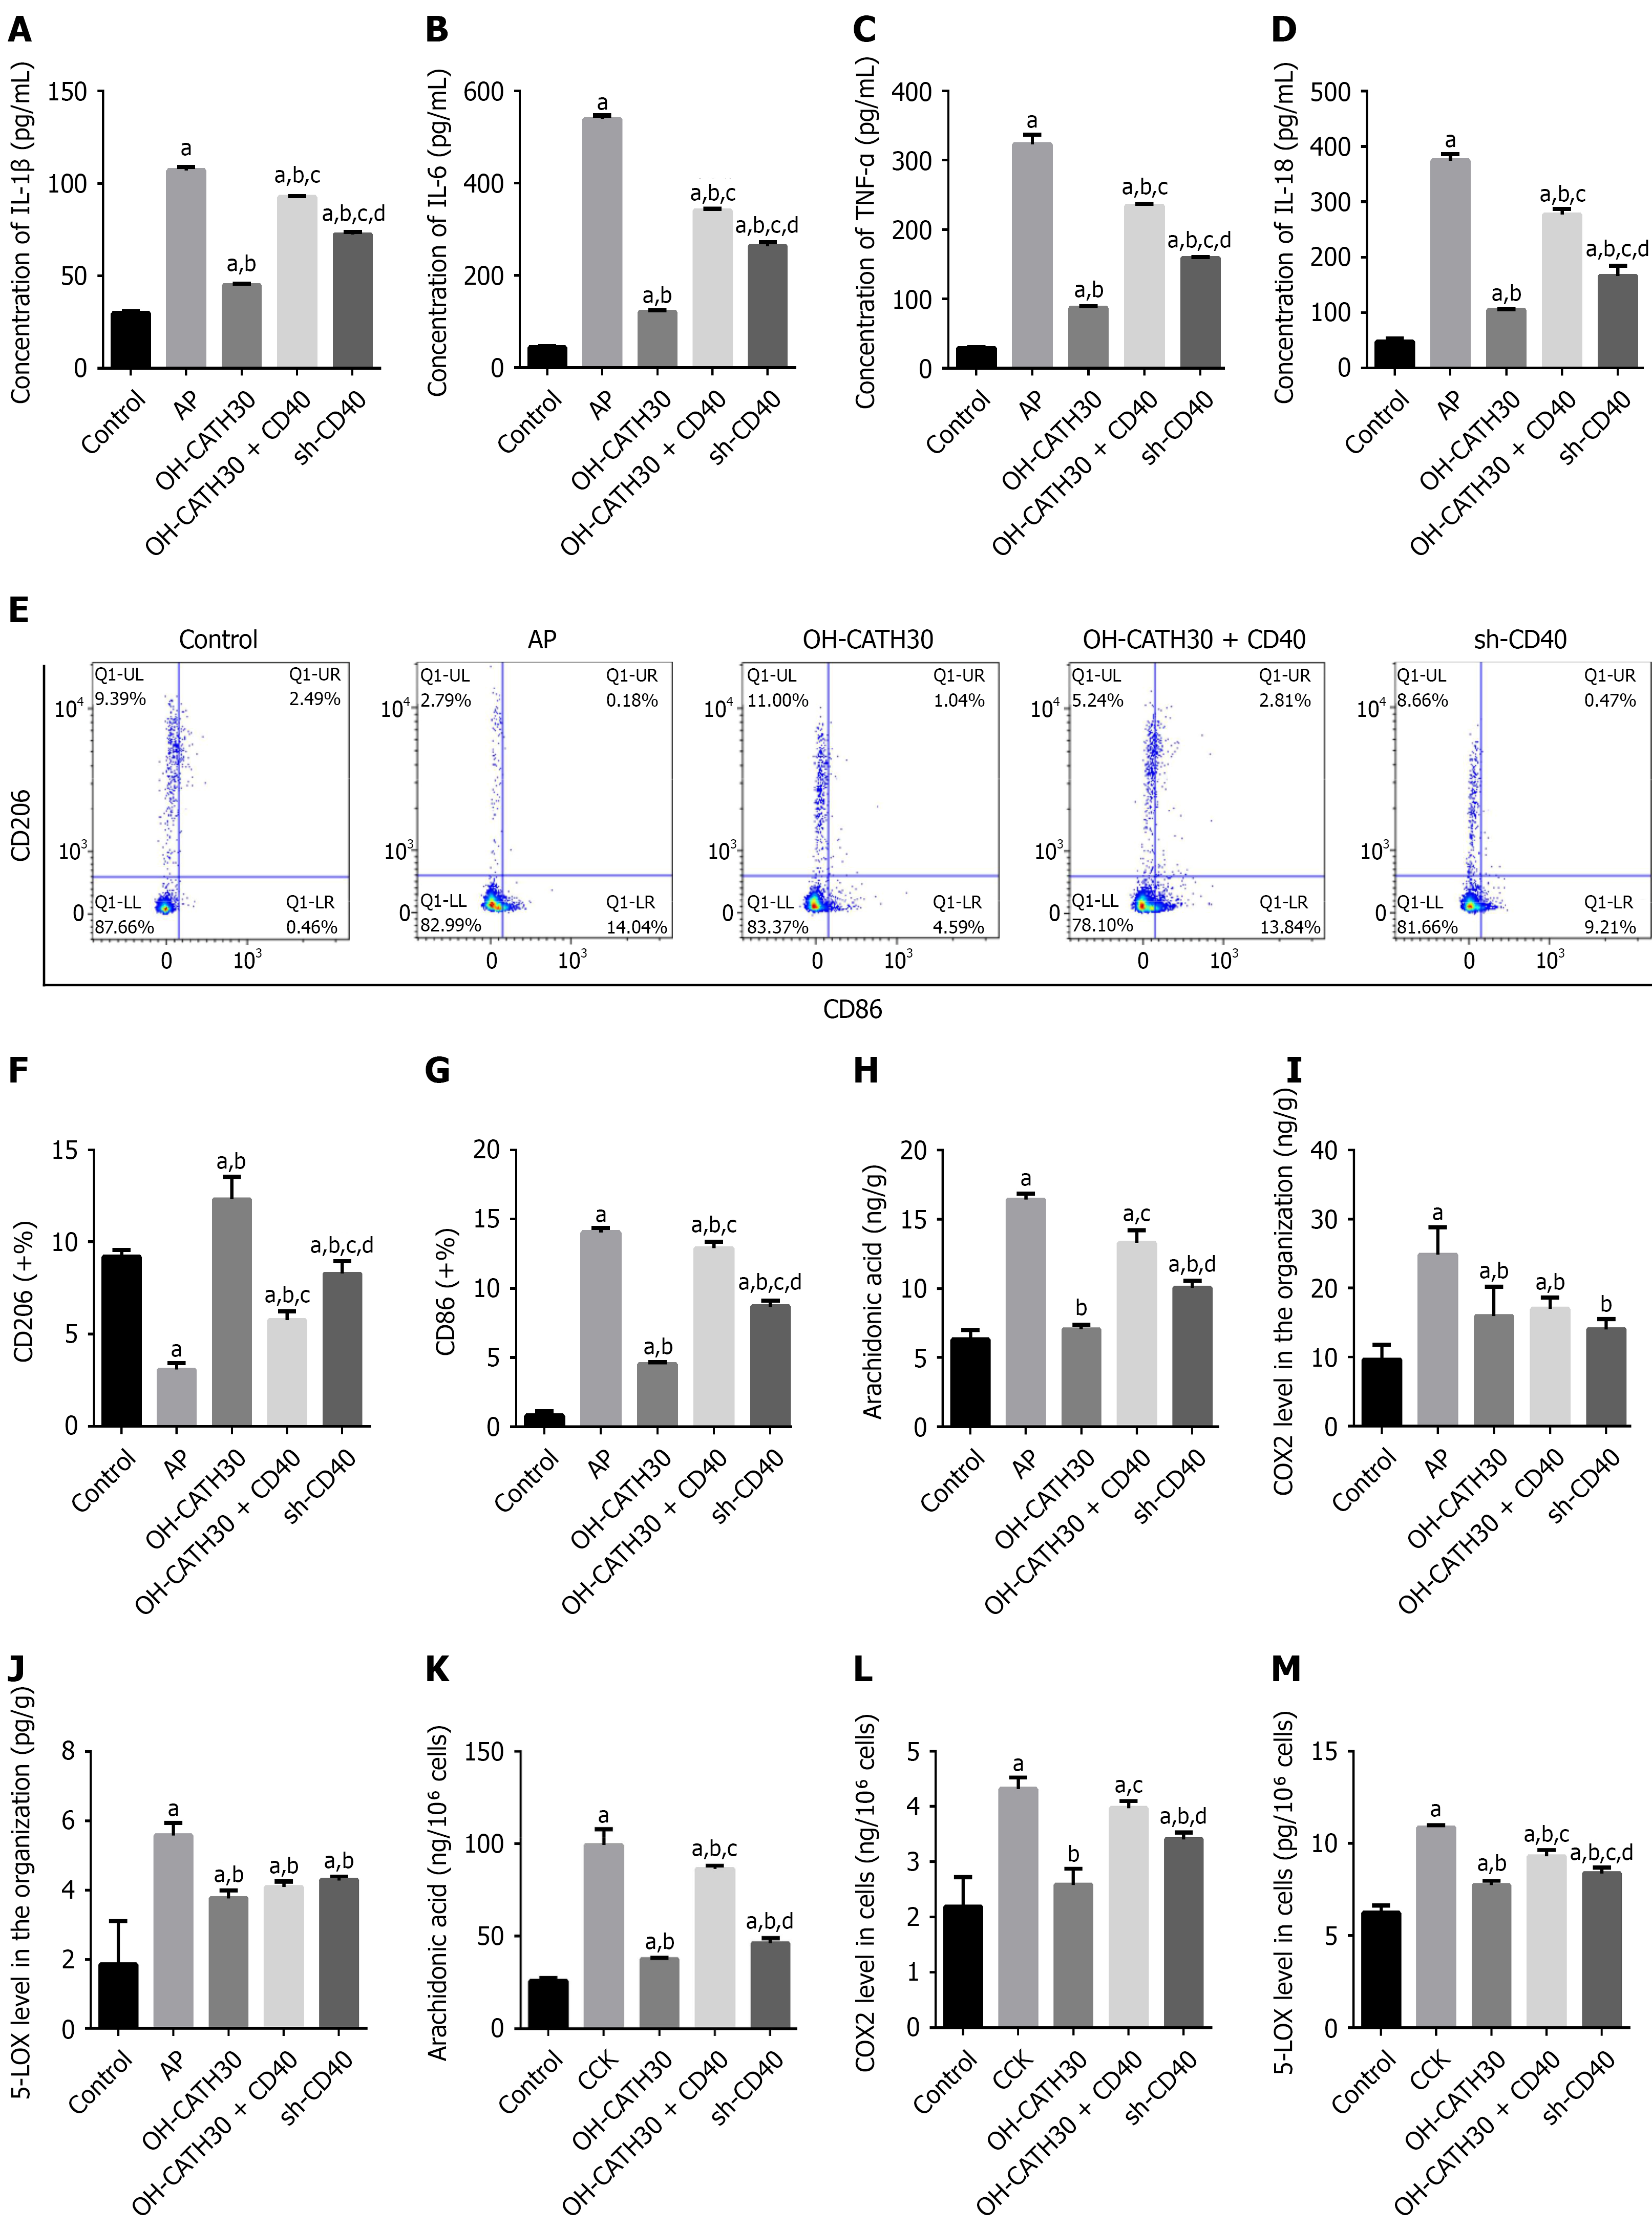
Figure 7 CD40-dependent effects of OH-CATH30 on inflammation, macrophage polarization, and arachidonic acid metabolism.
A-D: Serum levels of pro-inflammatory cytokines interleukin (IL)-1β (A), IL-6 (B), tumor necrosis factor-α (C), and IL-18 (D) measured used ELISA in mice from indicated groups: Control, acute pancreatitis (AP), AP + OH-CATH30, AP + OH-CATH30 + CD40 overexpression (AAV-CD40), and AP + CD40 knockdown (AAV-shCD40); E-G: Flow cytometric analysis of macrophage polarization in pancreatic tissues. Representative dot plots showing CD86+ (M1) and CD206+ (M2) macrophage populations among F4/80+CD11b+ cells (E); quantification of M1 (CD86+) and M2 (CD206+) macrophage percentages (F and G); H-J: Arachidonic acid (AA) metabolism in pancreatic tissues. AA levels measured using ELISA (H); protein expression of cyclooxygenase-2 (I) and 5-lipoxygenase (J) in tissue homogenates; K-M: AA metabolism in 266-6 cells. AA levels measured using ELISA (K); protein expression of cyclooxygenase-2 (L) and 5-lipoxygenase (M) in cell lysates. Cell groups: Control, cholecystokinin (CCK), CCK + OH-CATH30, CCK + OH-CATH30 + CD40 overexpression, and CCK + CD40 knockdown (sh-CD40). All data are presented as mean ± SD [n = 6 mice per group (A-J) or n = 3 independent experiments (K-M)]. Statistical analysis was performed using one-way ANOVA followed by Tukey’s HSD post hoc test. aP < 0.05 vs control, bP < 0.05 vs cholecystokinin or acute pancreatitis group, cP < 0.05 vs OH-CATH30 group, and dP < 0.05 vs OH-CATH30 + CD40 group. IL: Interleukin; TNF-α: Tumor necrosis factor-α; AP: Acute pancreatitis; COX2: Cyclooxygenase-2; 5-LOX: 5-lipoxygenase.
- Citation: Li KL, Zhao Y, Shang WJ, Guo QH, Liu HT, Zhang JY, Jia XL, Liu BR. OH-CATH30 targets CD40 to suppress NF-κB signaling and promote arachidonic acid metabolic reprogramming in acute pancreatitis. World J Gastroenterol 2026; 32(36): 121753
- URL: https://www.wjgnet.com/1007-9327/full/v32/i36/121753.htm
- DOI: https://dx.doi.org/10.3748/wjg.121753