
















Copyright: ©Author(s) 2026.
World J Gastroenterol. Sep 28, 2026; 32(36): 121753
Published online Sep 28, 2026. doi: 10.3748/wjg.121753
Published online Sep 28, 2026. doi: 10.3748/wjg.121753
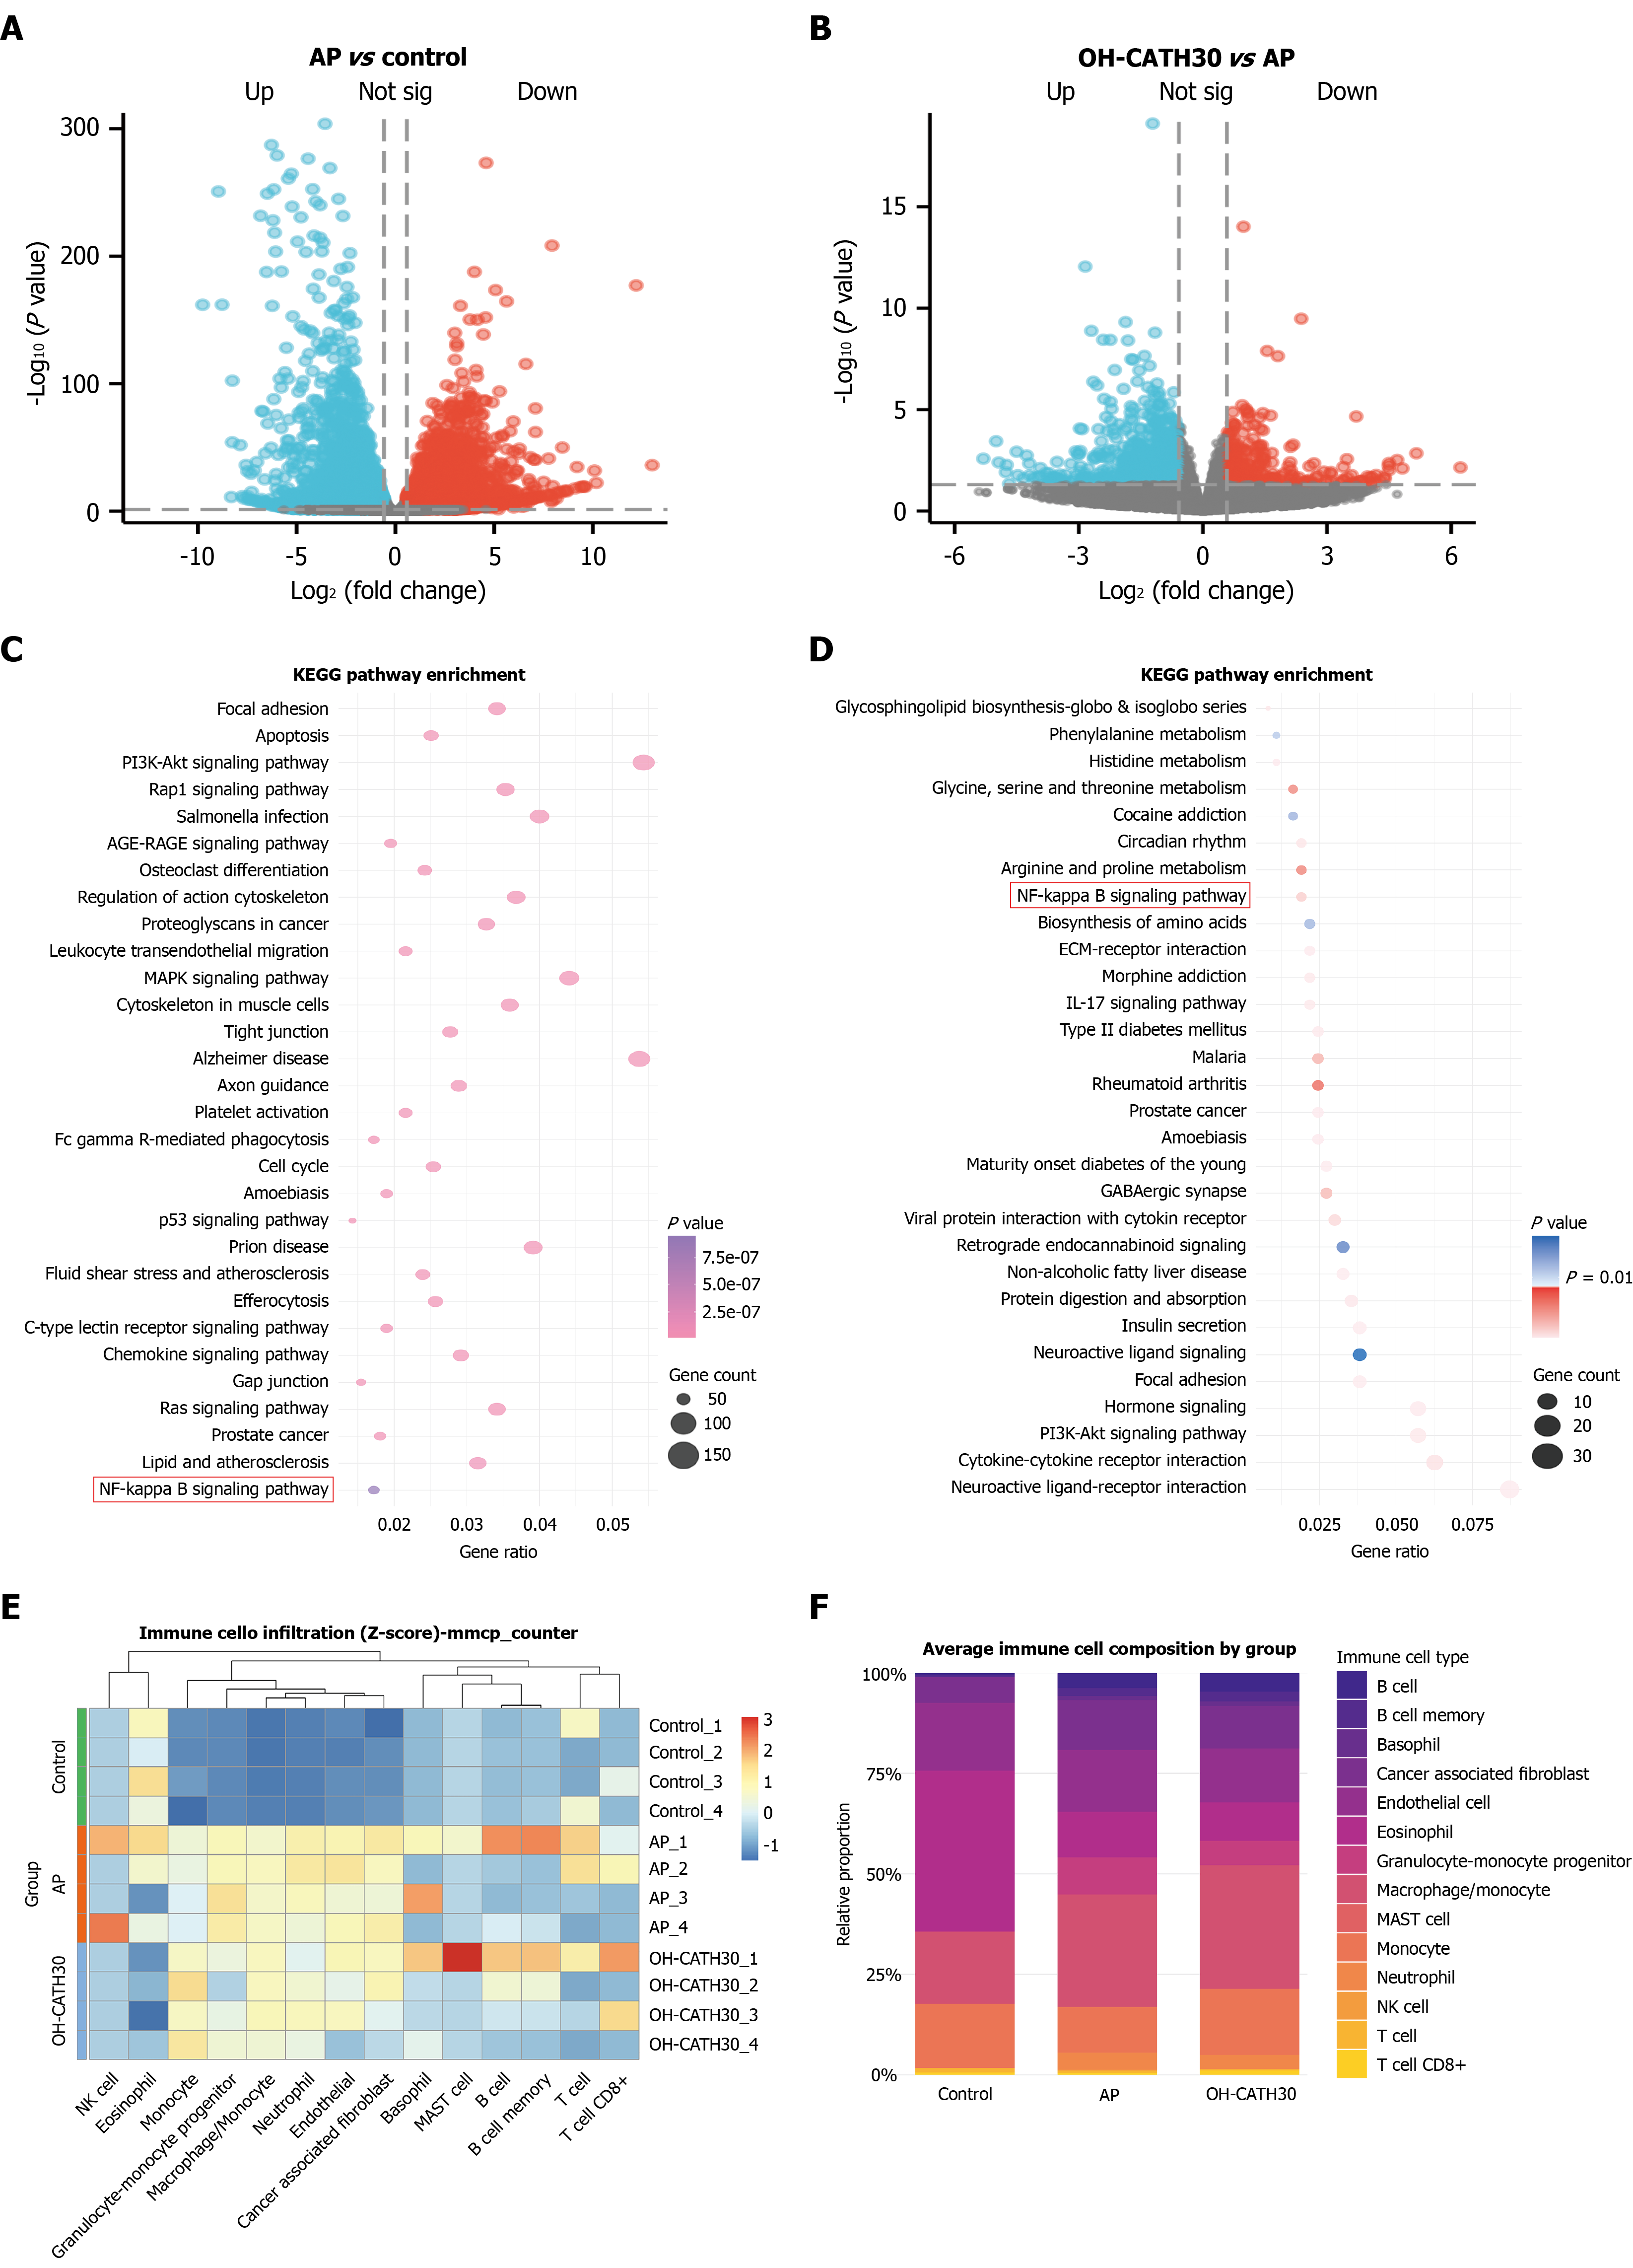
Figure 3 Transcriptomic profiling shows that OH-CATH30 modulates inflammatory signaling pathways in acute pancreatitis.
A and B: Volcano plots depicting differentially expressed genes in pancreatic tissues from (A) acute pancreatitis (AP) vs control and (B) OH-CATH30 vs AP comparisons. Red and blue dots represent significantly upregulated and downregulated genes, respectively (adjusted P ≤ 0.05, |log2(fold change)| ≥ 1). Gray dots indicate non-significant changes; C and D: Kyoto Encyclopedia of Genes and Genomes pathway enrichment analysis of differentially expressed genes; C: Top enriched pathways in AP vs control; D: Pathways significantly modulated by OH-CATH30 treatment; E: Heatmap showing relative abundance of infiltrating immune cell types in each sample, estimated using CIBERSORT algorithm; F: Bar plot depicting average immune cell composition in control, AP, and OH-CATH30-treated groups. All data are derived from transcriptomic sequencing of pancreatic tissues (n = 4 biological replicates per group). AP: Acute pancreatitis; KEGG: Kyoto Encyclopedia of Genes and Genomes.
- Citation: Li KL, Zhao Y, Shang WJ, Guo QH, Liu HT, Zhang JY, Jia XL, Liu BR. OH-CATH30 targets CD40 to suppress NF-κB signaling and promote arachidonic acid metabolic reprogramming in acute pancreatitis. World J Gastroenterol 2026; 32(36): 121753
- URL: https://www.wjgnet.com/1007-9327/full/v32/i36/121753.htm
- DOI: https://dx.doi.org/10.3748/wjg.121753