Copyright
©The Author(s) 2020.
World J Gastrointest Pathophysiol. Jun 20, 2020; 11(4): 84-103
Published online Jun 20, 2020. doi: 10.4291/wjgp.v11.i4.84
Published online Jun 20, 2020. doi: 10.4291/wjgp.v11.i4.84
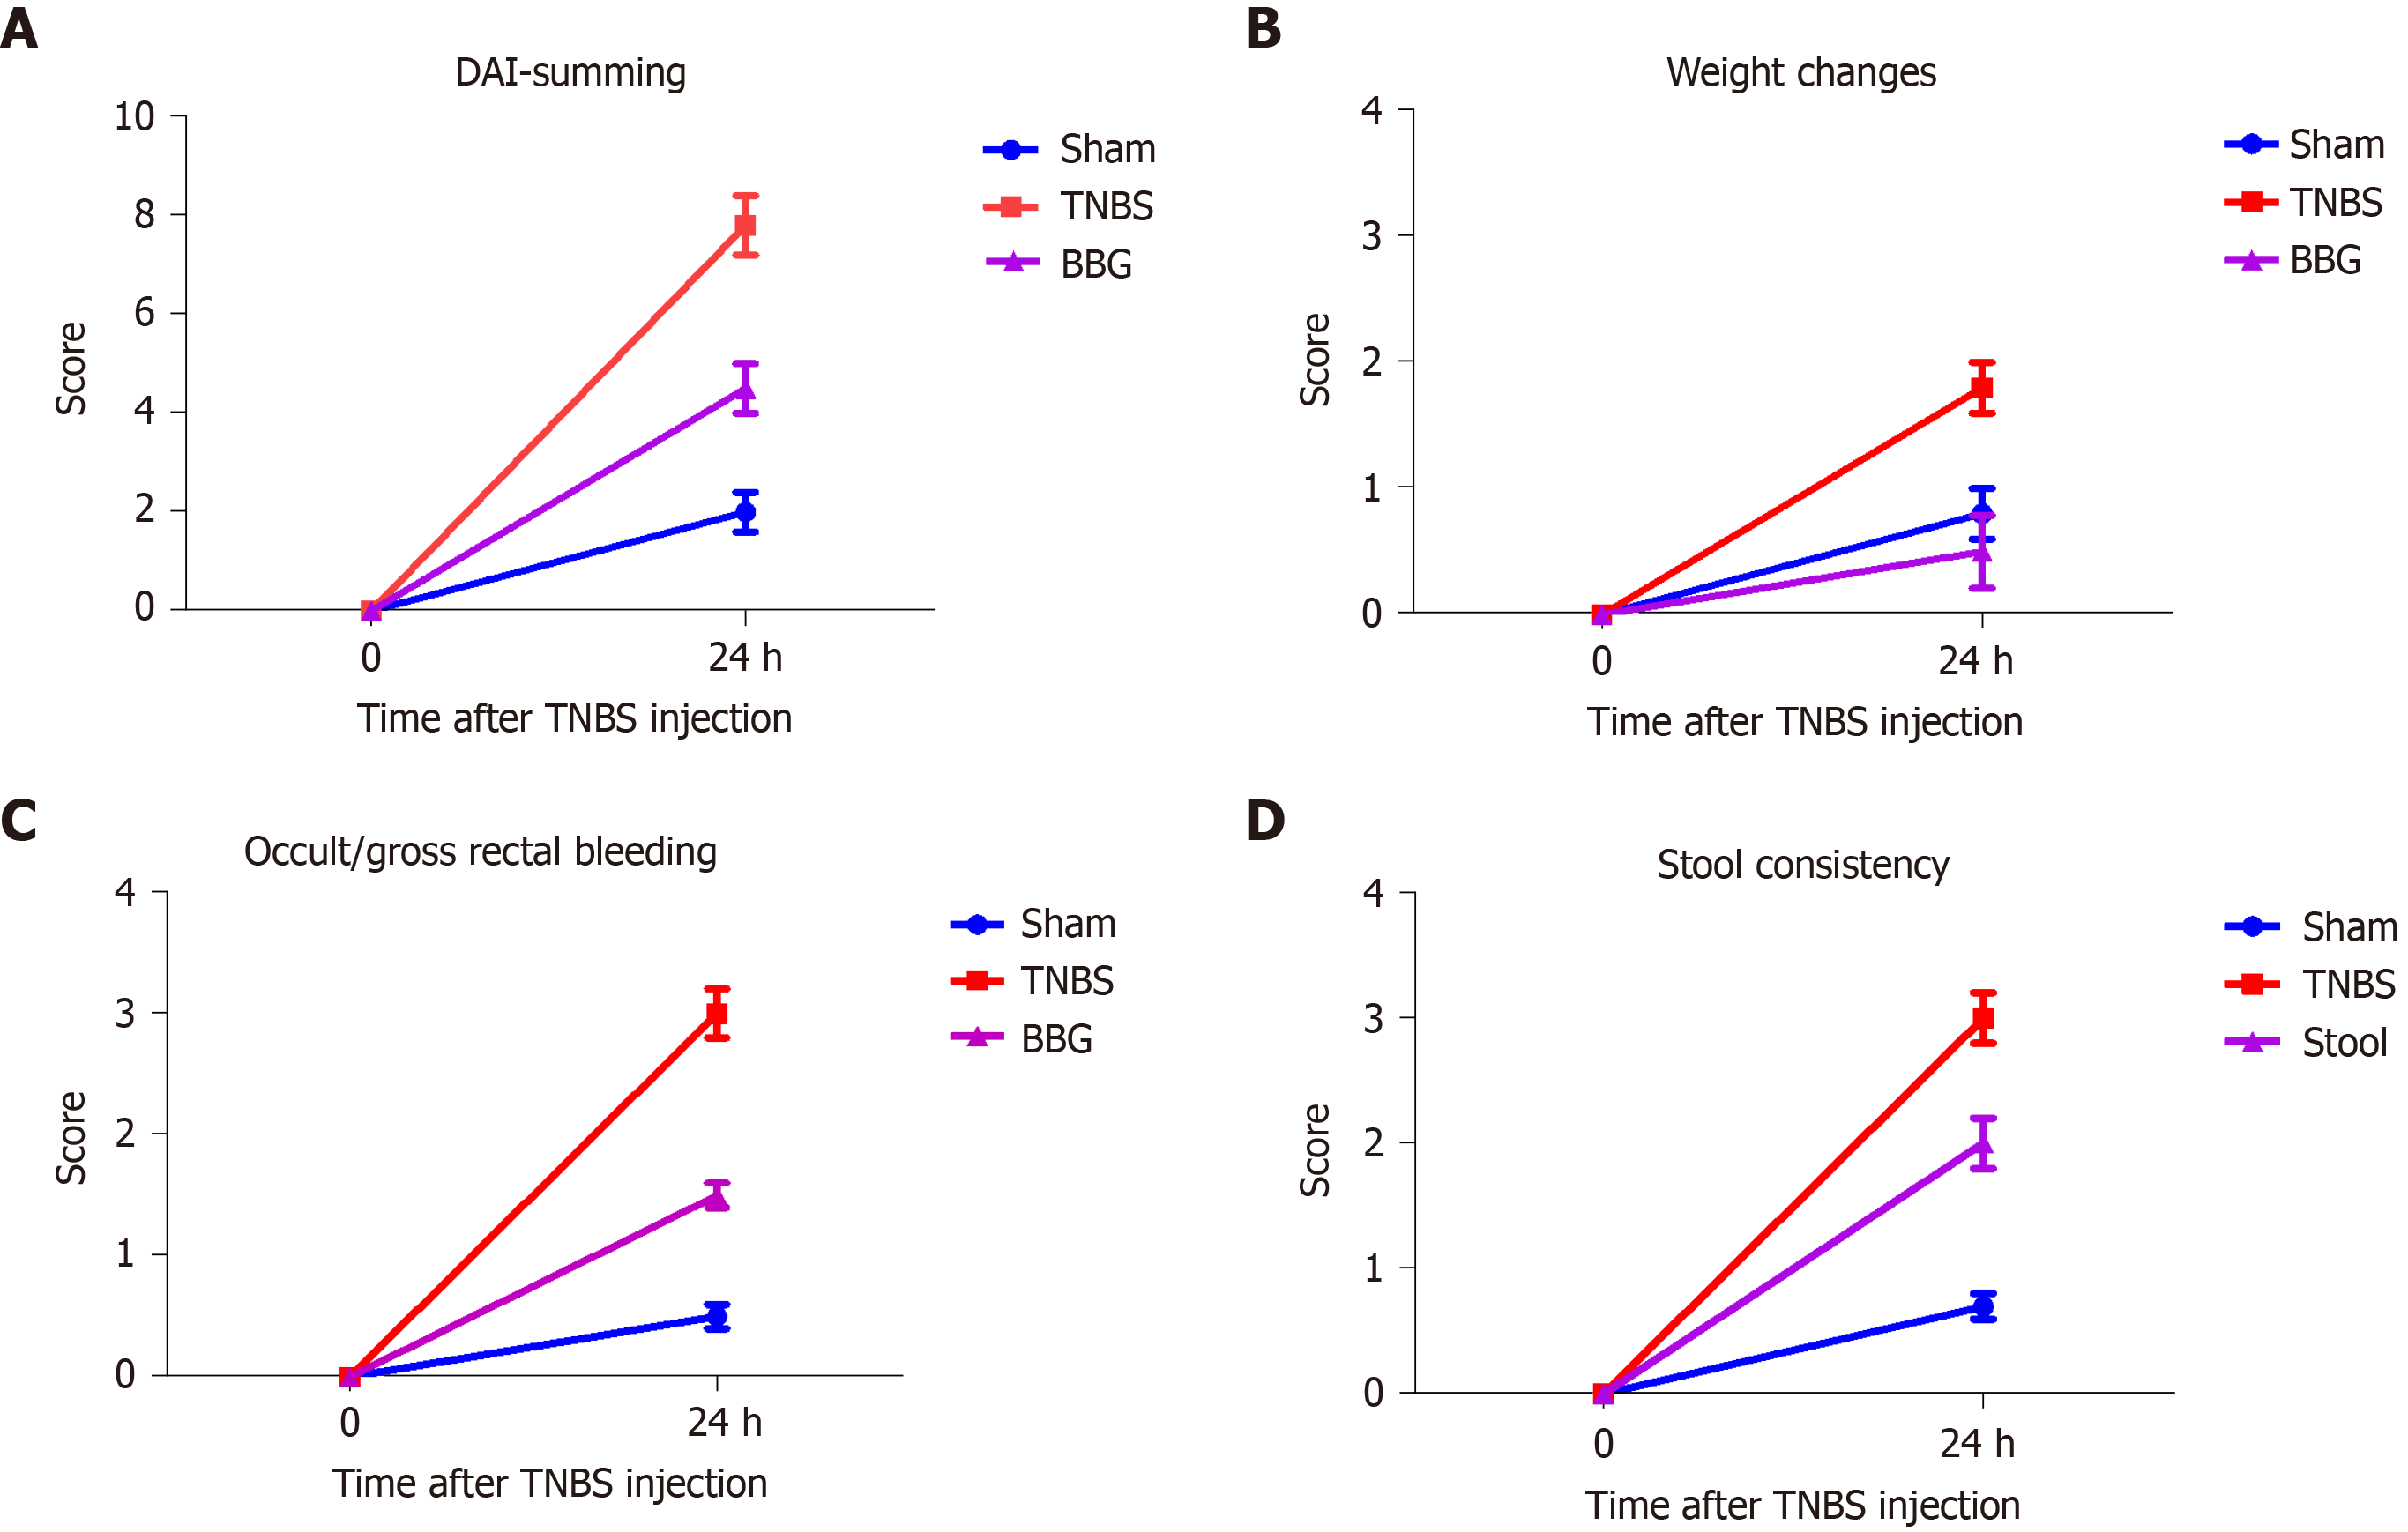
Figure 1 Scoring of the disease activity index in the in the sham, 2,4,6-trinitrobenzene sulfonic acid and brilliant blue G groups.
A: The disease activity index was calculated by summing the score parameters: Mild activity was classified from 1 to 4; moderate activity, from 5 to 8; and maximal activity from 9 to 12. The scores were categorized as follows according to the corresponding parameters; B: Weight change score: 0 ≤ 1, 1 = 1-5, 2 = 5-10, 3 = 10-15, and 4 ≥ 15%; C: Occult/gross rectal bleeding: 0 = normal, 1 = occult blood +, 2 = occult blood ++, 3 = occult blood +++, and 4 = gross bleeding; D: Stool consistency score: 0 = normal (well-formed pellets), 1 = normal, 2 = loose stool (pasty and semiformed stools that do not stick to the anus), 3 = loose stool, and 4 = diarrhea (liquid stools that stick to the anus). DAI: Disease activity index; TNBS: 2,4,6-trinitrobenzene sulfonic acid; BBG: Brilliant blue G.
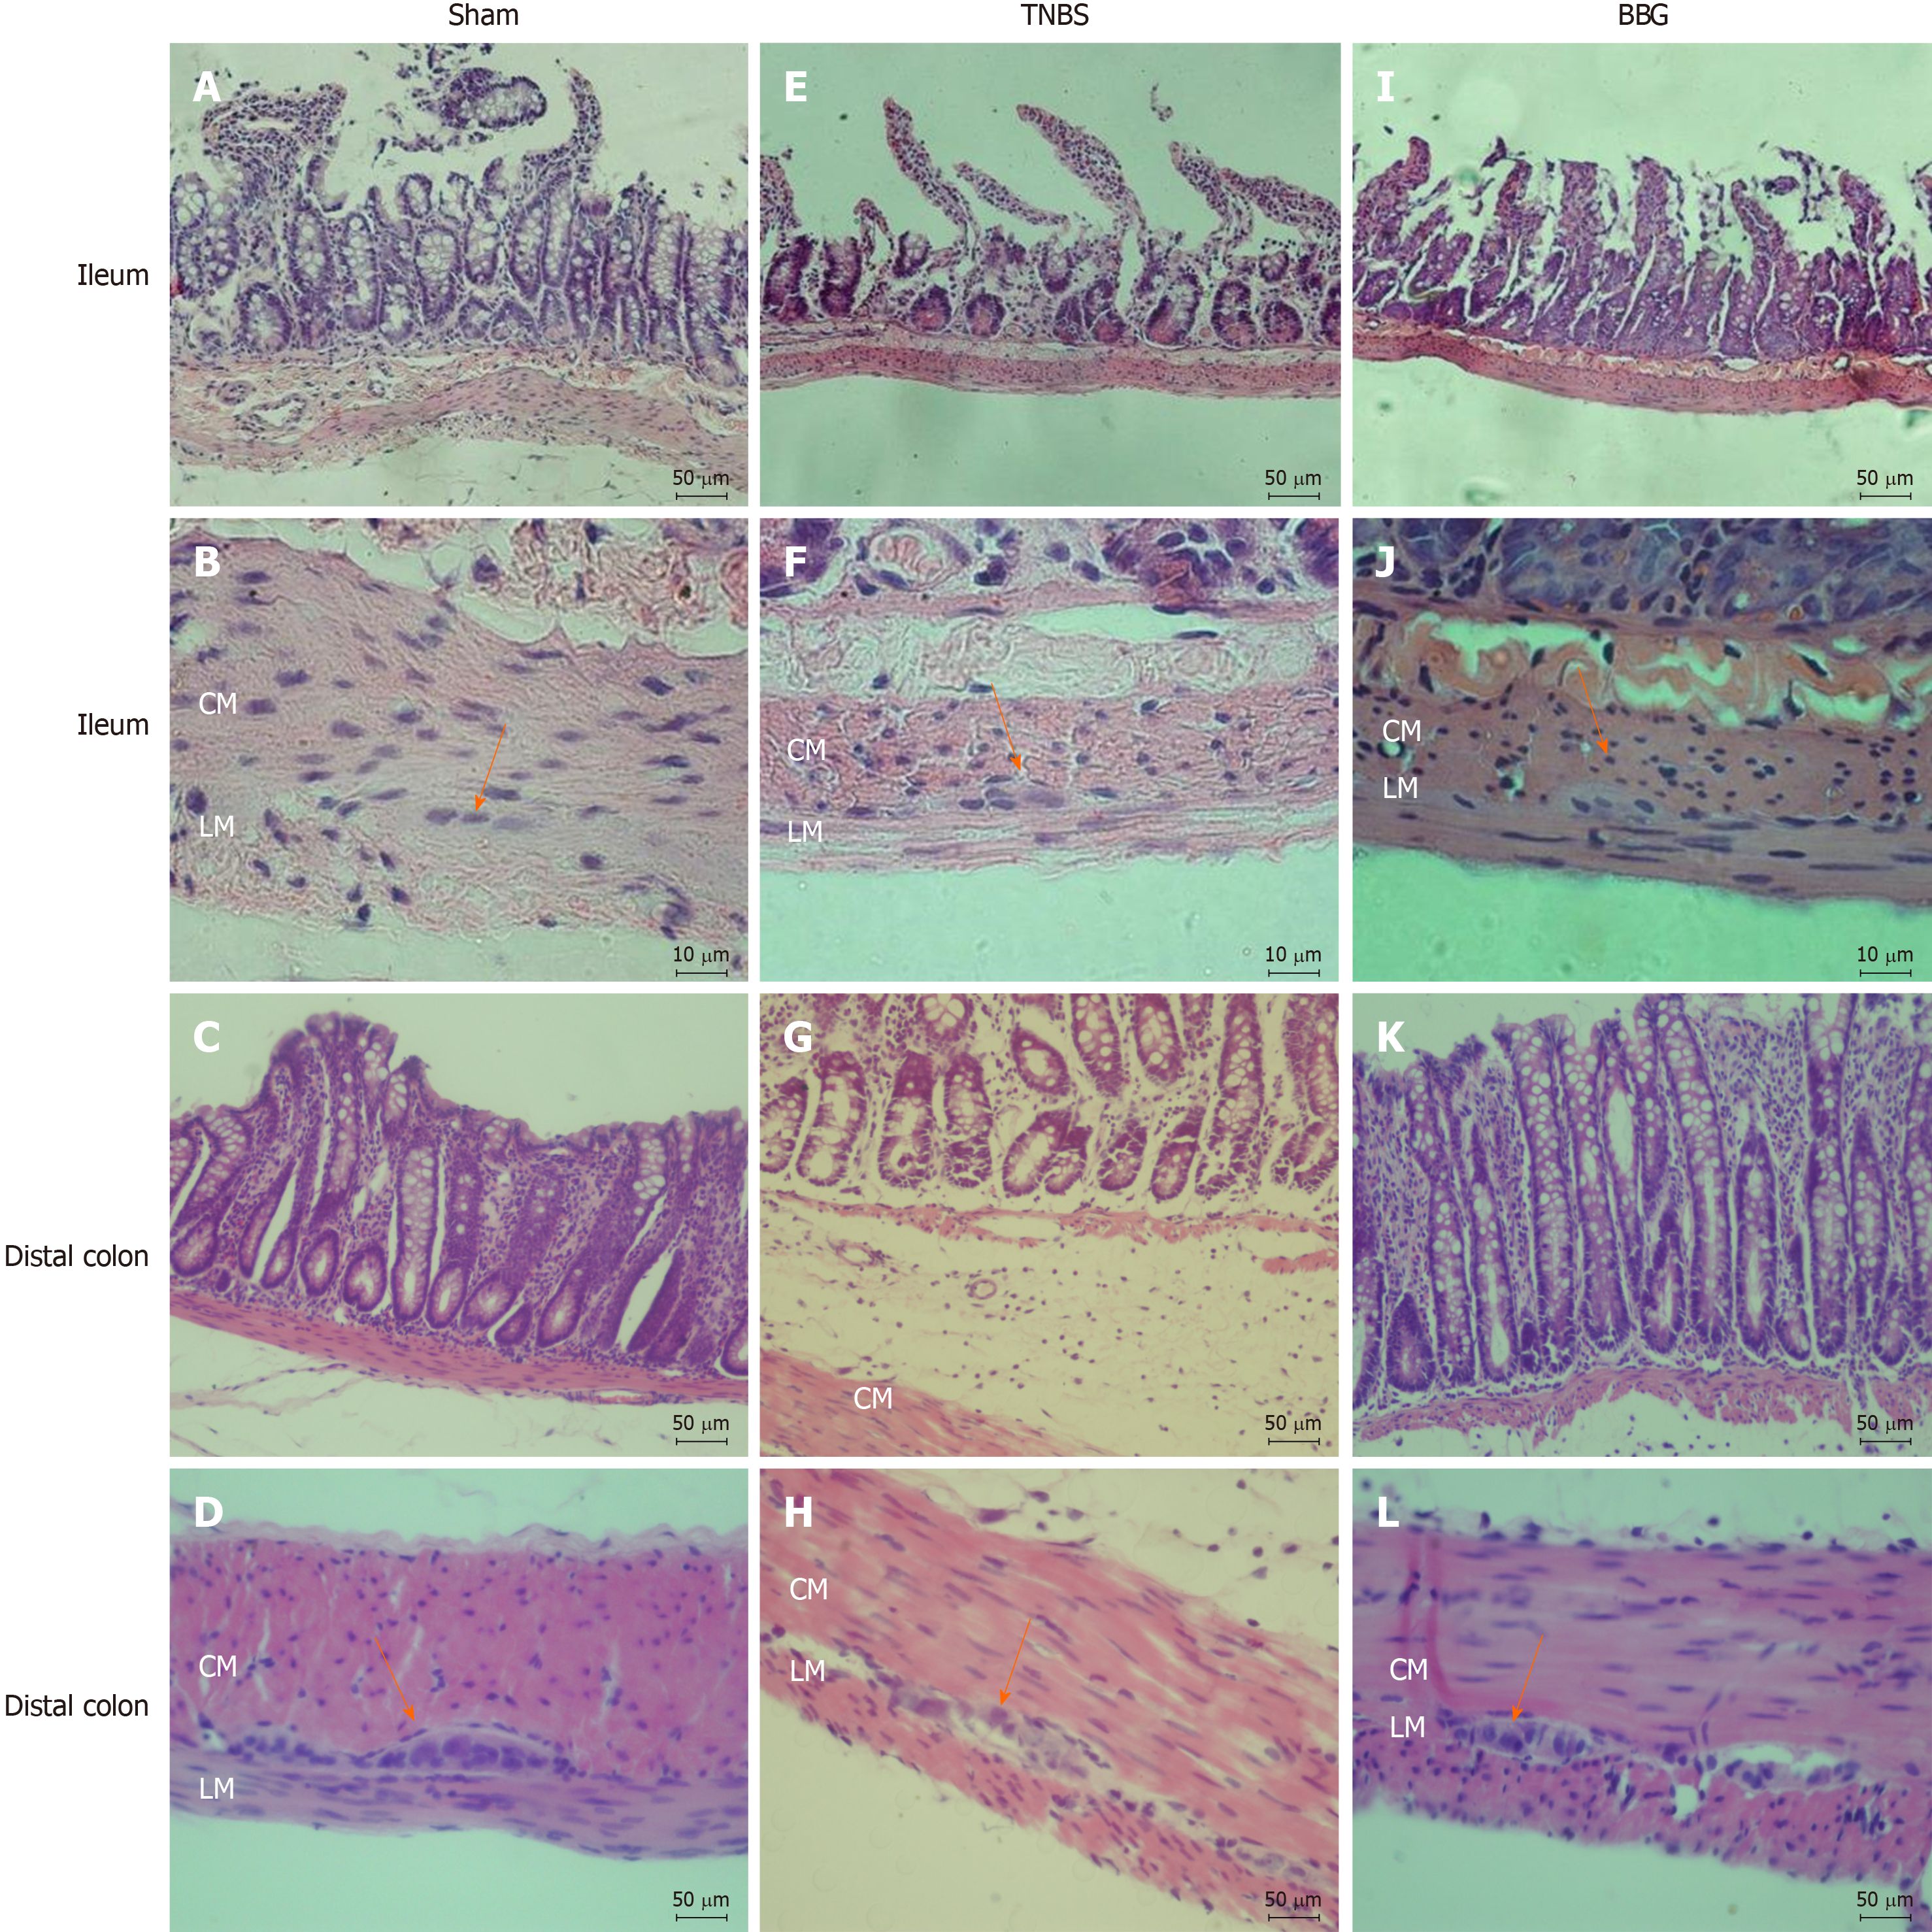
Figure 2 Photomicrographs showing sections stained with hematoxylin and eosin.
A, B, E, F, I, J: Rat ileum myenteric plexus in the sham, 2,4,6-trinitrobenzene sulfonic acid (TNBS) and brilliant blue G (BBG) groups; C, D, G, H, K, L: Rat distal colon myenteric plexus in the sham, TNBS and BBG groups. The histological observations showed that in ileum the appearances of the mucosa, circular and longitudinal muscles and enteric neurons in the sham, TNBS and BBG groups were preserved. However, the histological observations showed that in distal colon the edema and inflammatory cell infiltration in the TNBS group. The mucosa, the circular and longitudinal muscles and the distal colon enteric neurons in the sham and BBG groups were preserved. Orange arrows indicate myenteric ganglia. CM: Circular muscle; LM: Longitudinal plexus; TNBS: 2,4,6-trinitrobenzene sulfonic acid; BBG: Brilliant blue G. Scale bars: A, C, D, E, G, H, I, K, L = 50 μm; B, F, J = 10 μm.
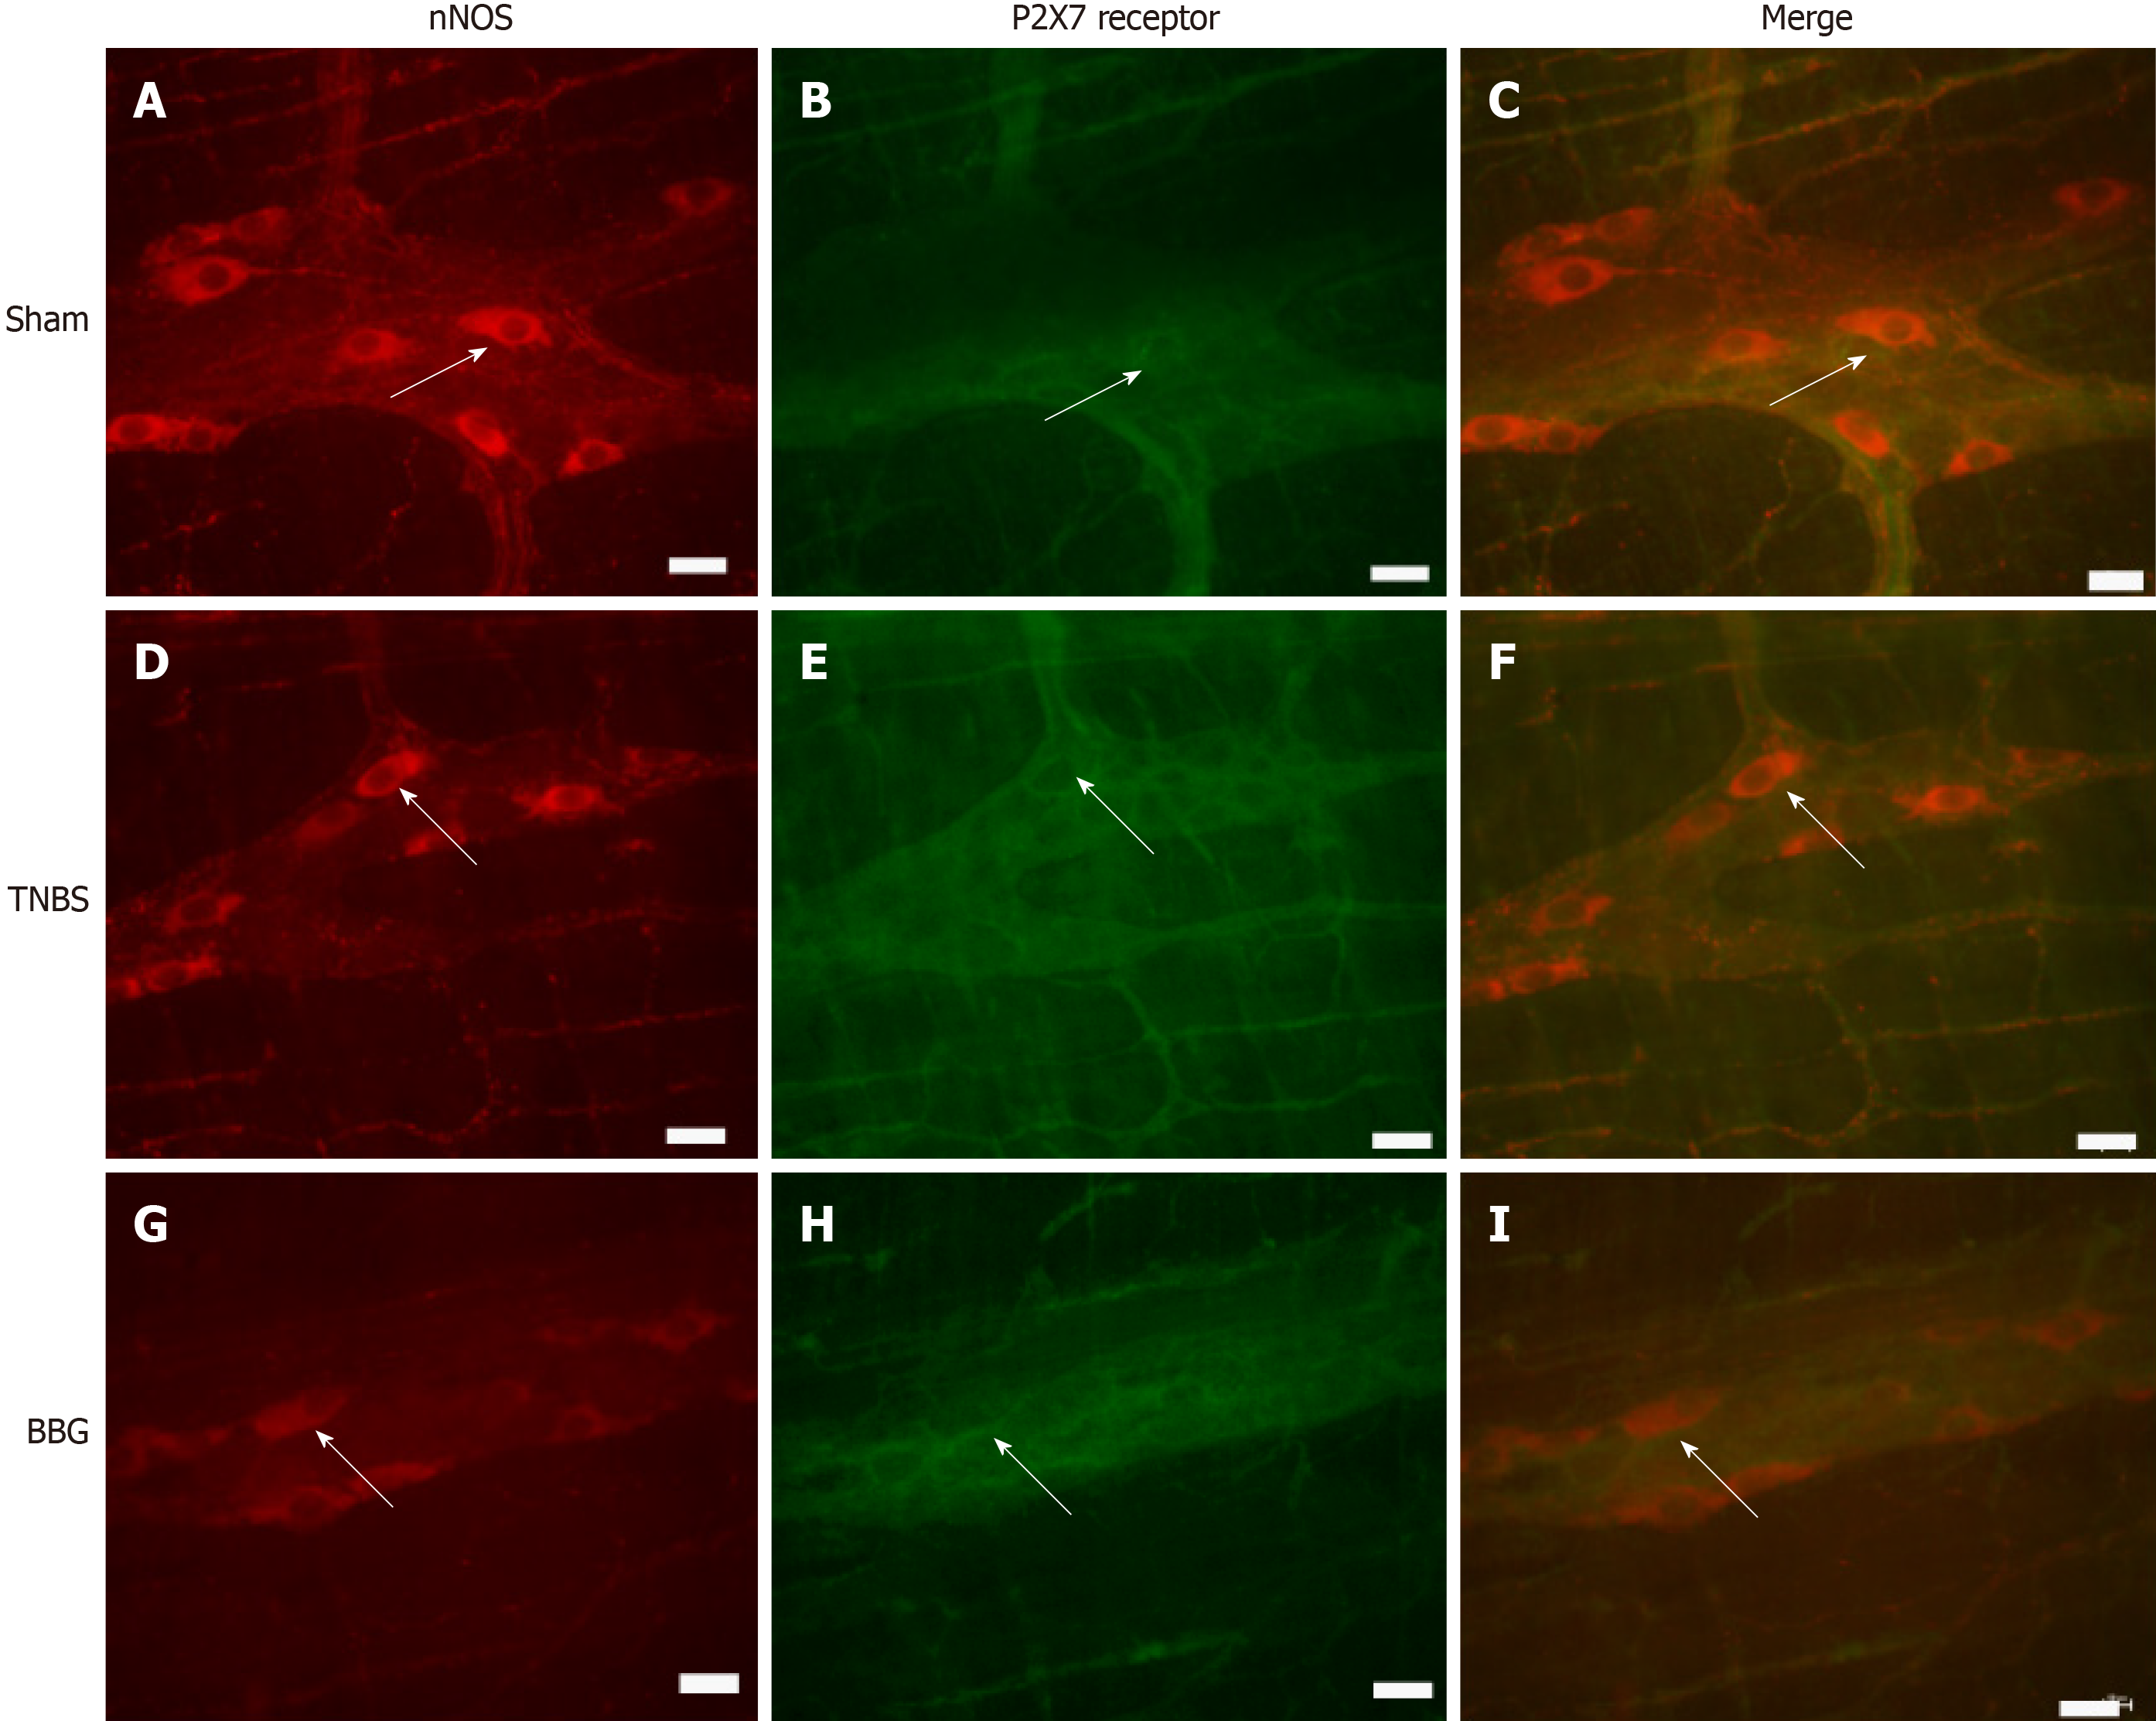
Figure 3 Colocalization of the P2X7 receptor with neuronal nitric oxide synthase in neurons of the rat ileum myenteric plexus in the sham, 2,4,6-trinitrobenzene sulfonic acid and brilliant blue G groups.
A-C: Sham group; D-F: 2,4,6-trinitrobenzene group; G-I: Brilliant blue G group. Neuronal nitric oxide synthase immunoreactivity (red; A, D, and G) colocalized with P2X7 immunoreactivity (green; B, E and H). Single arrows indicate double-labeled neurons. Scale bars = 50 µm. nNOS: Neuronal nitric oxide synthase; TNBS: 2,4,6-trinitrobenzene sulfonic acid; BBG: Brilliant blue G.
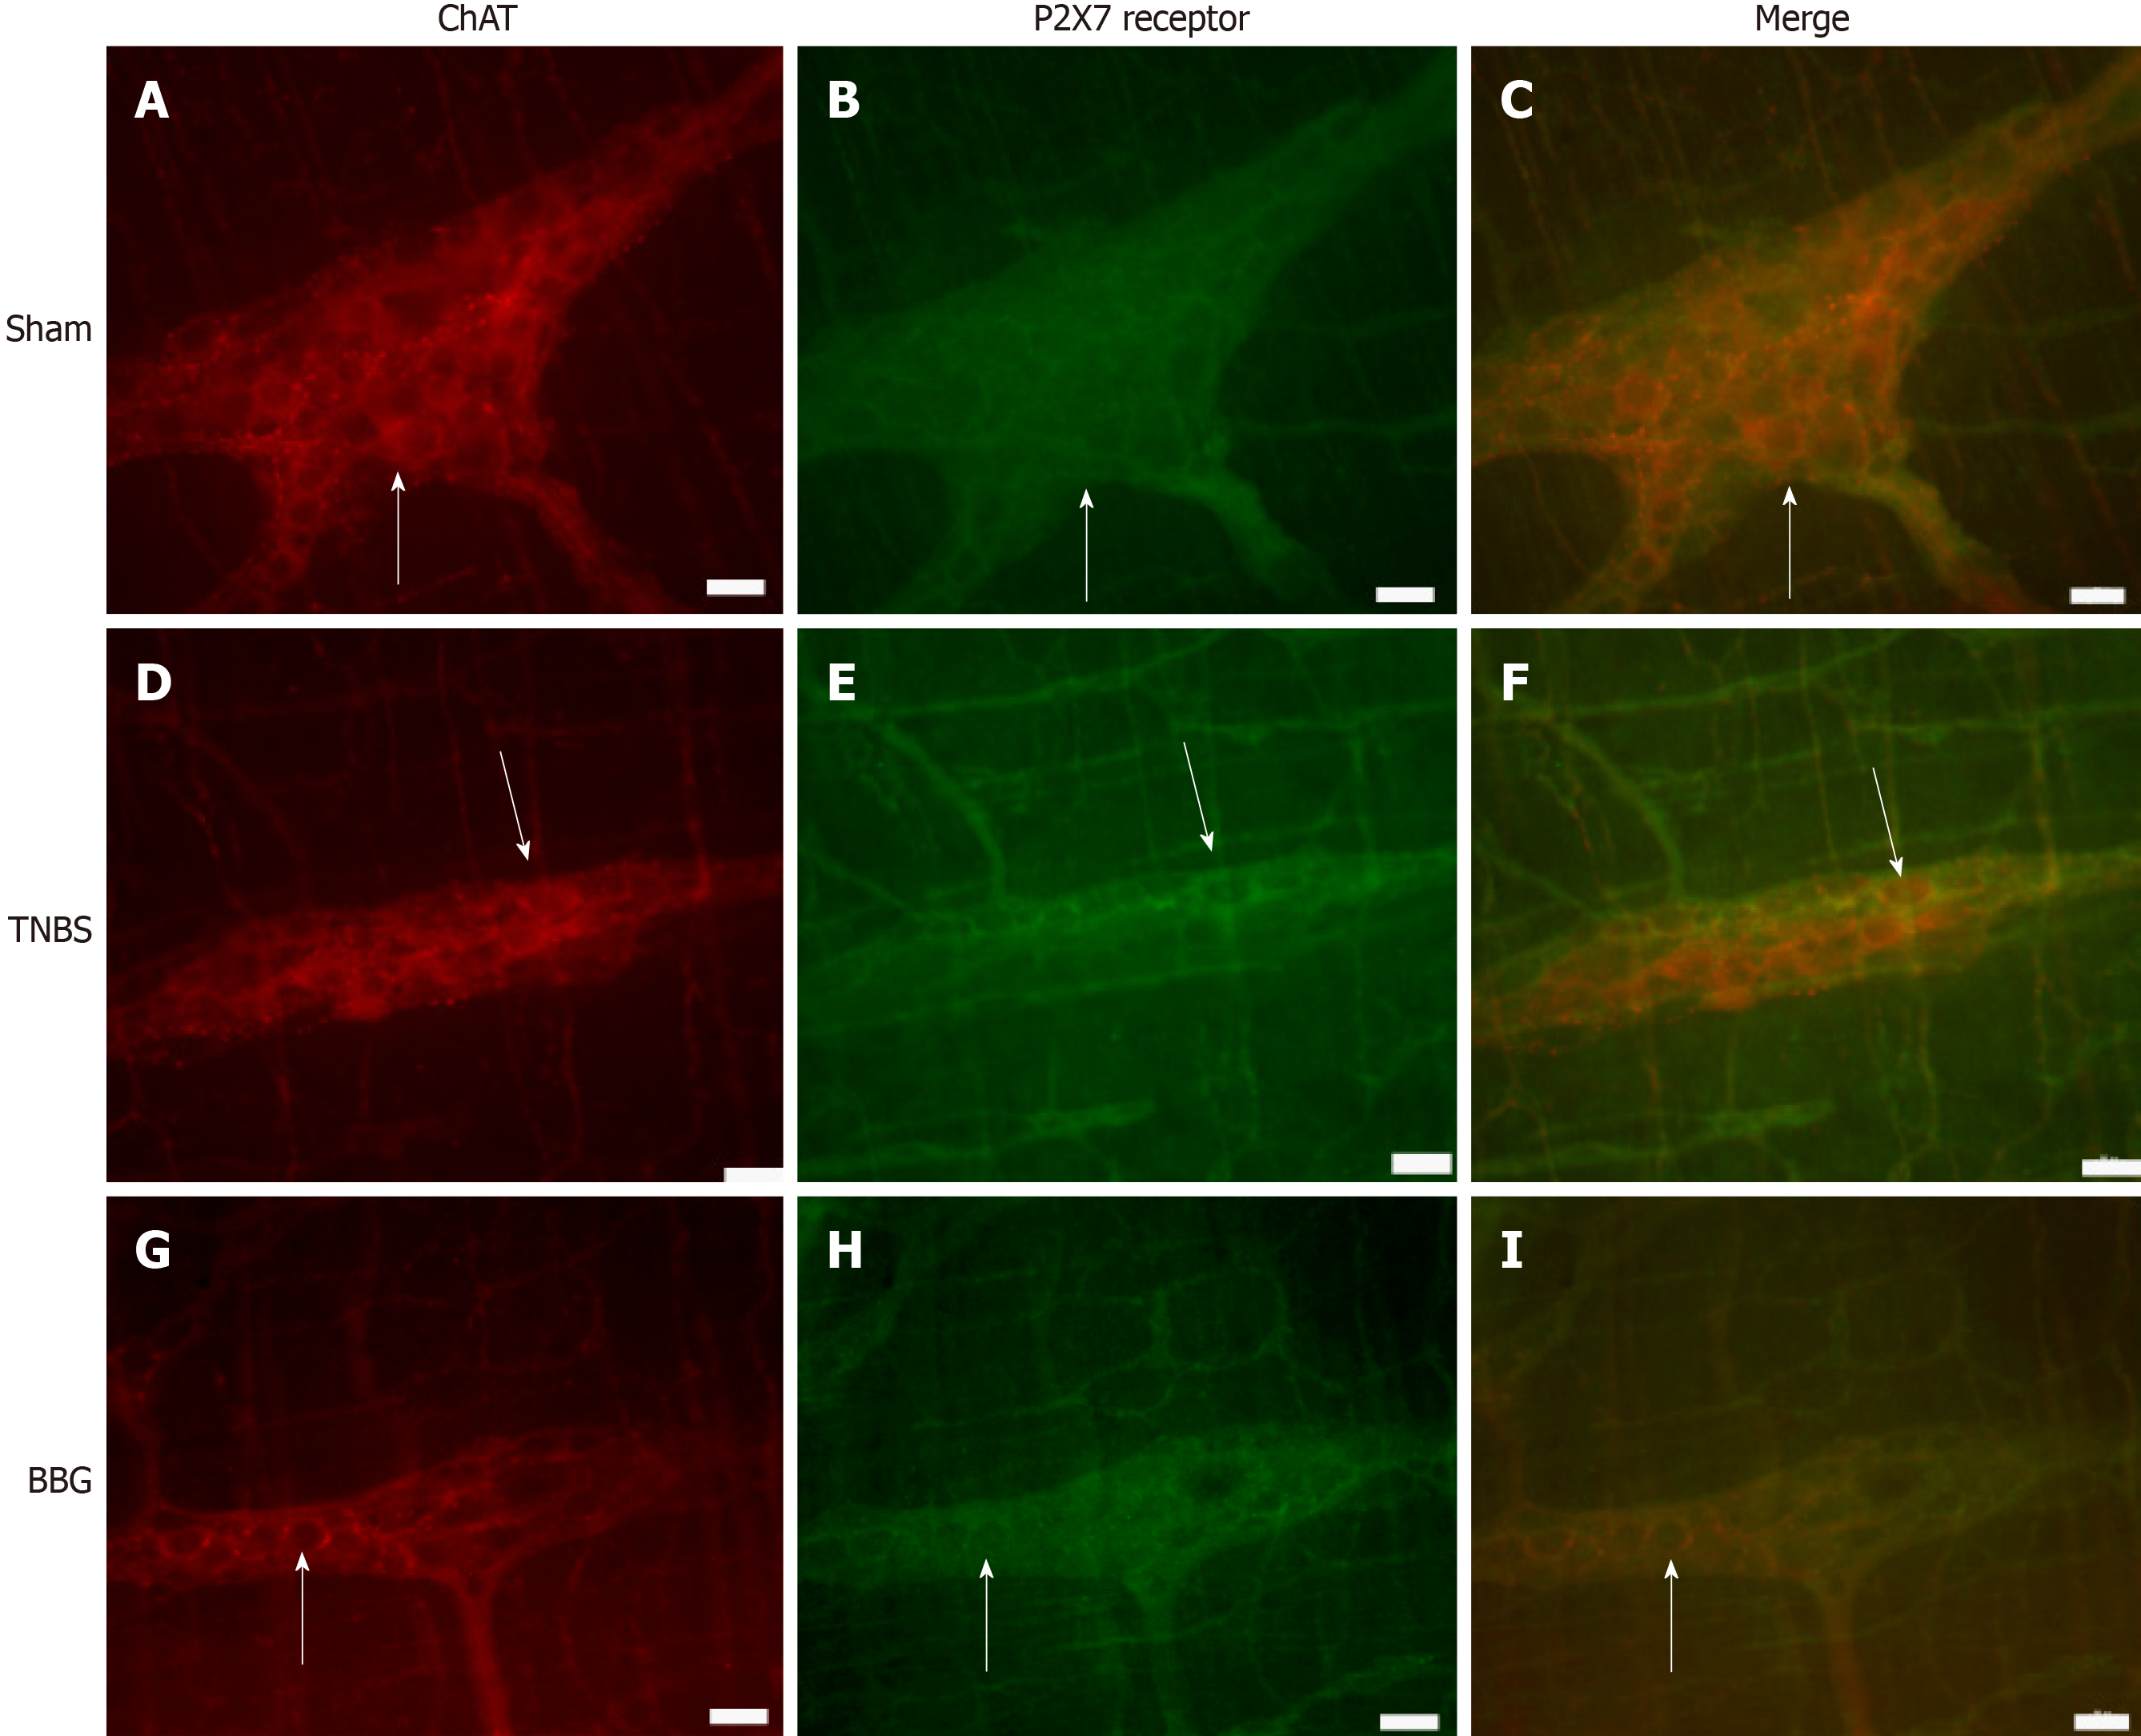
Figure 4 Colocalization of the P2X7 receptor with choline acetyltransferase in neurons of the rat ileum myenteric plexus in the sham, 2,4,6-trinitrobenzene sulfonic acid and brilliant blue G groups.
A-C: Sham group; D-F: 2,4,6-trinitrobenzene group; G-I: Brilliant blue G group. Choline acetyltransferase immunoreactivity (red; A, D, and G) colocalized with P2X7 immunoreactivity (green; B, E and H). Single arrows indicate double-labeled neurons. Scale bars = 50 µm. ChAT: Choline acetyltransferase; TNBS: 2,4,6-trinitrobenzene sulfonic acid; BBG: Brilliant blue G.
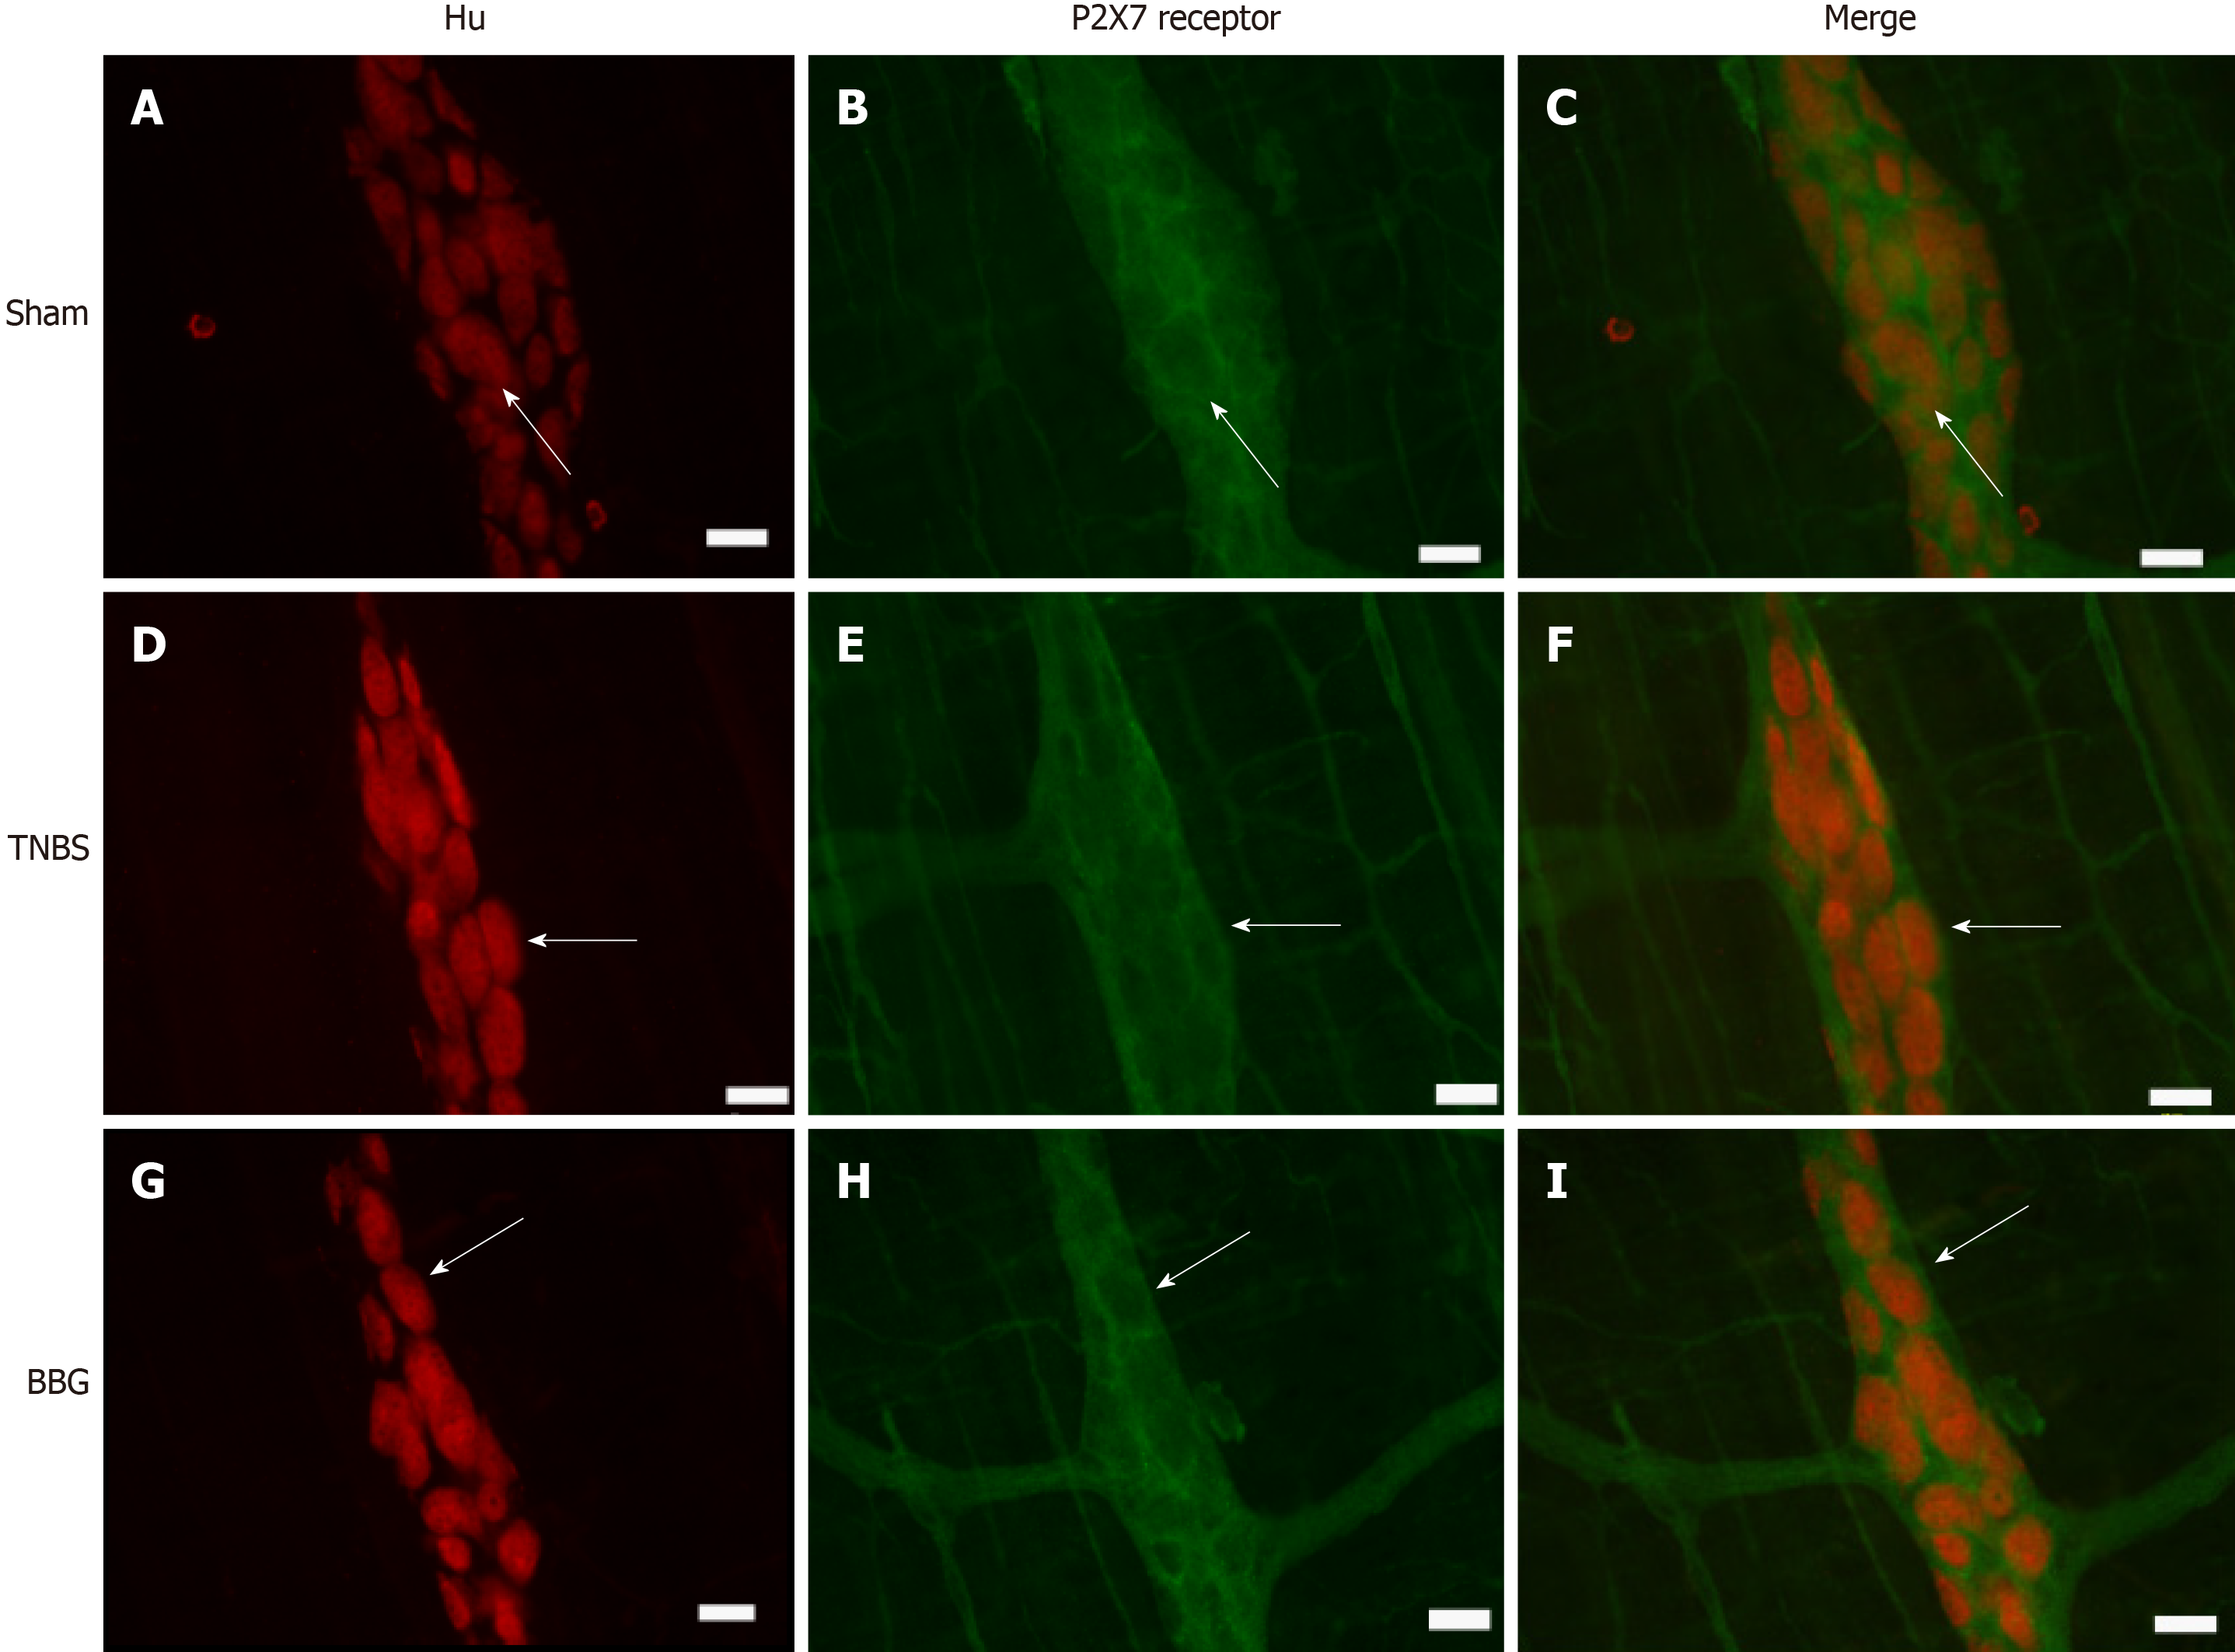
Figure 5 Colocalization of the P2X7 receptor with HuC/D in neurons of the rat ileum myenteric plexus in the sham, 2,4,6-trinitrobenzene sulfonic acid and brilliant blue G groups.
A-C: Sham group; D-F: 2,4,6-trinitrobenzene group; G-I: Brilliant blue G group. HuC/D immunoreactivity (red; A, D, and G) colocalized with P2X7 immunoreactivity (green; B, E and H). Single arrows indicate double-labeled neurons. Scale bars = 50 µm. TNBS: 2,4,6-trinitrobenzene sulfonic acid; BBG: Brilliant blue G.
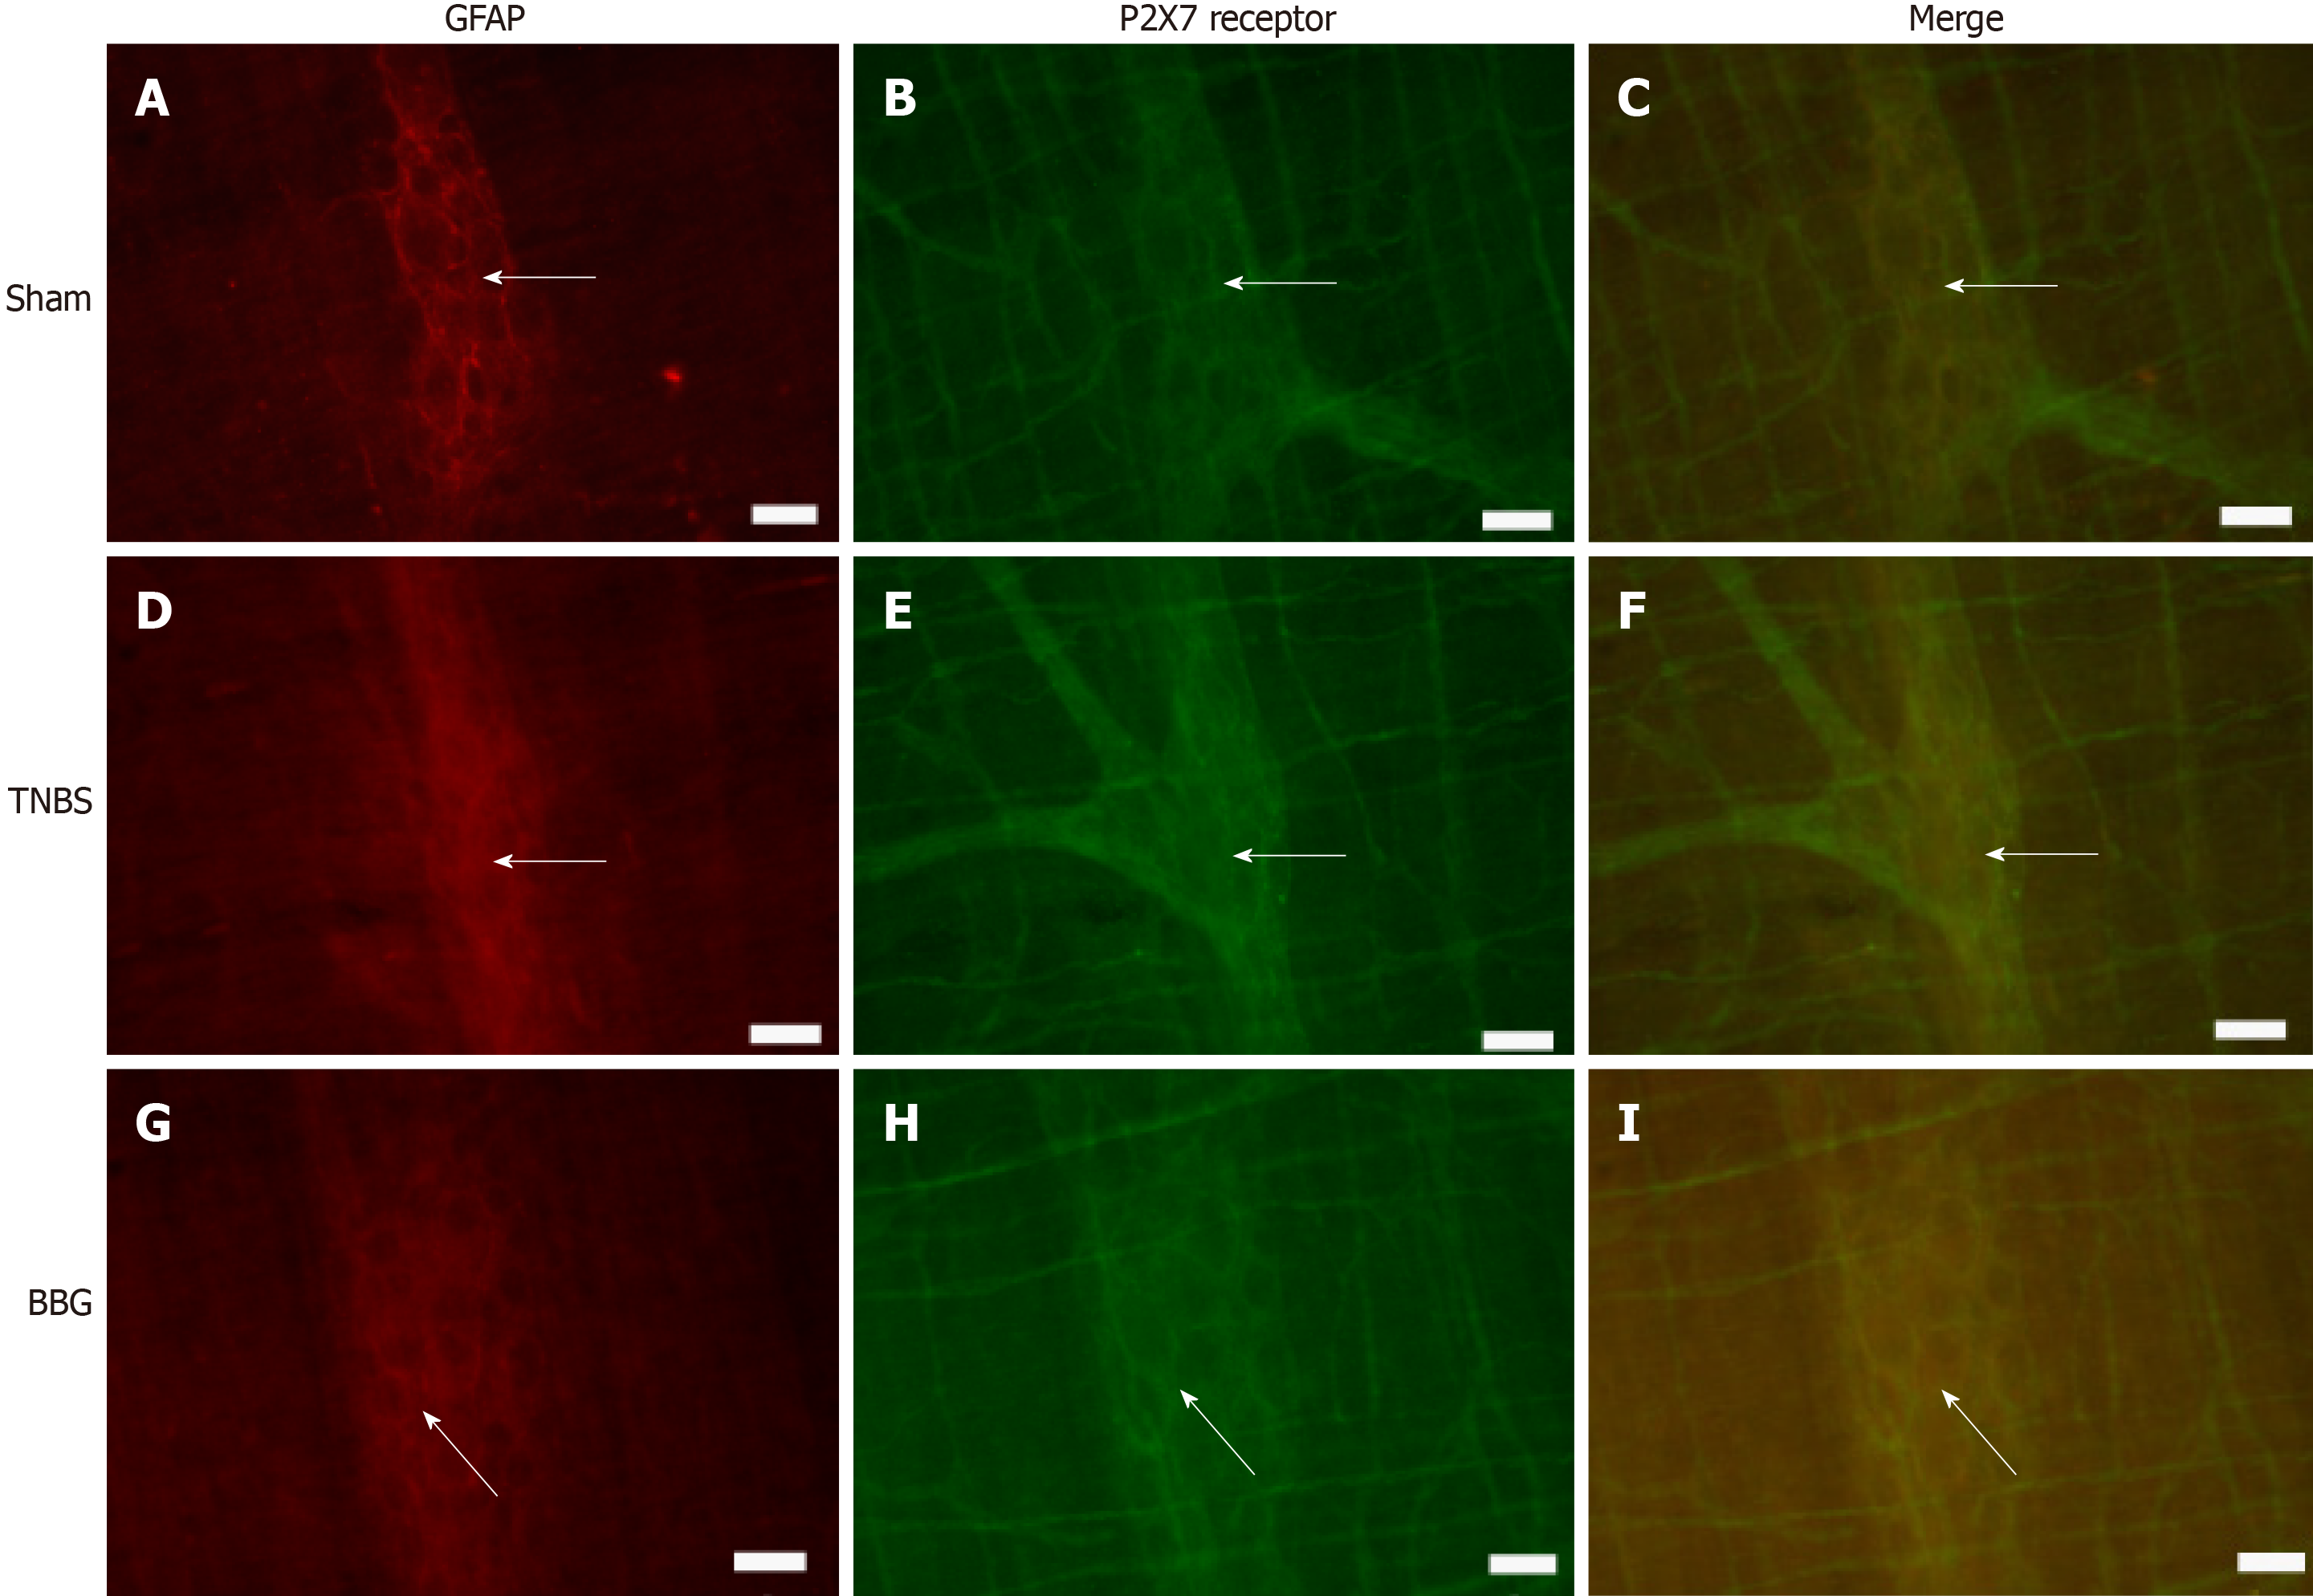
Figure 6 Colocalization of the P2X7 receptor with glial fibrillary acidic protein in the rat ileum myenteric plexus in the sham, 2,4,6-trinitrobenzene sulfonic acid and brilliant blue G groups.
A-C: Sham group; D-F: 2,4,6-trinitrobenzene group; G-I: Brilliant blue G group. GFAP immunoreactivity (red; A, D, and G) colocalized with P2X7 immunoreactivity (green; B, E and H). Single arrows indicate double-labeled enteric glial cells. Scale bars = 50 µm. GFAP: Glial fibrillary acidic protein; TNBS: 2,4,6-trinitrobenzene sulfonic acid; BBG: Brilliant blue G.
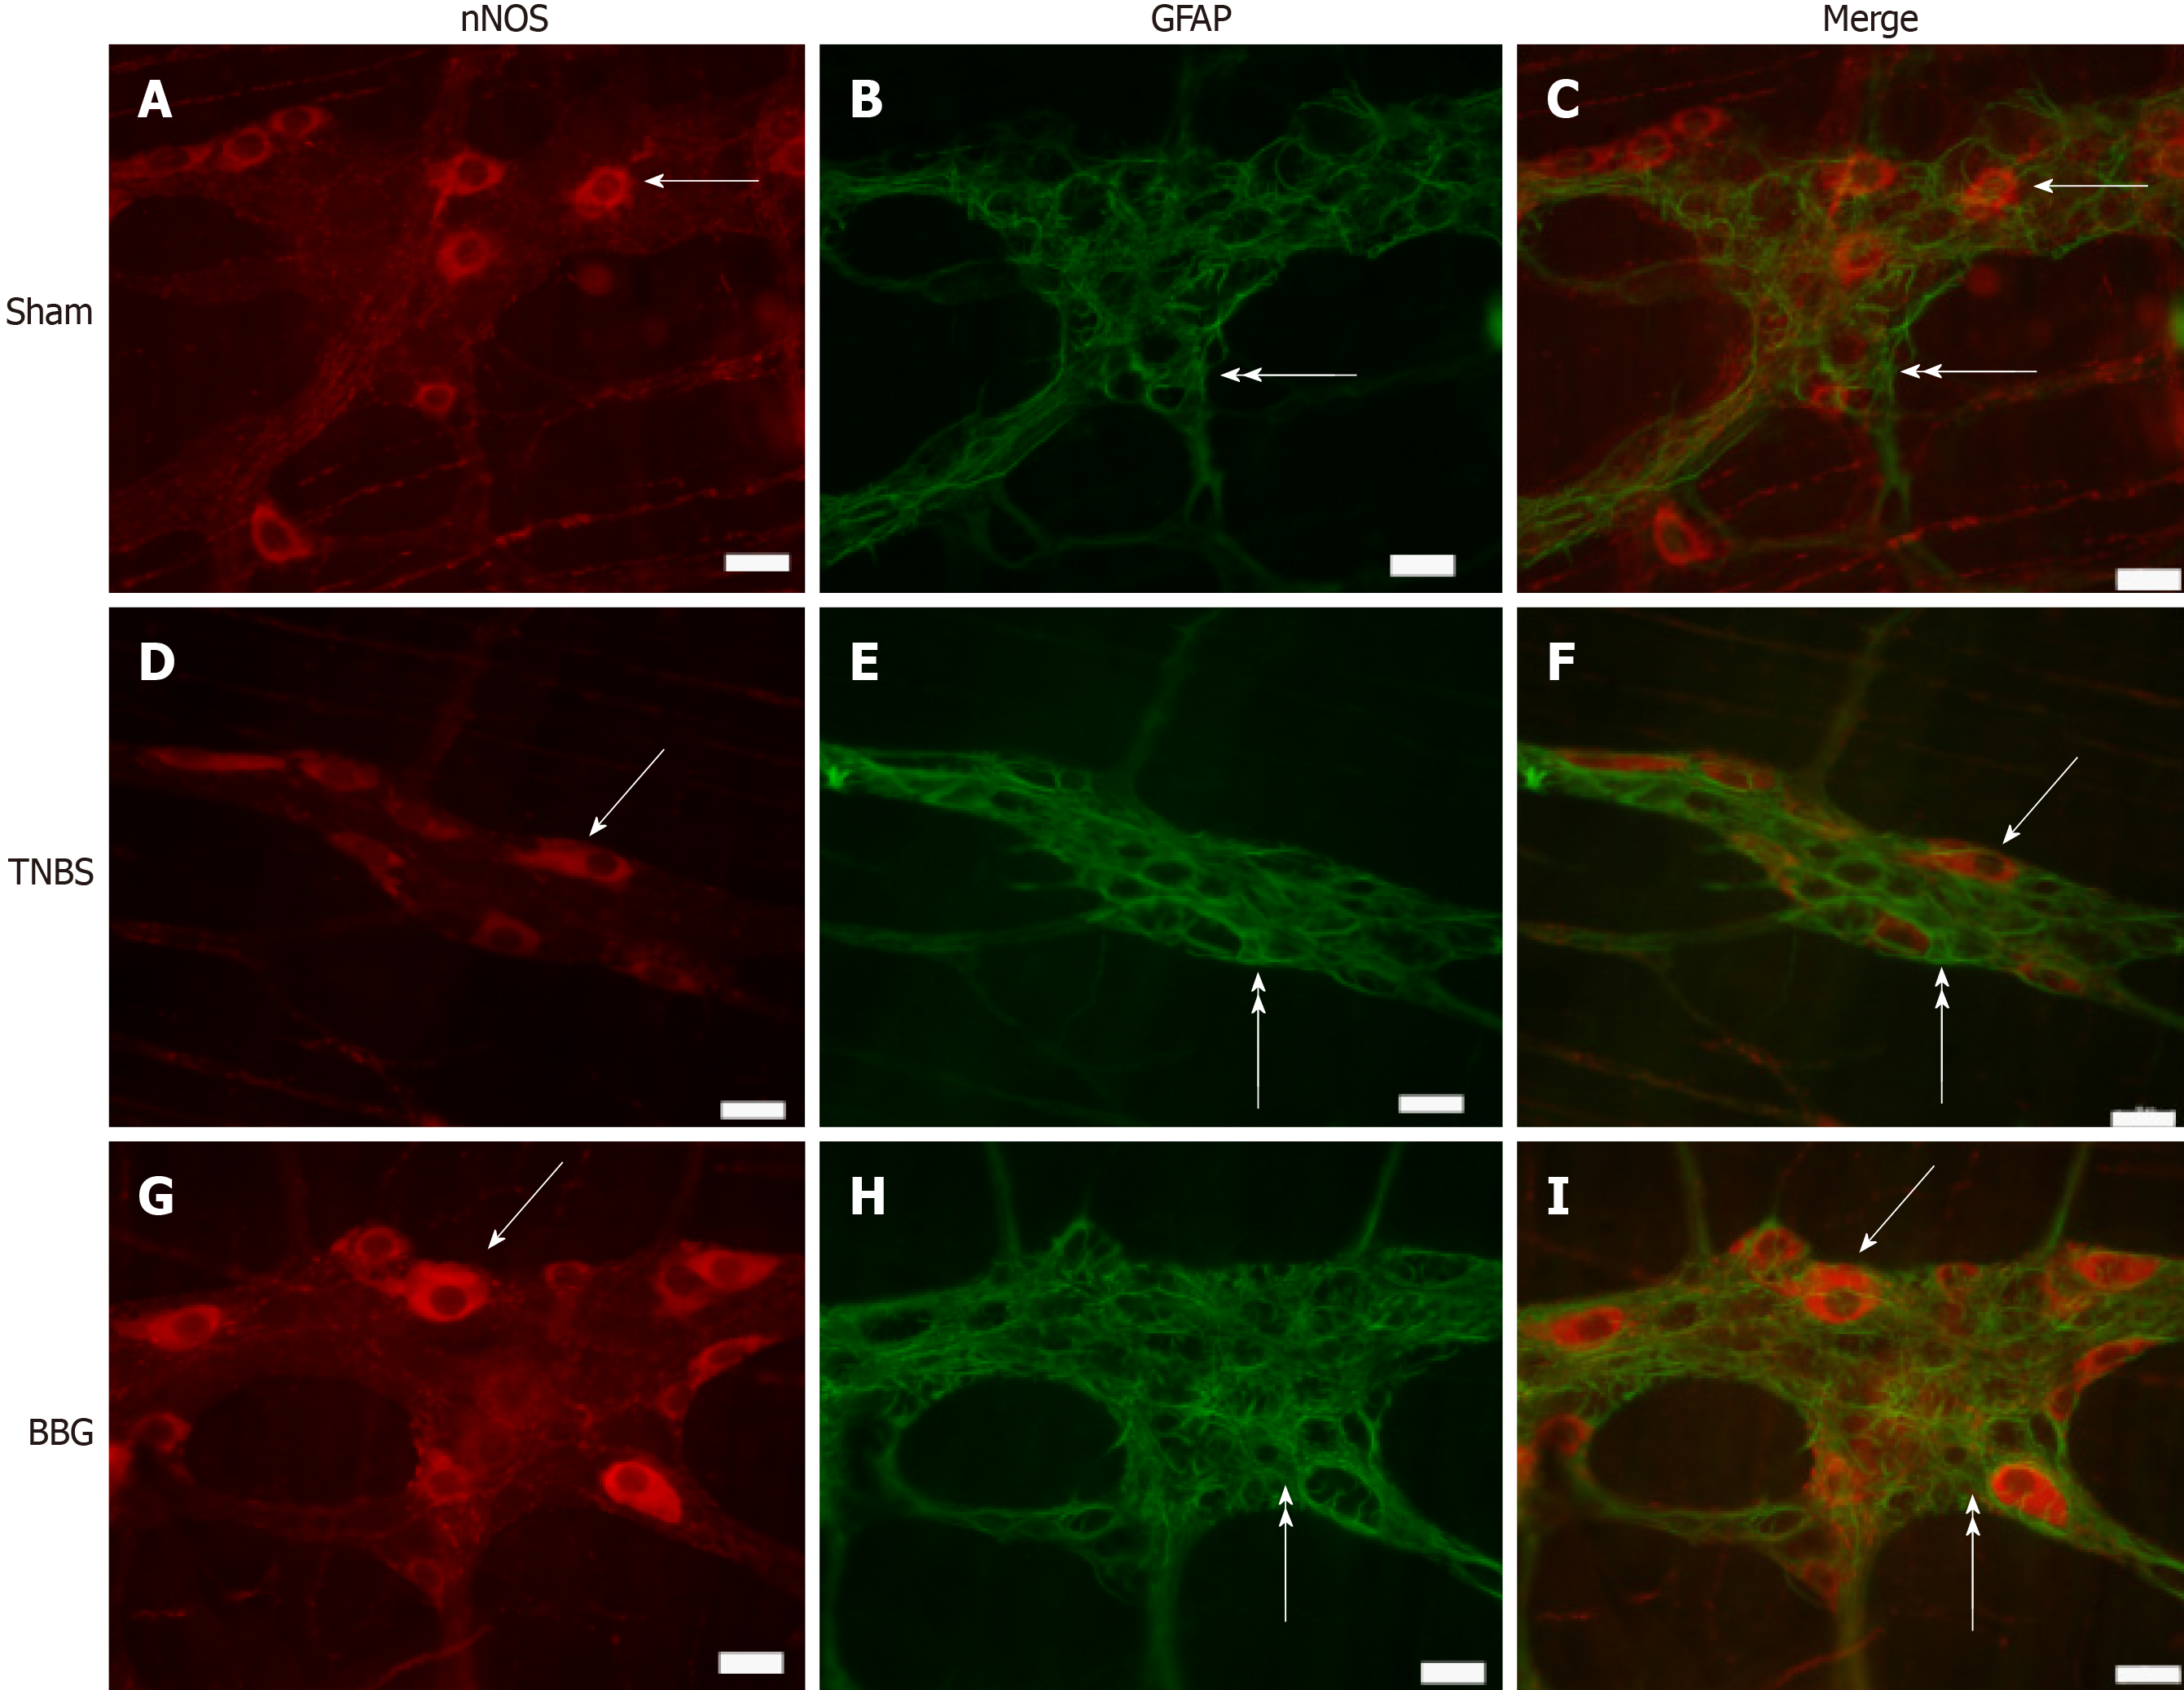
Figure 7 Double labeling of neuronal nitric oxide synthase and glial fibrillary acidic protein in the rat ileum myenteric plexus in the sham, 2,4,6-trinitrobenzene sulfonic acid and brilliant blue G groups.
A-C: Sham group; D-F: 2,4,6-trinitrobenzene group; G-I: Brilliant blue G group. Neuronal nitric oxide synthase immunoreactivity (red; A, D, and G) did not colocalize with glial fibrillary acidic protein immunoreactivity (green; B, E and H). Single arrows indicate labeling of neuronal nitric oxide synthase-positive neurons, and double arrows indicate enteric glial cell positivity. Scale bars = 50 µm. nNOS: Neuronal nitric oxide synthase; GFAP: Glial fibrillary acidic protein; TNBS: 2,4,6-trinitrobenzene sulfonic acid; BBG: Brilliant blue G.
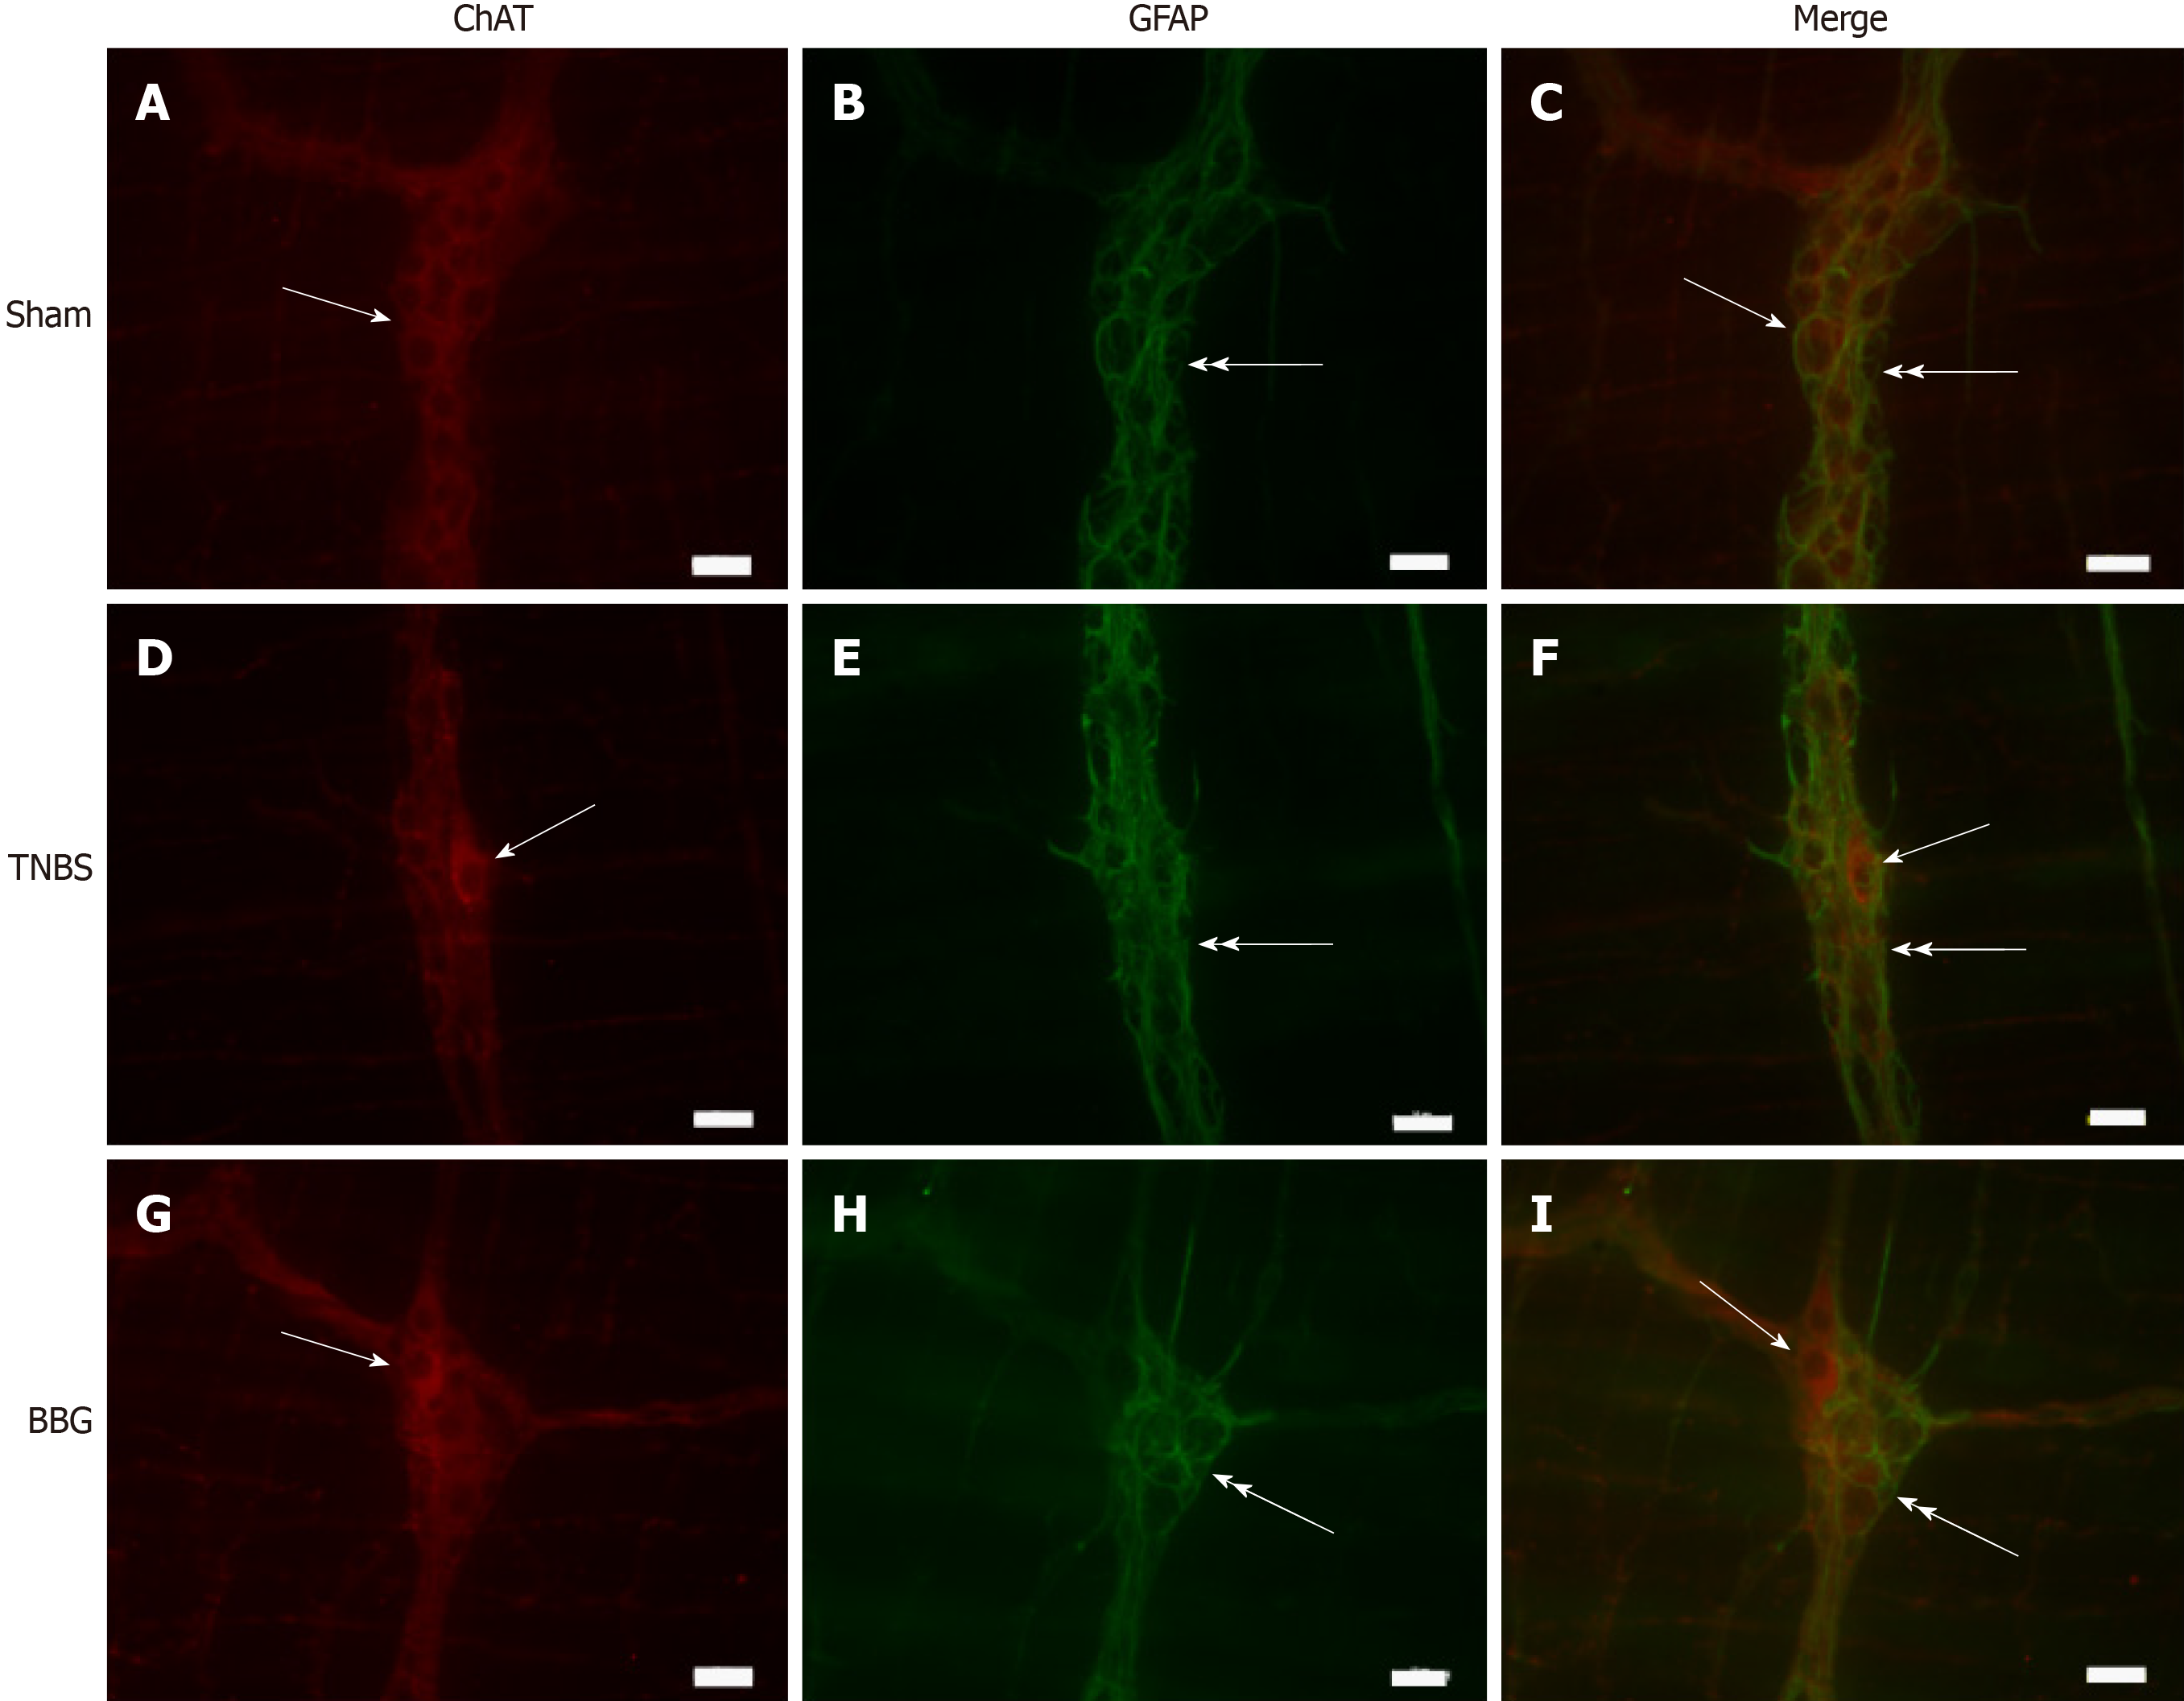
Figure 8 Double labeling of choline acetyltransferase with glial fibrillary acidic protein in the rat ileum myenteric plexus in the sham, 2,4,6-trinitrobenzene sulfonic acid and brilliant blue G groups.
A-C: Sham group; D-F: 2,4,6-trinitrobenzene group; G-I: Brilliant blue G group. Choline acetyltransferase immunoreactivity (red; A, D, and G) did not colocalize with glial fibrillary acidic protein immunoreactivity (green; B, E and H). Single arrows indicate choline acetyltransferase-positive neurons, and double arrows indicate enteric glial cell positivity. Scale bars = 50 µm. ChAT: Choline acetyltransferase; GFAP: Glial fibrillary acidic protein; TNBS: 2,4,6-trinitrobenzene sulfonic acid; BBG: Brilliant blue G.
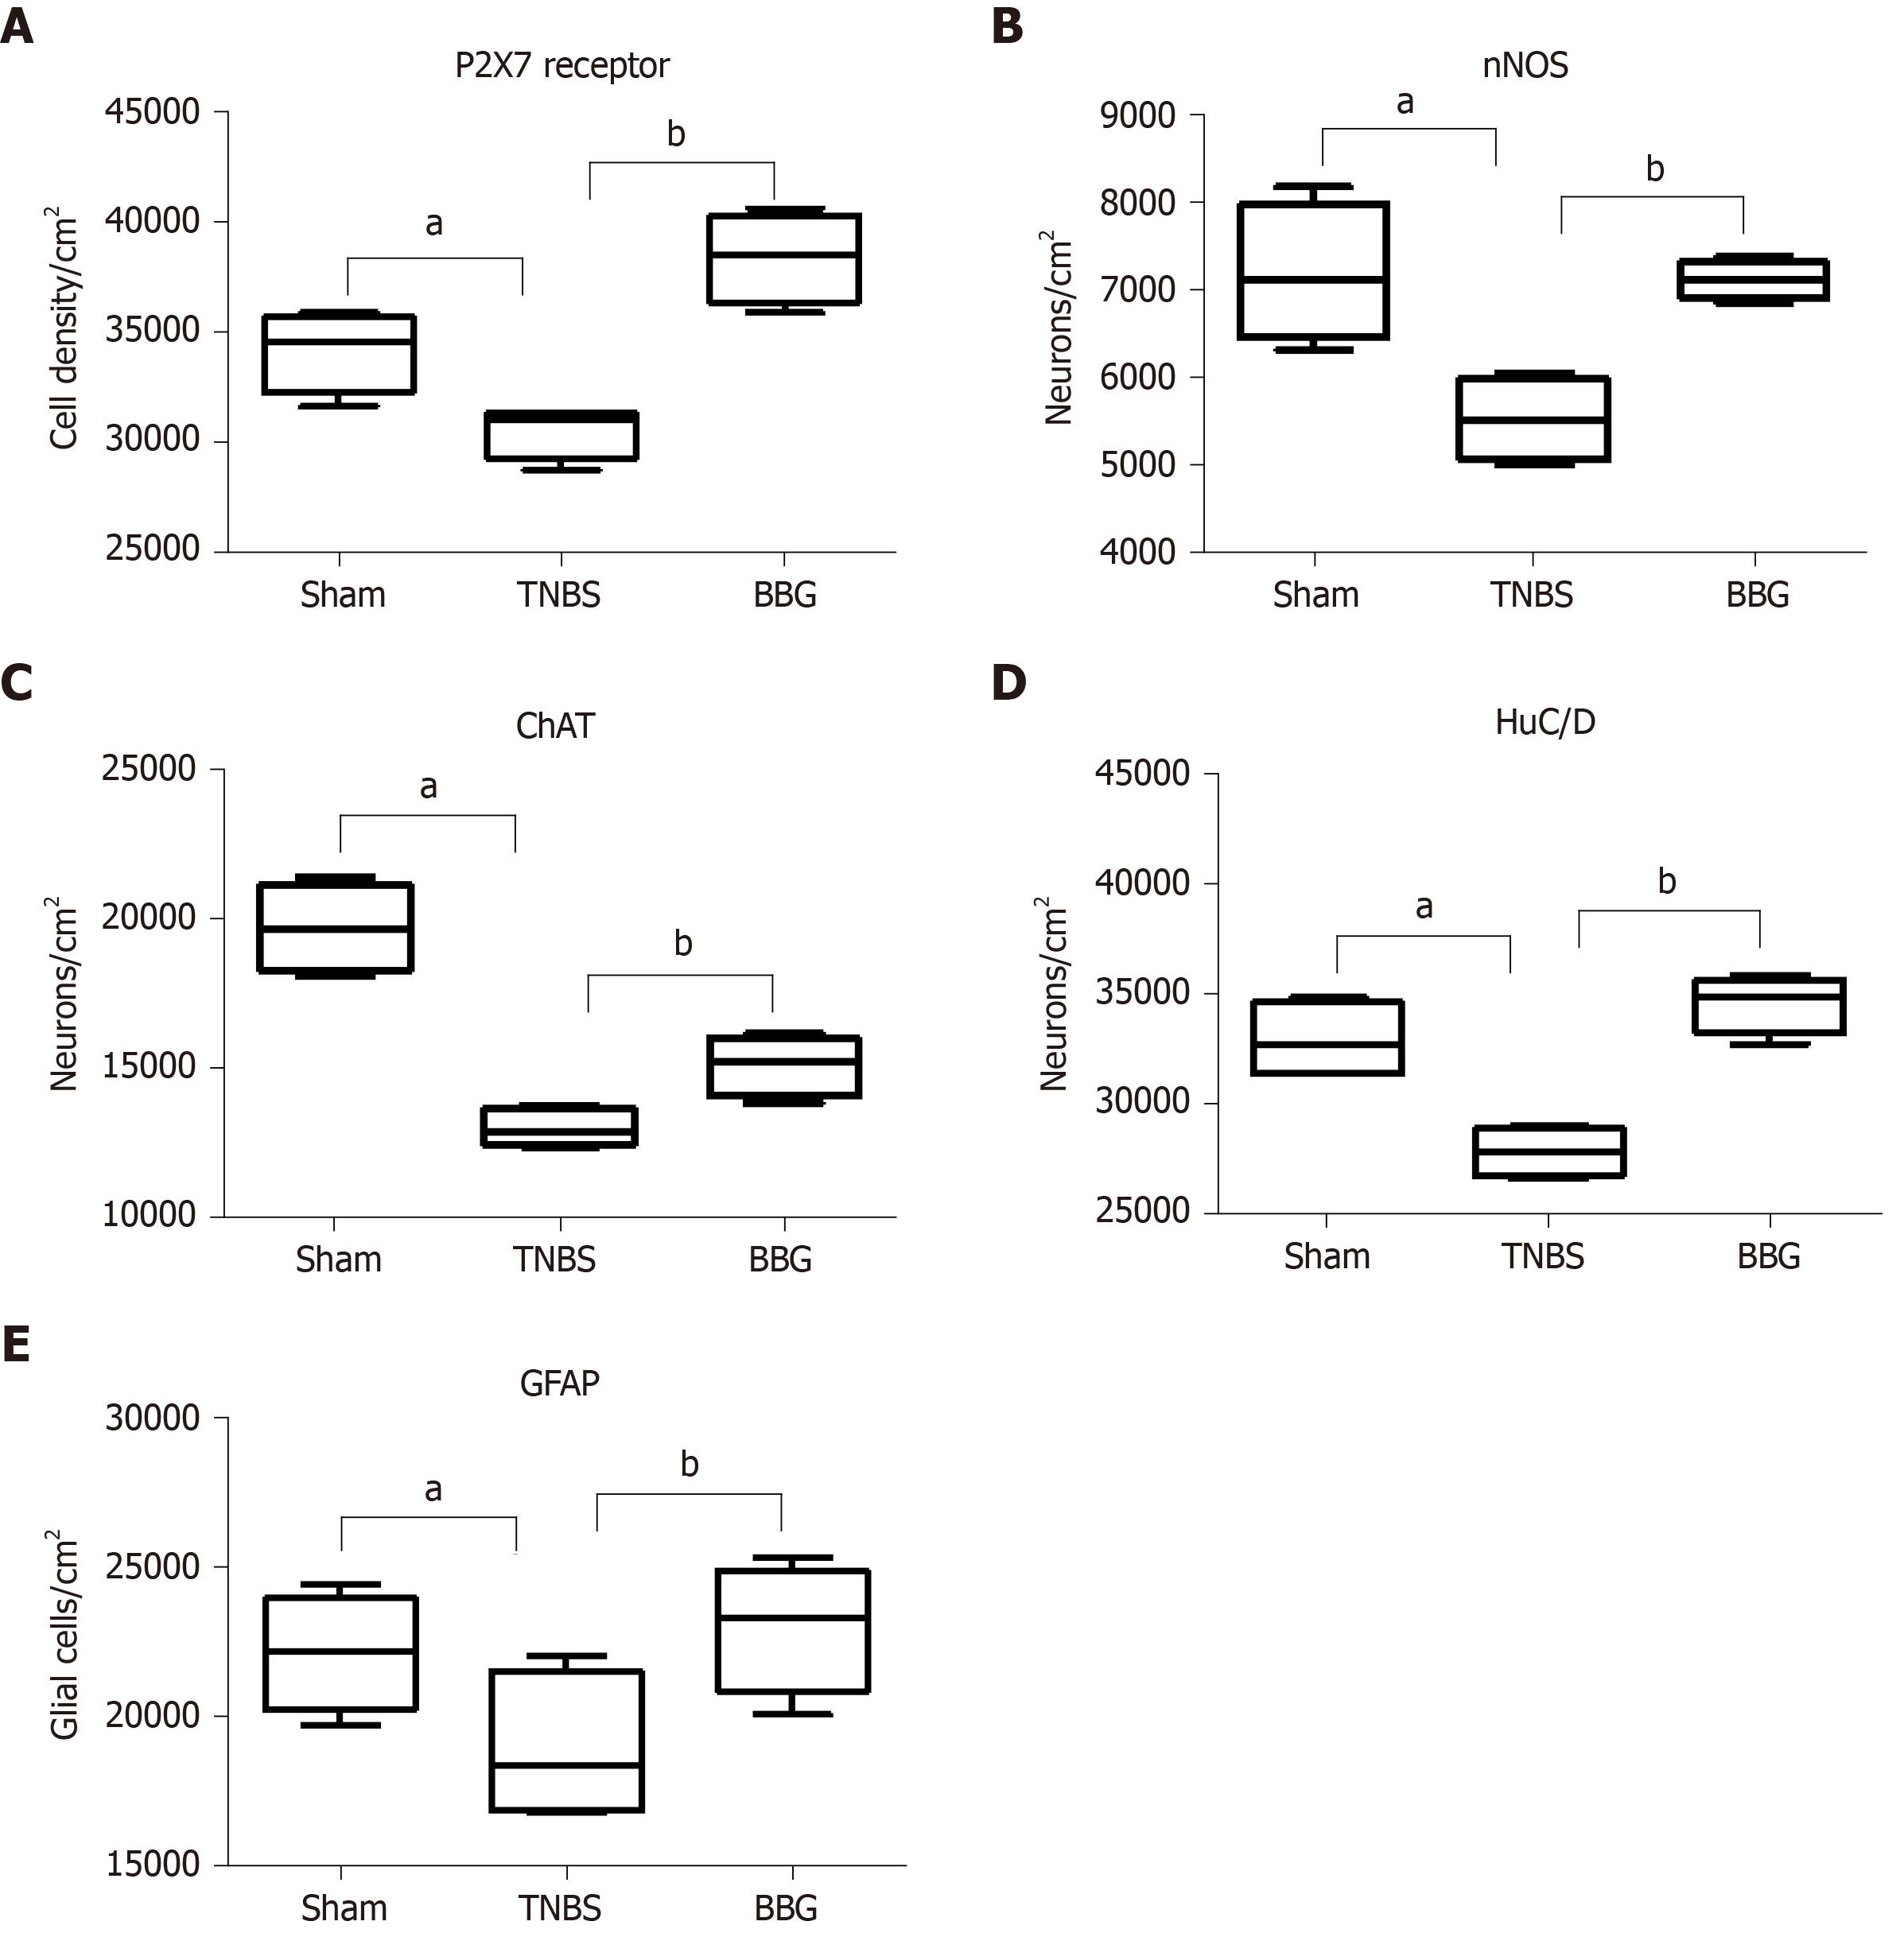
Figure 9 Density of neurons expression in neurons of the rat ileum myenteric plexus in the sham, 2,4,6-trinitrobenzene sulfonic acid and brilliant blue G groups.
A: P2X7 receptor; B: Neuronal nitric oxide synthase; C: Choline acetyltransferase; D: HuC/D; E: Glial fibrillary acidic protein. Counts were made in 40 representative fields for each antigen from each animal from the sham (n = 5), 2,4,6-trinitrobenzene sulfonic acid (TNBS) (n = 5) and brilliant blue G (BBG) groups (n = 5). Data were compared using analysis of variance and Tukey’s test for multiple comparisons as appropriate. P < 0.05 was considered statistically significant. aP < 0.05, comparing the TNBS group and sham group; bP < 0.05, comparing the BBG group and TNBS group. The data are expressed as mean ± SE. nNOS: Neuronal nitric oxide synthase; ChAT: Choline acetyltransferase; GFAP: Glial fibrillary acidic protein; TNBS: 2,4,6-trinitrobenzene sulfonic acid; BBG: Brilliant blue G.
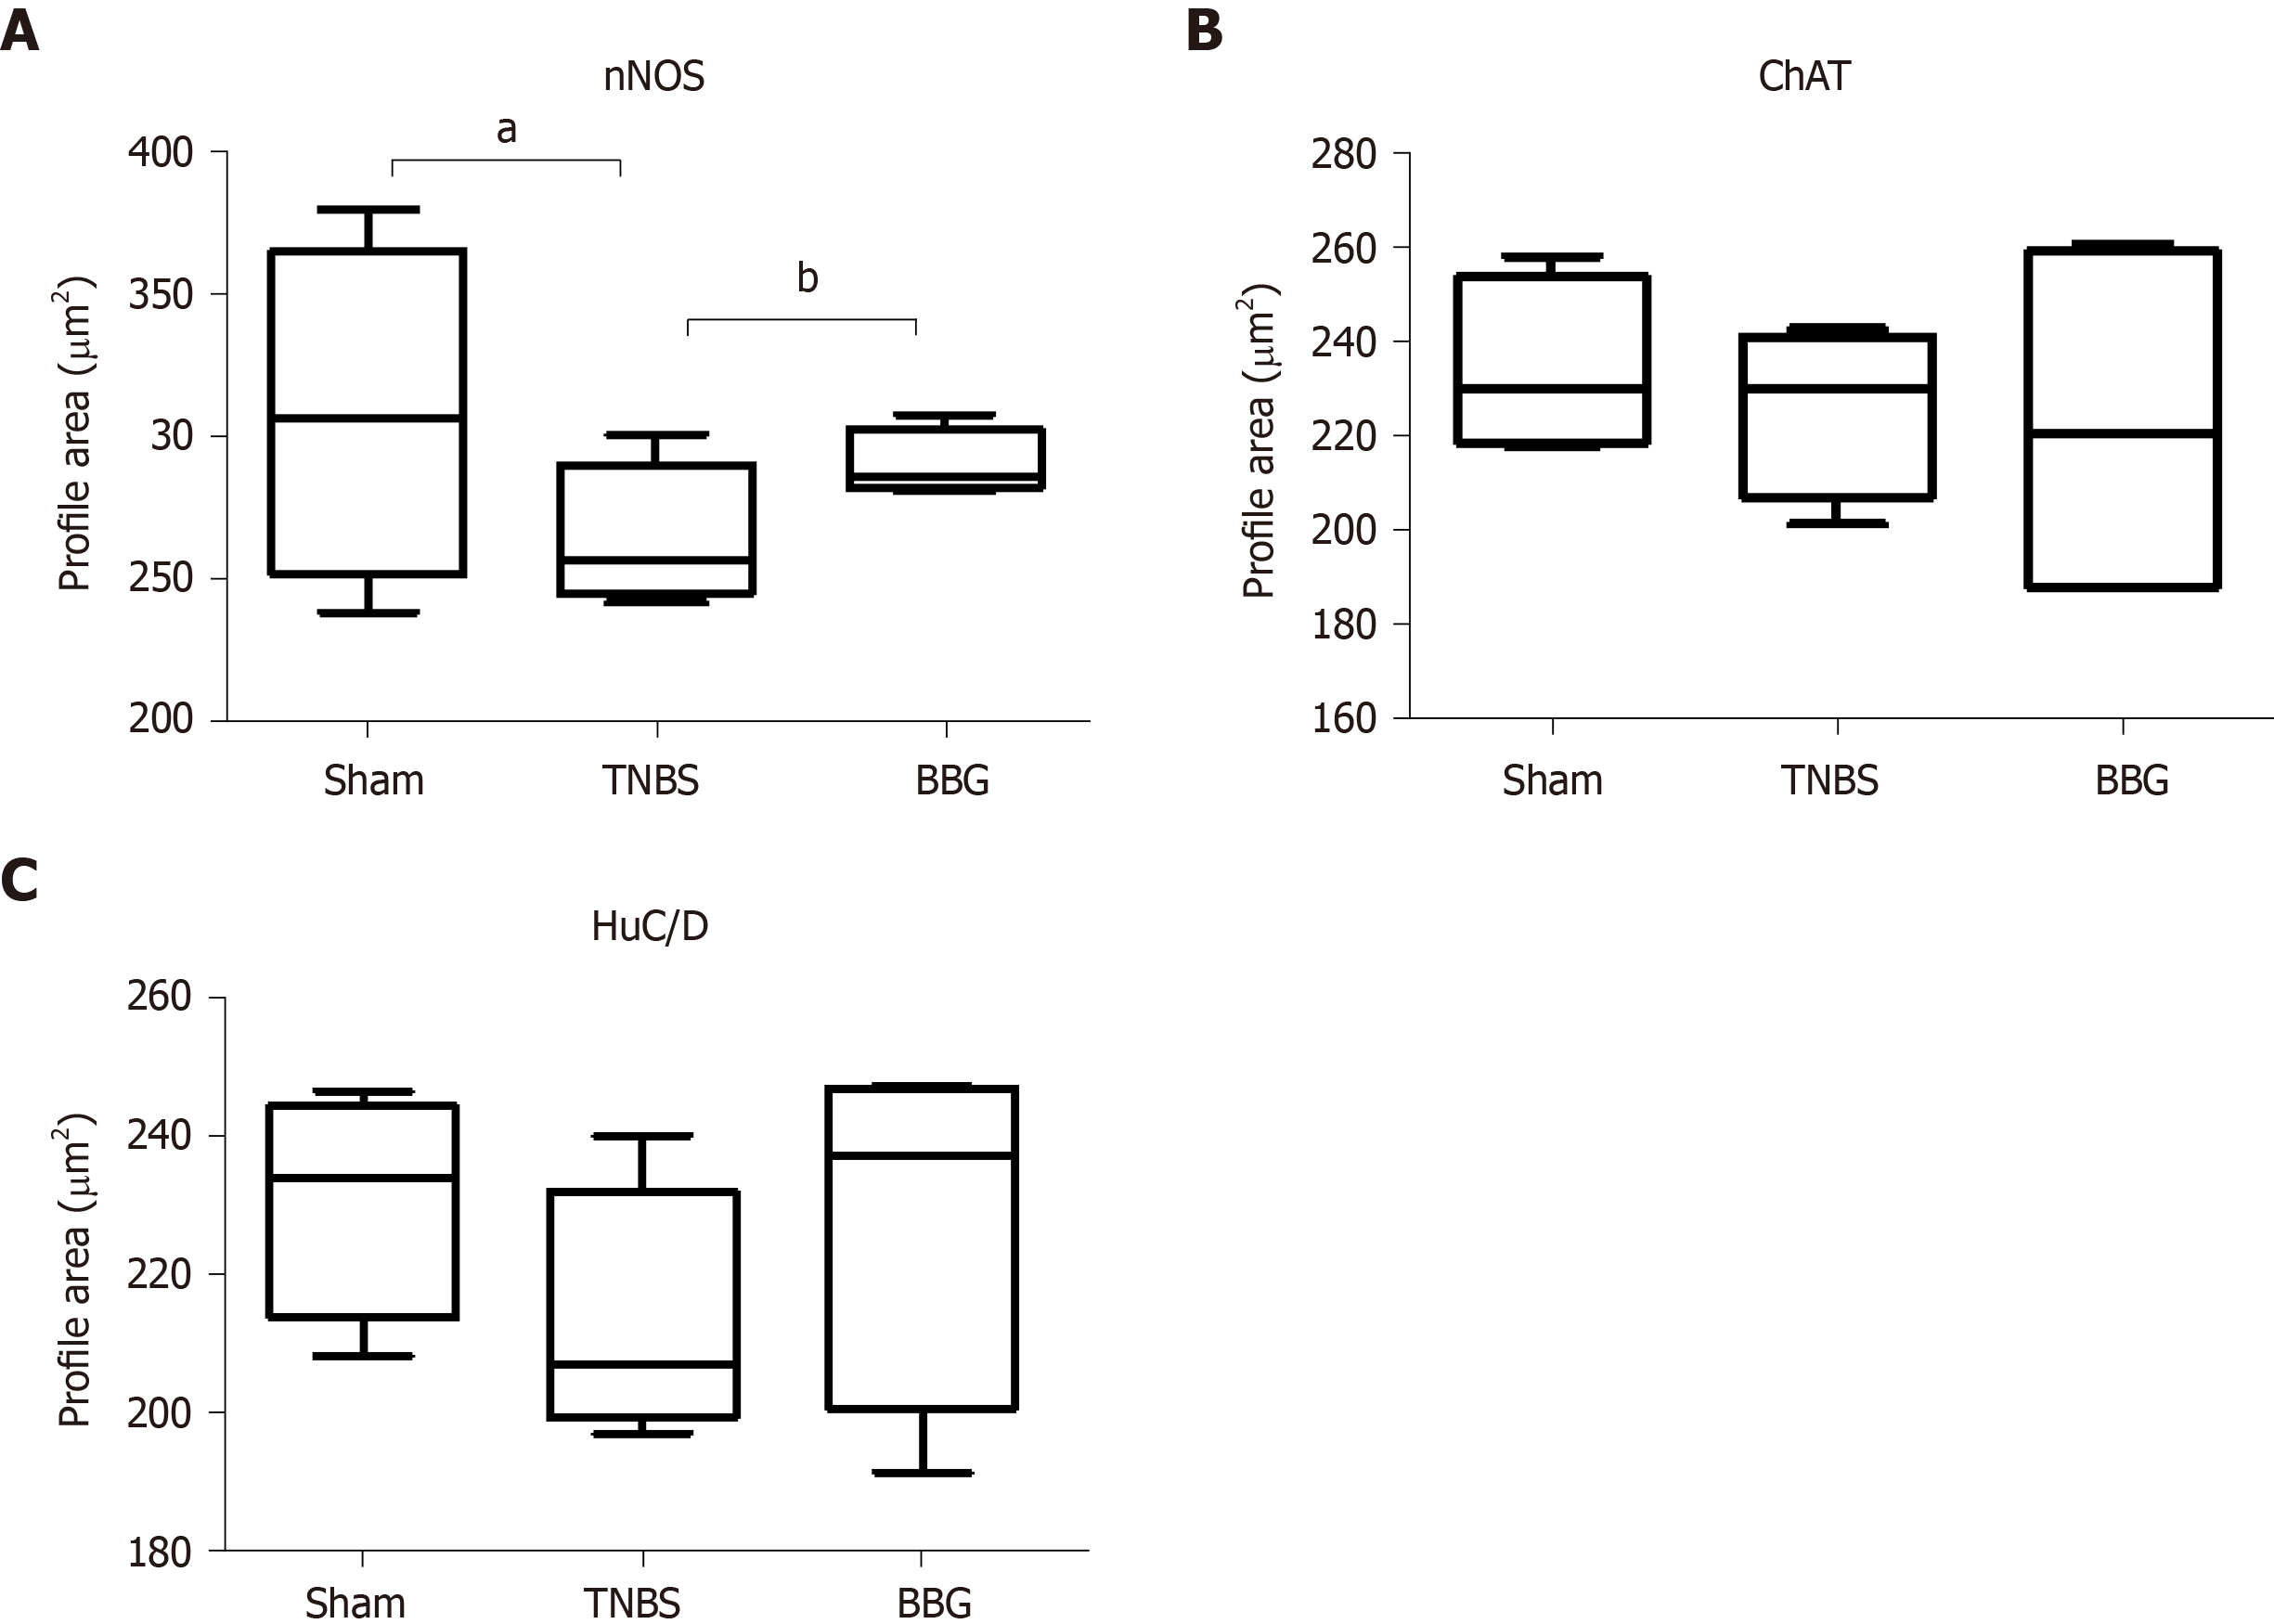
Figure 10 Cell body profile areas of neurons immunoreactive in neurons of the rat ileum myenteric plexus in the sham, 2,4,6-trinitrobenzene sulfonic acid and brilliant blue G groups.
A: Neuronal nitric oxide synthase (nNOS); B: Choline acetyltransferase (ChAT); C: HuC/D. The cell perikaryal profile areas (µm2) of 100 neurons from each animal were obtained in the sham (n = 5), 2,4,6-trinitrobenzene sulfonic acid (TNBS) (n = 5) and Brilliant blue G (BBG) groups (n = 5). A total of 500 cell profile areas were analyzed for each group. Data were compared using analysis of variance and Tukey’s test for multiple comparisons as appropriate. P < 0.05 was considered statistically significant. aP < 0.05, comparing the TNBS group and sham group; bP < 0.05, comparing the BBG group and TNBS group. The data are expressed as mean ± SE. nNOS: Neuronal nitric oxide synthase; ChAT: Choline acetyltransferase; TNBS: 2,4,6-trinitrobenzene sulfonic acid; BBG: Brilliant blue G.
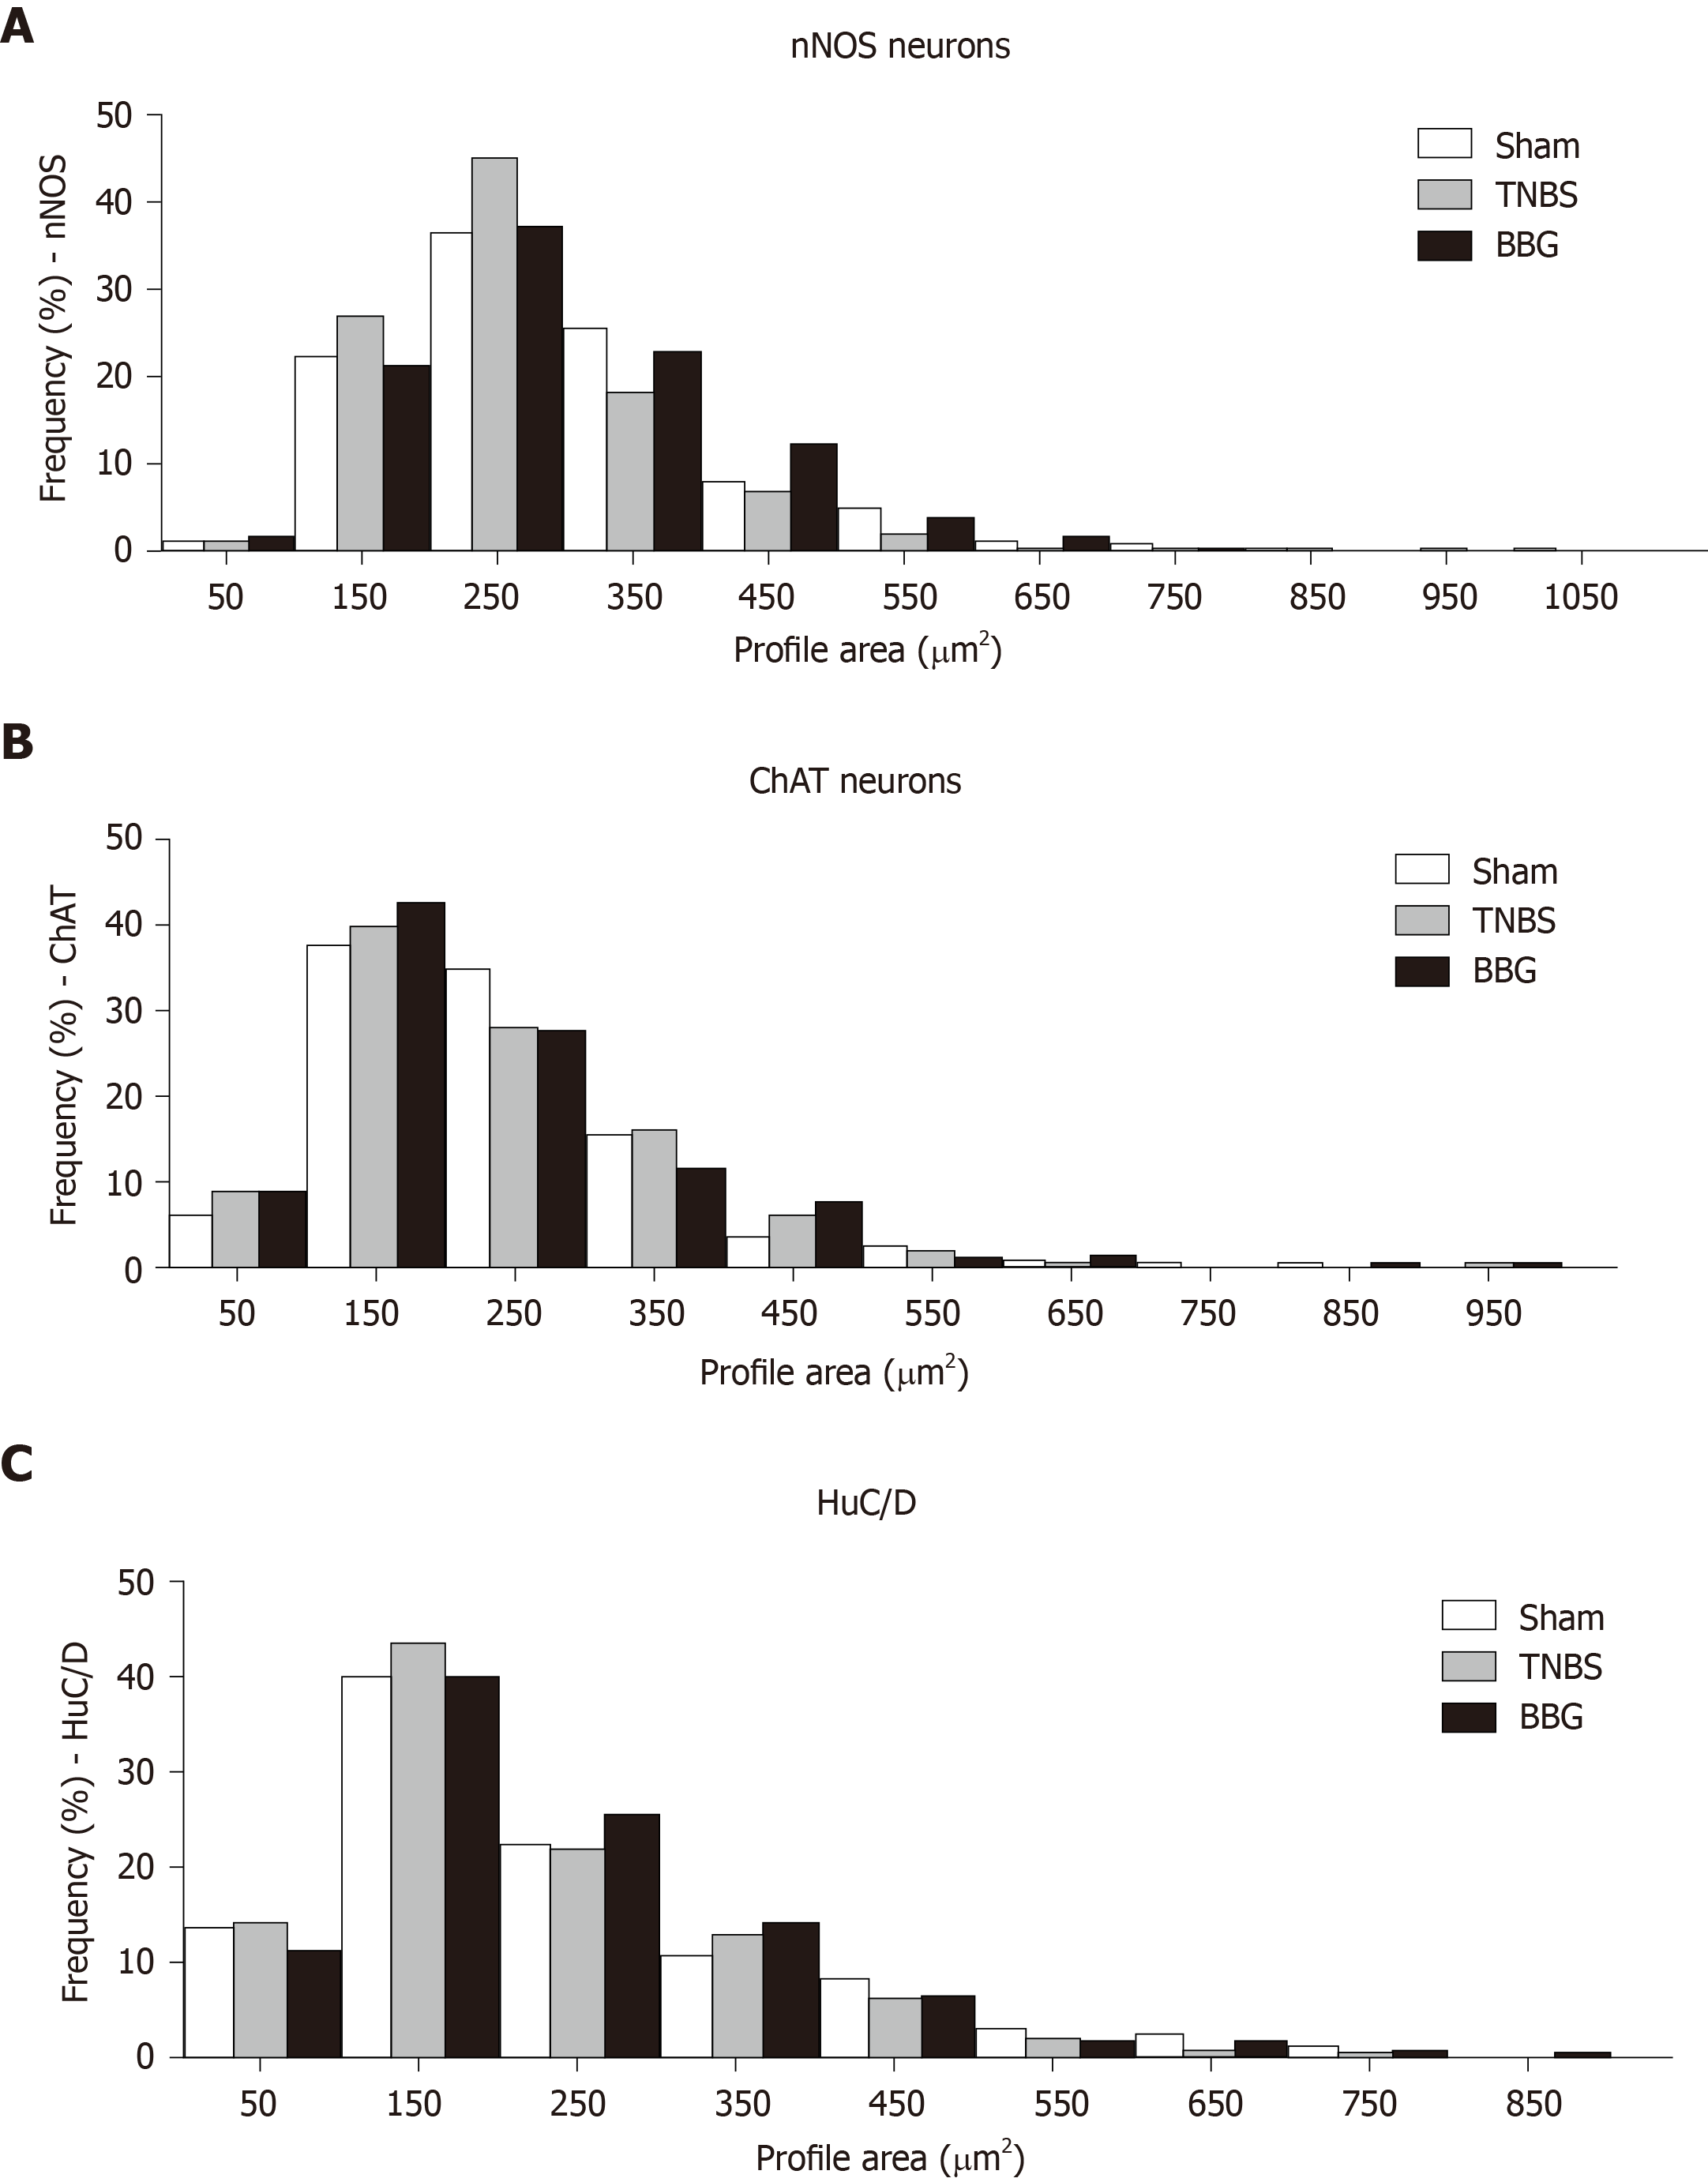
Figure 11 Frequency distribution in cell profiles of neuronal immunoreactivity of neurons among neurons of the rat ileum myenteric plexus in the sham, 2,4,6-trinitrobenzene sulfonic acid and brilliant blue G groups.
A: Neuronal nitric oxide synthase (nNOS); B: Choline acetyltransferase (ChAT); C: HuC/D. The size of nNOS-immunoreactive neurons ranged from 50-1050 μm2. The size of ChAT-immunoreactive neurons ranged from 50-950 μm2. The size of HuC/D neurons ranged from 50-850 μm2. The cell perikaryal profile areas of 100 neurons positive for nNOS, ChAT and HuC/D cells from each animal were obtained in the sham (n = 5), 2,4,6-trinitrobenzene sulfonic acid (n = 5) and brilliant blue G groups (n = 5). nNOS: Neuronal nitric oxide synthase; ChAT: Choline acetyltransferase; TNBS: 2,4,6-trinitrobenzene sulfonic acid; BBG: Brilliant blue G.
- Citation: Souza RF, Evangelinellis MM, Mendes CE, Righetti M, Lourenço MCS, Castelucci P. P2X7 receptor antagonist recovers ileum myenteric neurons after experimental ulcerative colitis. World J Gastrointest Pathophysiol 2020; 11(4): 84-103
- URL: https://www.wjgnet.com/2150-5330/full/v11/i4/84.htm
- DOI: https://dx.doi.org/10.4291/wjgp.v11.i4.84


