Copyright
©The Author(s) 2020.
World J Gastrointest Pathophysiol. Jun 20, 2020; 11(4): 84-103
Published online Jun 20, 2020. doi: 10.4291/wjgp.v11.i4.84
Published online Jun 20, 2020. doi: 10.4291/wjgp.v11.i4.84
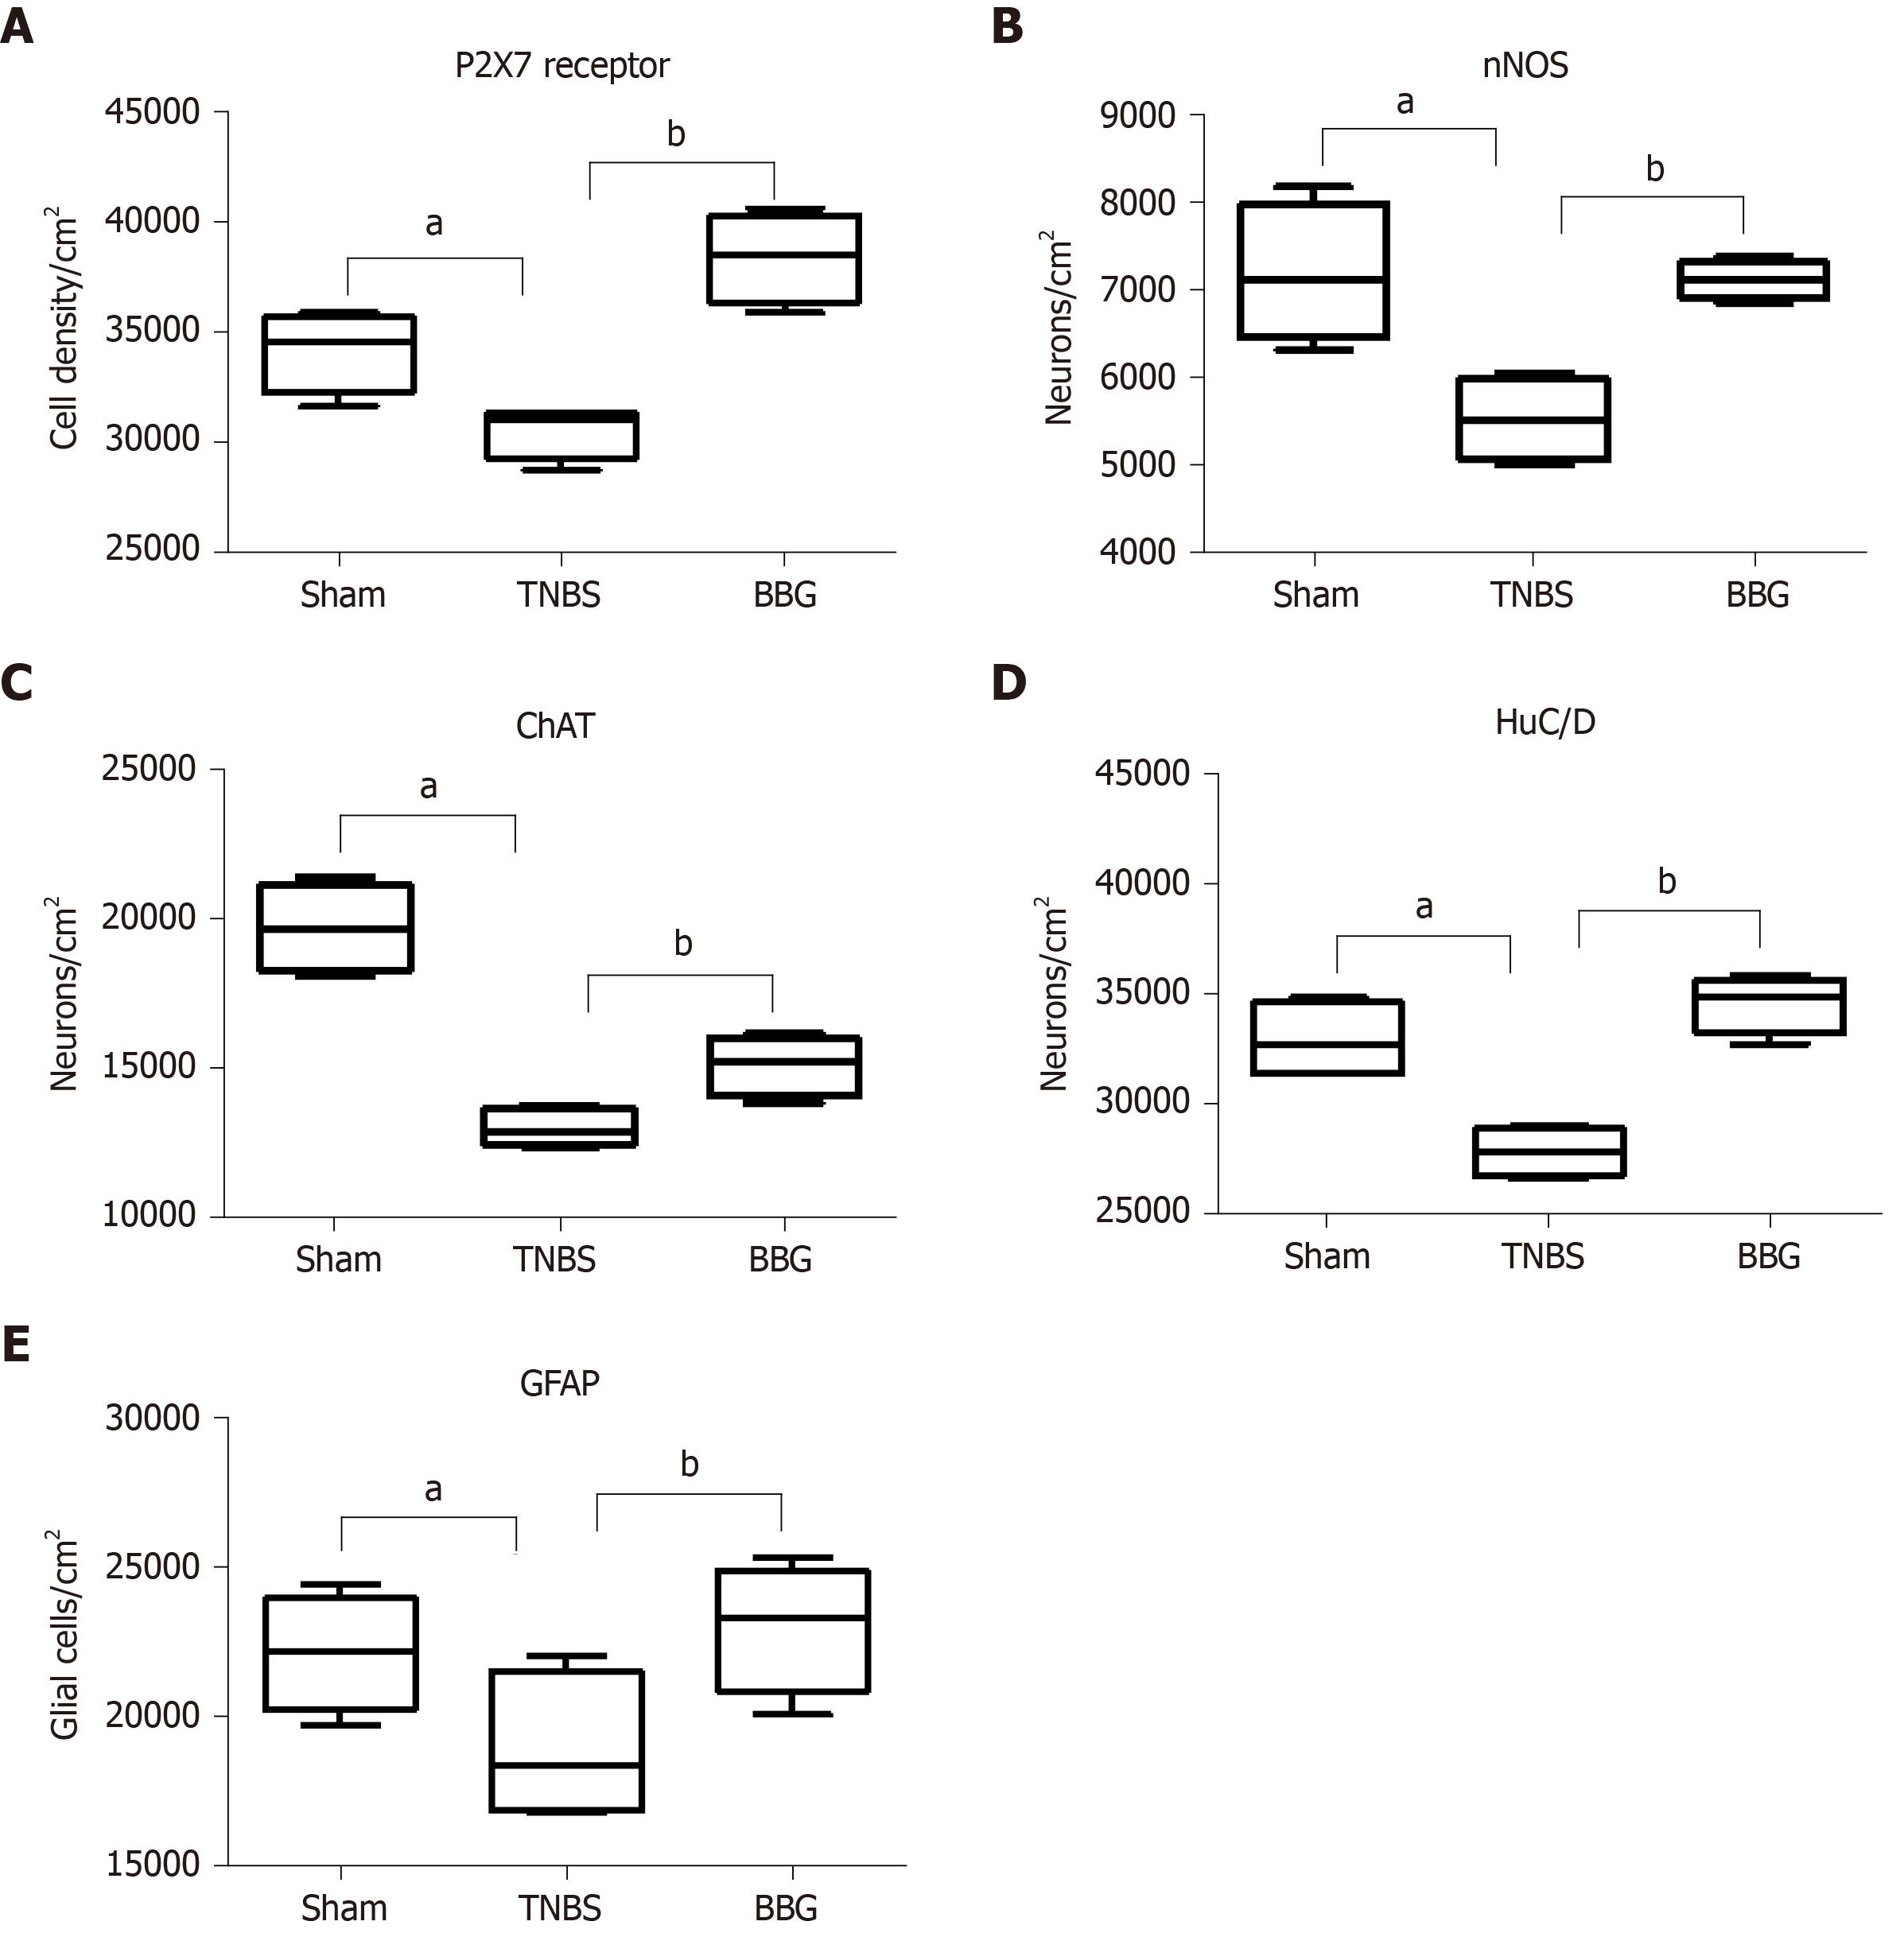
Figure 9 Density of neurons expression in neurons of the rat ileum myenteric plexus in the sham, 2,4,6-trinitrobenzene sulfonic acid and brilliant blue G groups.
A: P2X7 receptor; B: Neuronal nitric oxide synthase; C: Choline acetyltransferase; D: HuC/D; E: Glial fibrillary acidic protein. Counts were made in 40 representative fields for each antigen from each animal from the sham (n = 5), 2,4,6-trinitrobenzene sulfonic acid (TNBS) (n = 5) and brilliant blue G (BBG) groups (n = 5). Data were compared using analysis of variance and Tukey’s test for multiple comparisons as appropriate. P < 0.05 was considered statistically significant. aP < 0.05, comparing the TNBS group and sham group; bP < 0.05, comparing the BBG group and TNBS group. The data are expressed as mean ± SE. nNOS: Neuronal nitric oxide synthase; ChAT: Choline acetyltransferase; GFAP: Glial fibrillary acidic protein; TNBS: 2,4,6-trinitrobenzene sulfonic acid; BBG: Brilliant blue G.
- Citation: Souza RF, Evangelinellis MM, Mendes CE, Righetti M, Lourenço MCS, Castelucci P. P2X7 receptor antagonist recovers ileum myenteric neurons after experimental ulcerative colitis. World J Gastrointest Pathophysiol 2020; 11(4): 84-103
- URL: https://www.wjgnet.com/2150-5330/full/v11/i4/84.htm
- DOI: https://dx.doi.org/10.4291/wjgp.v11.i4.84


