Copyright
©The Author(s) 2016.
World J Radiol. Sep 28, 2016; 8(9): 799-808
Published online Sep 28, 2016. doi: 10.4329/wjr.v8.i9.799
Published online Sep 28, 2016. doi: 10.4329/wjr.v8.i9.799
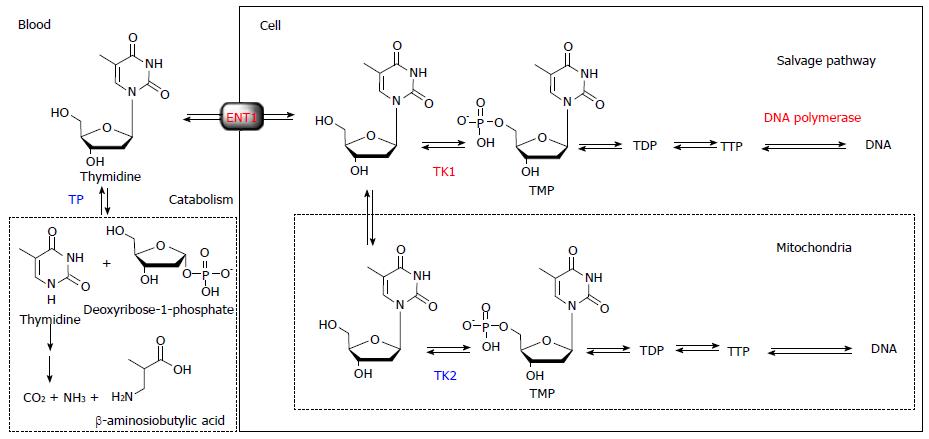
Figure 1 Rationale for designing an ideal DNA synthesis tracer for cell proliferation imaging.
The ideal tracer must block catabolism by thymidine phosphorylase, while retaining anabolism by the salvage pathway. ENT1: Equilibrative nucleoside transporter 1; TDP: Thymidine di-phosphate; TMP: Thymidine monophosphate; TTP: Thymidine tri-phosphate; TK1: Thymidine kinase 1; TK2: Thymidine kinase 2; TP: Thymidine phosphorylase.
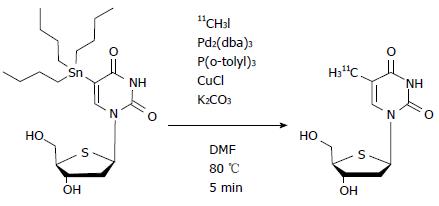
Figure 2 Radiosynthesis of 4’-[methyl-11C]-thiothymidine.
The imaging agent 11C-4DST was synthesized by methylation of 5-tributylstannyl-4'-thio-2'-deoxyuridine via a palladium-mediated Stille cross-coupling reaction with 11C-methyl iodide. 11C-4DST: 4’-[methyl-11C]-thiothymidine; DMF: N,N-Dimethylformamide; P(o-tolyl)3: Tri(o-tryl)phosphine; Pd2(dba)3: Tris(dibenzylideneacetone)dipalladium(0).
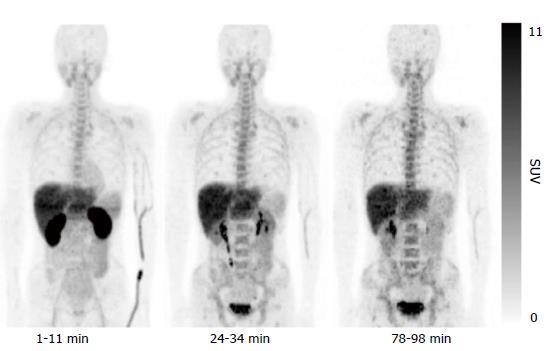
Figure 3 Representative whole-body decay-corrected maximum intensity-projection images of 4’-[methyl-11C]-thiothymidine positron emission tomography images.
11C-4DST showed high uptake in the excretory organs, such as the kidneys, liver, and urinary bladder. Moderate uptake was observed in the proliferative organs, such as bone marrow, spleen, and small intestine. The lowest uptake was observed in the non-proliferating tissues, such as muscle and lungs. This research was originally published in JNM[10]. 11C-4DST: 4’-[methyl-11C]-thiothymidine; SUV: Standardized uptake value.
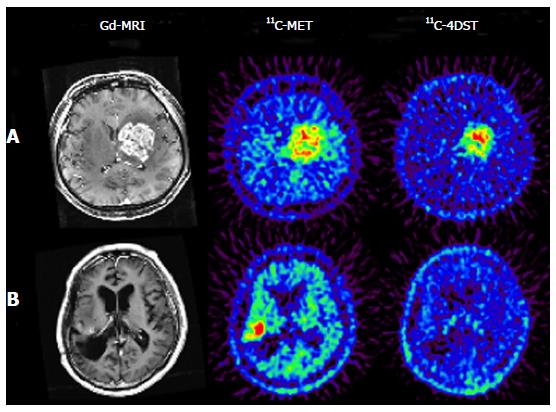
Figure 4 Brain tumor imaging in temozolomide-resistant (A) and -responsive (B) patients.
DNA synthesis images provide completely different information from those obtained with an amino acid transport agent. In the case of recurrent anaplastic oligodendroglioma (A), both 11C-MET and 11C-4DST showed high uptake in the gadolinium-enhanced region of the MRI. However, the distribution pattern of each tracer in the tumor region was not identical. The tumor in this patient showed progressive enlargement despite continuous treatment with the DNA alkylating agent temozolomide. In the case of recurrent anaplastic astrocytoma (B), the patient received one course of treatment with temozolomide 3 d before PET examinations, and it was found that the 11C-4DST uptake was negligible in the gadolinium-enhanced region where high uptake of 11C-MET was observed. The enhanced tumor mass in this patient remained unchanged over 6 mo after commencement of temozolomide treatment. These observations suggest that DNA synthesis in the tumor was suspended by temozolomide treatment. Reprinted from Nariai et al[14], with the permission of Springer. 11C-4DST: 4’-[methyl-11C]-thiothymidine; 11C-MET: 11C-Methionine; Gd-MRI: Gadolinium-enhanced magnetic resonance image; PET: Positron emission tomography.
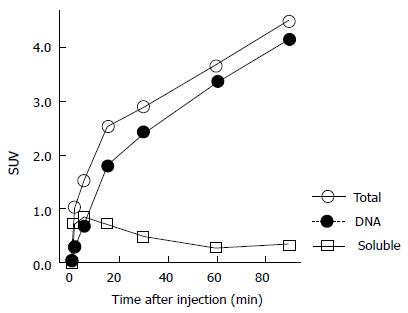
Figure 5 Time courses of 4’-[methyl-11C]-thiothymidine activity in the mouse duodenum.
The data is presented as the SUVmean in the indicated fractions (n = 3-5). Rapid DNA separation was performed using the DNAzol reagent[30]. The increase in total tissue radioactivity paralleled that of DNA incorporated radioactivity. The soluble fraction (4DST itself, phosphorylated 4DST, and other metabolites) was low and stable at 30 min after tracer injection. The contribution of the DNA incorporation process overshadows both the phosphorylation and dephosphorylation rates at later phases of the PET scan. PET: Positron emission tomography; SUV: Standardized uptake value.
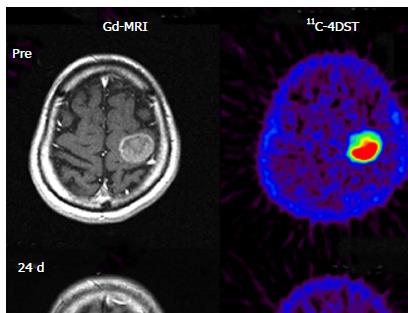
Figure 6 Early evaluation of the effectiveness of radiosurgery with 4’-[methyl-11C]-thiothymidine positron emission tomography.
A marked decrease in 11C-4DST uptake into metastatic lung cancer was observed 5 d after gamma knife radiosurgery. Although ring form enhancement with cystic formation did not disappear completely, tumor growth was halted by this treatment and the patient has maintained favorable activity of daily living 1 year after treatment. These observations indicated that the effectiveness of gamma knife therapy was correctly monitored by 11C-4DST only 5 d after treatment. Reprinted from Nariai et al[14], with the permission of Springer. 11C-4DST: 4’-[methyl-11C]-thiothymidine; Gd-MRI: Gadolinium-enhanced magnetic resonance image.
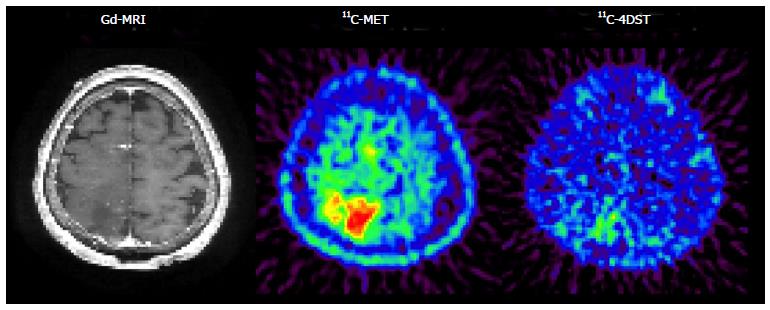
Figure 7 4’-[methyl-11C]-thiothymidine uptake in oligodendroglioma.
A patient was diagnosed with grade 2 astrocytoma during the initial operation. At the 1-year follow-up, an enhanced lesion appeared on MRI and 11C-MET uptake increased around the initially resected lesion. These findings suggested that the malignant transformation of astrocytoma occurred. However, 11C-4DST uptake into the tumor was not different from basal brain levels. The pathological diagnosis at the second operation was grade 2 oligodendrocytoma with a newly appearing oligodendroglioma component, but without malignant transformation. Reprinted from Nariai et al[14], with the permission of Springer. 11C-4DST: 4’-[methyl-11C]-thiothymidine; 11C-MET: 11C-Methionine; Gd-MRI: Gadolinium-enhanced magnetic resonance image.
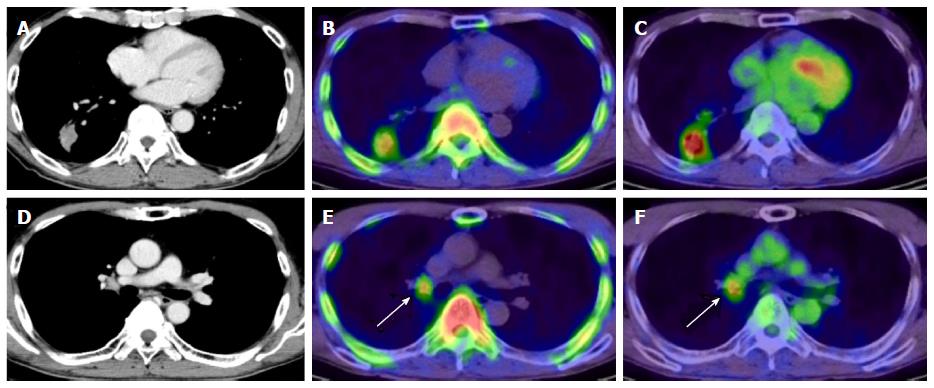
Figure 8 4’-[methyl-11C]-thiothymidine images in non-small cell lung cancer.
Axial images of CT (A), 11C-4DST PET (B), and 18F-FDG PET (C) in a 58-year-old man with lung adenocarcinoma in the right lower lobe. Radioactivity of 11C-4DST in the ascending aorta (representing blood pool) is lower than that of 18F-FDG. Both 11C-4DST and 18F-FDG clearly visualize lung lesions. Right hilar lymph node metastasis is confirmed on CT (D), and uptake of both 11C-4DST PET (E) and 18F-FDG PET (F) identifies the lesion (arrow). However, 11C-4DST images are clearer than 18F-FDG images because of low physiologic 11C-4DST in the mediastinum (blood pool). This research was originally published in JNM[22]. 11C-4DST: 4’-[methyl-11C]-thiothymidine; PET: Positron emission tomography; 18F-FDG: 2-Deoxy-2-[18F]fluoro-D-glucose; CT: Computed tomography.
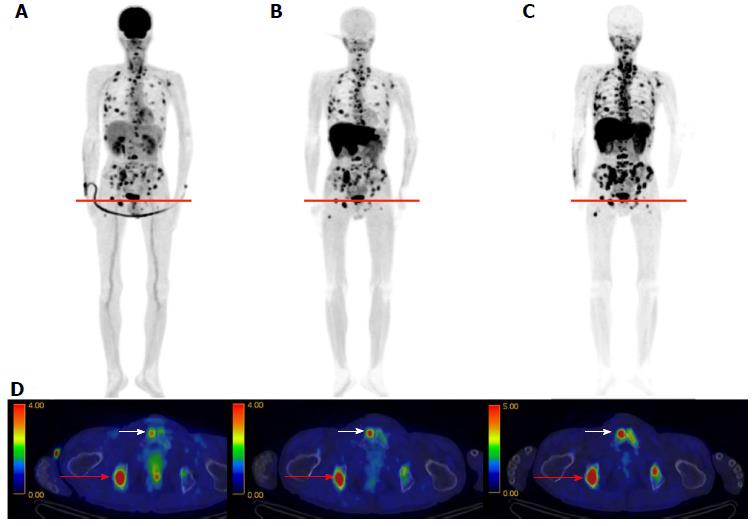
Figure 9 4’-[methyl-11C]-thiothymidine images in multiple myeloma.
18F-FDG (A), 11C-MET (B), and 11C-4DST (C) PET images obtained in a 63-year-old man with multiple myeloma. Numerous active lesions are visible in the three maximum intensity projection images. The fusion images are for the cross-section at the level indicated by the red lines (D). The lesion in the right ischium (red arrow) was positive in all three PET scans. However, the lesion in the right pubis (white arrow) was only positive on the 11C-MET and 11C-4DST PET scans and was equivocal on the 18F-FDG PET scan. Reprinted from Okasaki et al[24], with the permission of Springer. 11C-4DST: 4’-[methyl-11C]-thiothymidine; 11C-MET: 11C-Methionine; 18F-FDG: 2-Deoxy-2-[18F]fluoro-D-glucose; PET: Positron emission tomography.
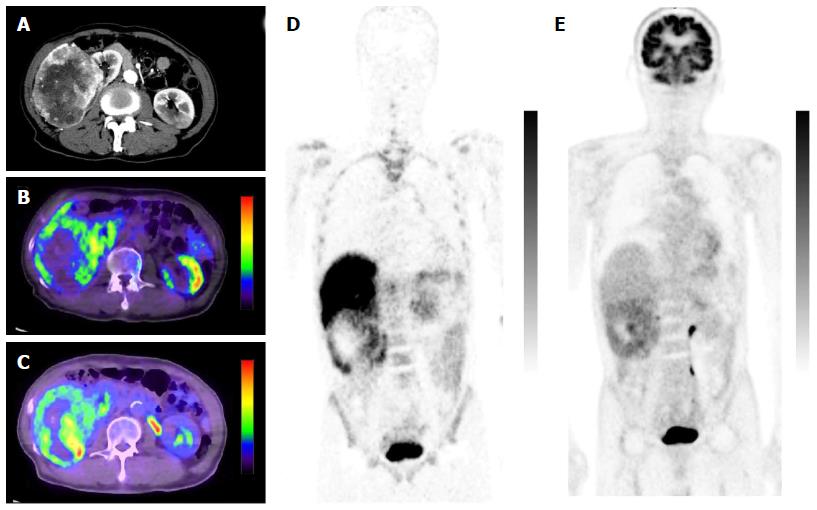
Figure 10 4’-[methyl-11C]-thiothymidine images in clear cell renal carcinoma.
A 78-year-old male with a clear cell renal carcinoma (RCC) in the right kidney. Contrast-enhanced abdominal CT (A), fused 11C-4DST PET/CT (axial image) (B), fused 18F-FDG PET/CT (axial image) (C), coronal 11C-4DST PET (D), and coronal 18F-FDG PET (E) images are shown. The uptake of 11C-4DST was predominantly near the outer surface of the RCC tumor; the uptake of 18F-FDG was more diffuse. Reprinted from Minamimoto et al[25], with the permission of Springer. 11C-4DST: 4’-[methyl-11C]-thiothymidine; 18F-FDG: 2-Deoxy-2-[18F]fluoro-D-glucose; PET: Positron emission tomography; CT: Computed tomography.
- Citation: Toyohara J. Evaluation of DNA synthesis with carbon-11-labeled 4′-thiothymidine. World J Radiol 2016; 8(9): 799-808
- URL: https://www.wjgnet.com/1949-8470/full/v8/i9/799.htm
- DOI: https://dx.doi.org/10.4329/wjr.v8.i9.799


