Copyright
©The Author(s) 2016.
World J Radiol. Feb 28, 2016; 8(2): 183-191
Published online Feb 28, 2016. doi: 10.4329/wjr.v8.i2.183
Published online Feb 28, 2016. doi: 10.4329/wjr.v8.i2.183
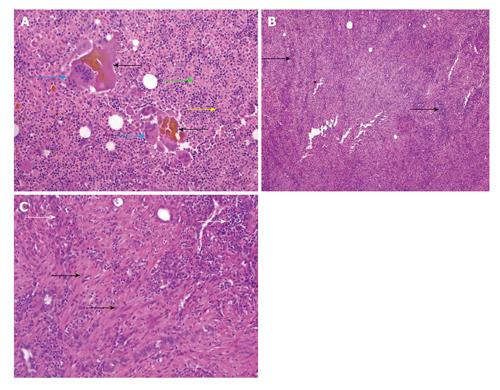
Figure 1 High power and low power view.
A: High power (HE, 200 ×) view showing inspissated bile (black arrows) with giant cells (blue arrows) in the vicinity. Green arrows denote histiocytes while the yellow arrows denote lymphoid cells; B: Low power (HE, 40 ×) view showing sheets of lympho-histiocytes in the gallbladder wall; C: High power (HE, 200 ×) view showing myofibroblasts (black arrows) with inflammatory cells (white arrows).
Figure 2 Immunohistochemistry revealing positivity for CD68 signifying sheets of histiocytes.
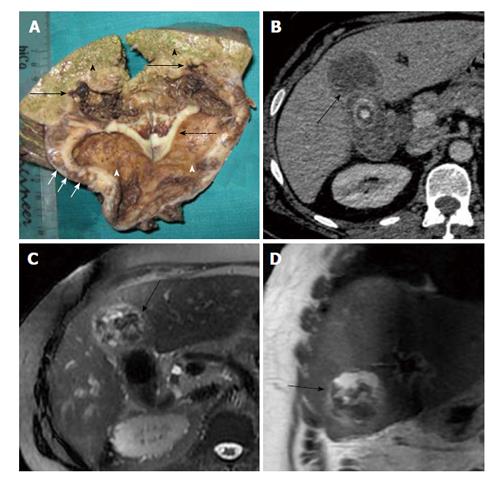
Figure 3 Rupture of gallbladder serosal lining and spread of the inflammatory response leads to adhesions with adjacent liver, duodenum and transverse colon.
Gross pathology specimen (A) demonstrating a thickened gallbladder wall (dotted arrow) showing multiple yellowish nodules (xanthoma nodules) within (short arrows). Infiltration into the adjoining liver parenchyma is seen (black arrows). Black arrowheads denote the normal liver parechyma while the white arrowheads denote gallbladder lumen. Corresponding computed tomography images (B) of the same patient showing focal mural thickening involving the gallbladder fundal region with poor fat planes and infiltration into the adjacent hepatic parenchyma (black arrows). Magnetic resonance axial and coronal images (C and D) of the same patient showing heterogeneous mass like thickening involving the gallbladder fundal region with poor fat planes to adjacent hepatic parenchyma (black arrows).
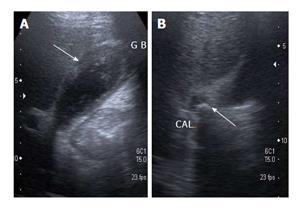
Figure 4 Ultrasound image showing a well distended gallbladder.
The diffuse hyperechoic wall thickening (arrow, A) and obstructive calculus in gallbladder neck region (arrow, B). GB: Gallbladder.
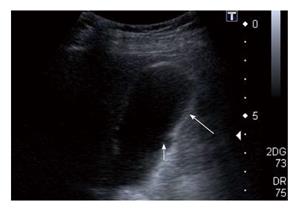
Figure 5 A well distended gallbladder showing diffuse hyperechoic wall thickening (long arrow).
Note is made of a small mucosal defect (short arrow) with a small hypoechoic collection in thickened gallbladder wall.
Figure 6 Axial computed tomography section showing multiple hypodense nodules (black arrows) in a diffusely thickened gallbladder wall (A) and the same patient showing gallbladder neck calculus (white arrow) (B).
Also seen is an area of mucosal defect with associated small intramural collection (black arrowhead).
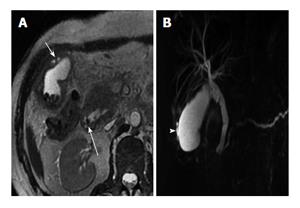
Figure 7 Axial T2W image (A) and corresponding magnetic resonance cholangiopancreatography image (B).
Axial T2W image (A) showing multiple gallbladder calculi with a diffusely thickened wall showing multiple intramural nodules (short arrow). Note is also made of a small filling defect involving the ampullary common duct (long arrow). Corresponding MRCP image (B) showing multiple intramural nodules (white arrowhead) along with a dilated pancreatico-biliary system secondary to calculus in ampullary region. MRCP: Magnetic resonance cholangiopancreatography.
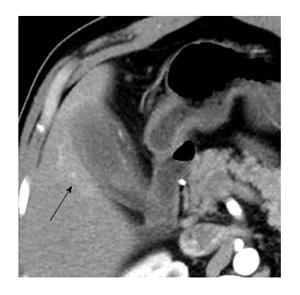
Figure 8 Axial arterial phase computed tomography image showing an area of hyper perfusion in the segment V of liver adjoining a gallbladder showing diffusely thickened walls.
Also noted is the blurring of interfaces between gallbladder wall and adjoining liver parenchyma. Liver infiltration can demonstrate an early enhancement of the parenchyma which pathologically corresponds with accumulation of inflammatory cells and abundant fibrosis.
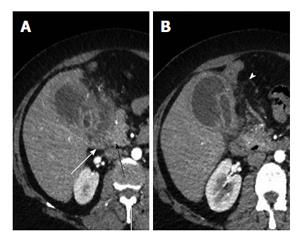
Figure 9 Axial computed tomography sections (A and B) showing thickened and irregular walls with small intramural and pericholecystic collections.
Note the extension of the inflammatory process to involve the duodenum (white arrow) and pancreatic head (black arrow). Also pericholecystic fat strandings are seen (white arrowhead).
Figure 10 Axial sequential T2W magnetic resonance images (A-D) showing multiple hyper-intense intramural collections in gallbladder (long arrow) with extension of inflammatory process into the pericholecystic region, poor fat planes and involvement of the anterior abdominal wall (multiple short arrows).
Note presence of intraluminal calculus (white arrowhead).
Figure 11 Coronal computed tomography section image showing multiple hypodense nodules (short arrows) in thickened gallbladder wall with an associated abscess in the adjoining liver (long arrow).
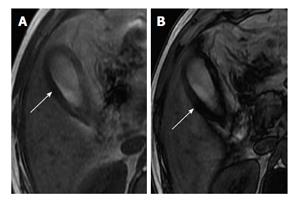
Figure 12 3.
0 T magnetic resonance axial chemical shift imaging using in-phase (A) and out-phase sequences (B). Presence of intramural fat is markedly evident in the form of loss of signal from gallbladder wall on out of phase imaging (arrow) compared to in-phase image (arrow).
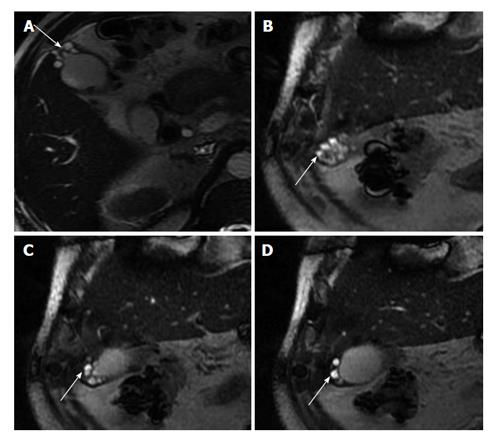
Figure 13 Axial (A) and coronal (B-D) T2W magnetic resonance images showing multiple curvilinearly arranged hyperintense intramural cavities (arrows) in gallbladder fundal region (“pearl necklace” appearance) - a characteristic feature of gallbladder adenomyomatosis.
- Citation: Singh VP, Rajesh S, Bihari C, Desai SN, Pargewar SS, Arora A. Xanthogranulomatous cholecystitis: What every radiologist should know. World J Radiol 2016; 8(2): 183-191
- URL: https://www.wjgnet.com/1949-8470/full/v8/i2/183.htm
- DOI: https://dx.doi.org/10.4329/wjr.v8.i2.183


